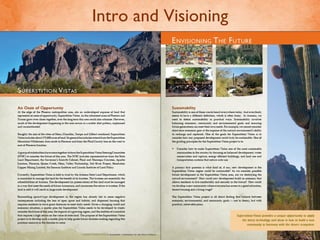
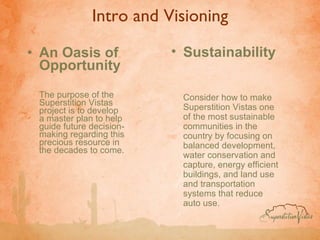
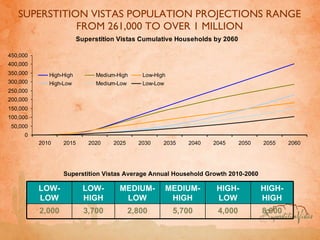
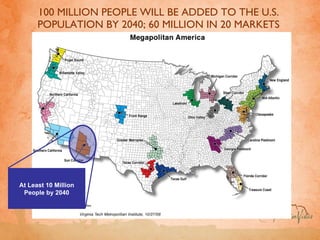
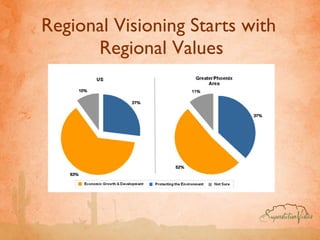
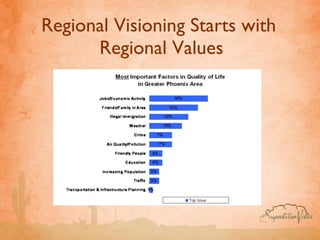
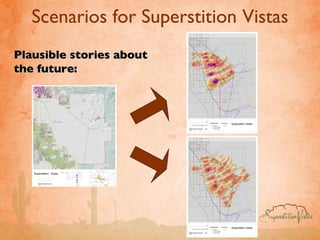
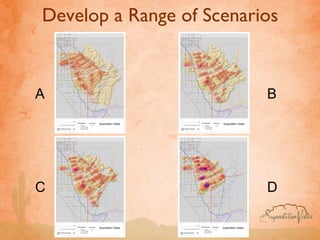
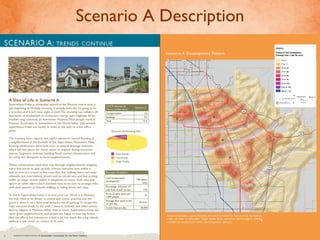
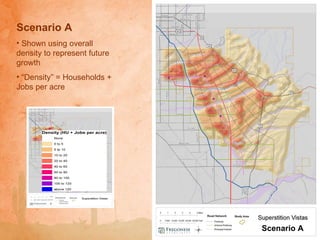
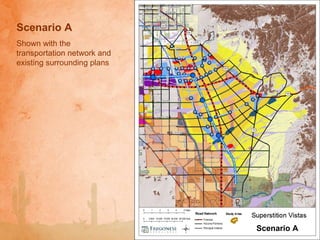
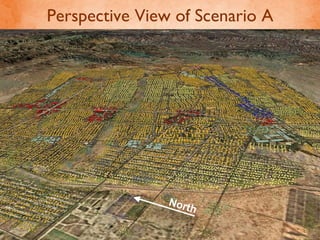
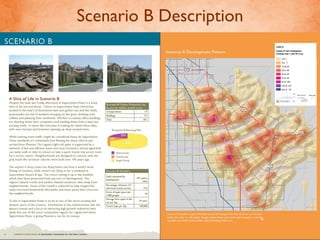
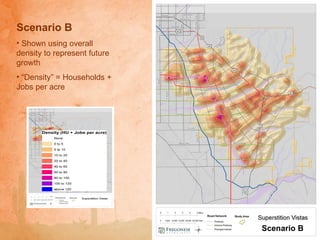
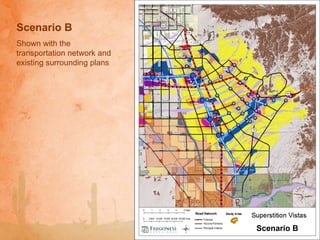
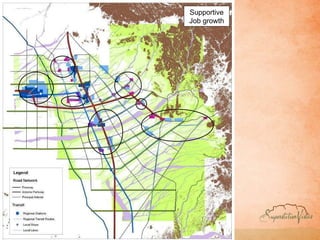
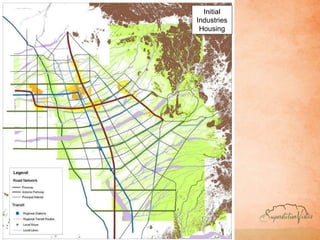
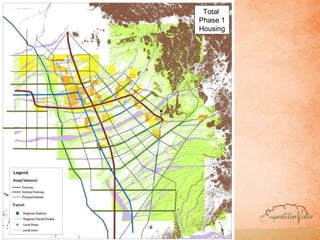
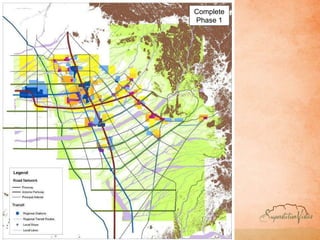
8. SUPERSTITION VISTAS POPULATION PROJECTIONS RANGE FROM 261,000 TO OVER 1 MILLION Superstition Vistas Average Annual Household Growth 2010-2060 8,000 4,000 5,700 2,800 3,700 2,000 HIGH-LOW HIGH-HIGH MEDIUM-HIGH MEDIUM-LOW LOW-HIGH LOW-LOW
9. 100 MILLION PEOPLE WILL BE ADDED TO THE U.S. POPULATION BY 2040; 60 MILLION IN 20 MARKETS At Least 10 Million People by 2040
53. Urban Heat Island One of the most pressing issues for the Phoenix area is finding ways to reduce urban heat island. Temperatures in Phoenix are 5 to 6 degrees hotter than surrounding undeveloped areas – largely because the surfaces of urban areas trap and reradiate heat. With the average temperatures forecasted to rise several degrees in the summer over the next 50 years, keeping our cities cool is vital for urban livability, as well as to reduce the amount of energy used for cooling.
54.
55.
56. Economic Development Catalysts for Southeast Region Destination health campus, emphasis on research Health Care/Health Sciences Connections to Phoenix and Pinal, within SV Commuter Rail Viable alternative to I-10 leads through SV Freeways Significance of John Wayne Airport Phoenix-Mesa Gateway Influence Comprehensive regional open space strategy Open Spaces and Parks/Recreation Several regional HQs, one or two national HQs Major Employer Campuses/National Headquarters New public or private university on site Higher Education Leading edge of best practices Energy Sustainability/Climate Cultural facilities of regional importance Cultural Amenities Visitation patterns established; resort/convention hotels Resort/Hospitality/Tourism/Entertainment
57.
58. Industry Priorities Tier 1 – Early Phase Tier 2 - Intermediate Tier 3 – Late Stage Waste Management Tour Operators Plastics Food processing Golf Courses Construction Sand and Gravel Theme Parks Mining Support Activities Advanced Manufacturing Warehouse Distribution Motion Picture Production Construction Park Resort Clean Energy Gen Higher Education Leading Agents, Writers, Performers Spectator Sports Outdoor Automotive Environmental Consulting Clean Energy Man Medical R&D/Bio Tech/AG Pharmaceuticals Advance Business Services Information Technology Research Parks Middle Performing Arts Companies Spectator Sports Indoor Museums, Zoos Convention and Trade Show Data Processing R&D Aerospace Telephone Call Centers Admin Support Finance/ Insurance Corp. Offices Late
61. Each Industry is assigned a basic building type for its employment 90% 10% 5% Advanced Manufacturing 95% 5% 5% Warehouse Distribution 95% 5% 10% Motion Picture Production 95% 5% 15% Construction Park 15% 85% 15% Resort 90% 10% 15% Clean Energy Generation 90% 10% 35% Higher Education Industrial Space Office space Retail space Share of Employment Industry
62.
63. Tier 1 Totals 2862 Residential Subdivision 1416 Traditional Neighborhood (TND) 631 Master Planned Community 1604 Industrial 328 Business Park 59 Town Center 152 Traditional Downtown 81 Urban Core Acres Allocated Development Type 13,228 Industrial 11,756 Office 8,745 Retail 33,728 Total Employment 37,582 Total Dwelling Units Totals Housing and Jobs
64.
65. Tier 1 Basic Jobs Higher Education Clean energy generation Resort Construction Park Film production Warehouse distribution Advanced Manufacturing New urban centers Employment cores
76. Estimating the Affordability of Prototype Units (Rental) 3 Story Apartment $950 month/rent = $38,000 annual income 8-Story Mixed Use Retail/Residential $1,400 month/rent = $56,000 annual income
77. Estimating the Affordability of Prototype Units (Owner) 2 Story Single Family $322,000 sales price = $76,500 annual income * 2 Story Townhome $250,000 sales price = $66,000 annual income * * Assumes 10% down payment, 7% interest, 30 year term
78. Estimating the Affordability of Prototype Units (Owner) Large Lot Single Family $570,000 sales price = $135,000 annual income * * Assumes 10% down payment, 7% interest, 30 year term