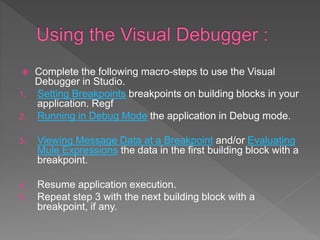
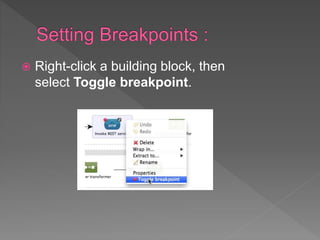
 This section describes how to debug your
Mule application using:
 Studio Visual Debugger
 TroubleShooting
 Studio’s Visual Debugger allows you to run your
application in Debug mode, stopping execution to check
the contents of a message at previously-specified building
blocks.
 To do this, you set a breakpoint at any building block in
your flow that you wish to check or test (see image below).
When you run your application in Debug mode, the
application stops immediately after executing the building
block with the breakpoint. Using the Mule Debugger
View, you can browse through the contents of the
message as it exists at that point in the flow, and
evaluate Mule Expressions against the message.
 Complete the following macro-steps to use the Visual
Debugger in Studio.
1. Setting Breakpoints breakpoints on building blocks in your
application. Regf
2. Running in Debug Mode the application in Debug mode.
3. Viewing Message Data at a Breakpoint and/or Evaluating
Mule Expressions the data in the first building block with a
breakpoint.
4. Resume application execution.
5. Repeat step 3 with the next building block with a
breakpoint, if any.
 Right-click a building block, then
select Toggle breakpoint.
 In the Package Explorer pane, right-click
your application, then select Debug
As> Mule Application. Studio begins
running the application in Debug mode, and
displays the Confirm Perspective
Switch window.
 When you begin running your application in
Debug mode, Mule opens the Mule
Debugperspective. Until a message arrives
at the first breakpoint, the Mule Debugger
View in the console displays a message that
reads, "Connected with mule ESB. Waiting
for a mule message to arrive!"
 The image below illustrates the Mule Debug
perspective.
 This section introduces a number of
techniques useful in troubleshooting Mule
problems and in gathering information for
technical support.
 Configuring Mule Stacktraces
 Debugging Outside Studio
 Logging
 By default Mule will filter out some internal
class references from stacktraces to produce
a more readable output. This behavior can
be controlled one of three ways:
 Command-line arguments
 Setting properties in Mule Studio
 Using JMX
 In Anypoint Studio, you can use the Studio
Visual Debugger to help you troubleshoot
your app. If you’re creating your Mule app
oustide Studio, you can resort to the
following options:
 When Running From Eclipse : Select the
"Debug As > Mule Server" start-up mode
from your configuration file. Any breakpoint
you will have set in your custom code or
Mule’s source code will suspend the
 When Running Mule Standalone :You need
to start Mule with the -debug to activate
remote debugging, which gives (on Linux):
$MULE_HOME/bin/mule -debug
 With this option, Mule will start normally with
the only difference being the following
message logged in the console:
Listening for transport dt_socket at
address: 5005
 he less high-tech and most popular of all
debugging techniques is the usage of log
statements in order to follow the evolution of
an application’s state. In Mule, the state
you’re interested in resides in the messages
that are flowing through your configuration
and, possibly, custom code.
 If you’re running your Mule configuration
from Eclipse, the log outputs are visible right
in Eclipse console window. If you’re running
Thank You!!!!!!!!

Mule debugging

  • 2.
     This sectiondescribes how to debug your Mule application using:  Studio Visual Debugger  TroubleShooting
  • 3.
     Studio’s VisualDebugger allows you to run your application in Debug mode, stopping execution to check the contents of a message at previously-specified building blocks.  To do this, you set a breakpoint at any building block in your flow that you wish to check or test (see image below). When you run your application in Debug mode, the application stops immediately after executing the building block with the breakpoint. Using the Mule Debugger View, you can browse through the contents of the message as it exists at that point in the flow, and evaluate Mule Expressions against the message.
  • 4.
     Complete thefollowing macro-steps to use the Visual Debugger in Studio. 1. Setting Breakpoints breakpoints on building blocks in your application. Regf 2. Running in Debug Mode the application in Debug mode. 3. Viewing Message Data at a Breakpoint and/or Evaluating Mule Expressions the data in the first building block with a breakpoint. 4. Resume application execution. 5. Repeat step 3 with the next building block with a breakpoint, if any.
  • 5.
     Right-click abuilding block, then select Toggle breakpoint.
  • 6.
     In thePackage Explorer pane, right-click your application, then select Debug As> Mule Application. Studio begins running the application in Debug mode, and displays the Confirm Perspective Switch window.
  • 7.
     When youbegin running your application in Debug mode, Mule opens the Mule Debugperspective. Until a message arrives at the first breakpoint, the Mule Debugger View in the console displays a message that reads, "Connected with mule ESB. Waiting for a mule message to arrive!"  The image below illustrates the Mule Debug perspective.
  • 10.
     This sectionintroduces a number of techniques useful in troubleshooting Mule problems and in gathering information for technical support.  Configuring Mule Stacktraces  Debugging Outside Studio  Logging
  • 11.
     By defaultMule will filter out some internal class references from stacktraces to produce a more readable output. This behavior can be controlled one of three ways:  Command-line arguments  Setting properties in Mule Studio  Using JMX
  • 12.
     In AnypointStudio, you can use the Studio Visual Debugger to help you troubleshoot your app. If you’re creating your Mule app oustide Studio, you can resort to the following options:  When Running From Eclipse : Select the "Debug As > Mule Server" start-up mode from your configuration file. Any breakpoint you will have set in your custom code or Mule’s source code will suspend the
  • 13.
     When RunningMule Standalone :You need to start Mule with the -debug to activate remote debugging, which gives (on Linux): $MULE_HOME/bin/mule -debug  With this option, Mule will start normally with the only difference being the following message logged in the console: Listening for transport dt_socket at address: 5005
  • 14.
     he lesshigh-tech and most popular of all debugging techniques is the usage of log statements in order to follow the evolution of an application’s state. In Mule, the state you’re interested in resides in the messages that are flowing through your configuration and, possibly, custom code.  If you’re running your Mule configuration from Eclipse, the log outputs are visible right in Eclipse console window. If you’re running
  • 15.