This document summarizes a study that used reactive molecular dynamics (RMD) simulations to investigate the reaction mechanisms of the methanol to olefin (MTO) process over ZSM-5 zeolite catalysts. Three types of simulation models were used: methanol/acidic zeolite, ethene/methoxylated zeolite, and a complex methanol/ethene/acidic zeolite system. The simulations identified several reaction pathways and intermediates. Comparisons between the initial reactions of the pure systems found carbon chain growth to be the rate determining step, with a lower activation energy than methanol decomposition.
This document outlines a 4 step process to synthesize R-(-)-sec-butylamine from 2-butanol:
1) Oxidation of 2-butanol to form 2-butanone using chromium reagents.
2) Reductive amination of 2-butanone to form racemic sec-butylamine.
3) Formation of diastereomeric salts with (R,R)-tartaric acid to separate the enantiomers.
4) Basic hydrolysis recovers the desired R-(-)-sec-butylamine enantiomer.
IOSR Journal of Applied Chemistry (IOSR-JAC) is an open access international journal that provides rapid publication (within a month) of articles in all areas of applied chemistry and its applications. The journal welcomes publications of high quality papers on theoretical developments and practical applications in Chemical Science. Original research papers, state-of-the-art reviews, and high quality technical notes are invited for publications.
This document provides practice problems for organic chemistry students related to alkene reactions and mechanisms. It includes 24 practice reaction prediction problems, followed by multiple choice conceptual questions about alkene reactions, mechanisms, and organic synthesis. The document tests students' understanding of key organic chemistry concepts like regioselectivity, stereochemistry, reaction mechanisms, and multi-step synthesis.
The racemic dibromide undergoes an E2 elimination with pyridine as the base to give the trans product selectively. This is because the anti-periplanar conformation required for E2 is favored for one enantiomer due to less steric interaction between the phenyl groups.
The meso dibromide cannot undergo such a stereospecific E2 reaction. Instead, it undergoes a thermally allowed homolytic cleavage of the weaker C-Br bond to eliminate Br2. This reaction does not require a particular transition state geometry.
The document describes different types of chromatography classified based on separation mode, mobile phase, and stationary phase form. It focuses on liquid chromatography, specifically liquid-solid chromatography and liquid-liquid chromatography. Liquid-solid chromatography separates components based on competition for active sites on a solid adsorbent like silica gel. Liquid-liquid chromatography uses a liquid stationary phase coated on a solid support, separating components via partitioning between two immiscible liquid phases. Ion-exchange chromatography separates ionic compounds based on competition for ion-exchange resin active sites.
This document contains 50 questions asking students to draw diagrams related to chemistry concepts and experiments. The questions cover topics like particle arrangements, electron configurations, apparatus setups for experiments determining properties like melting point and empirical formulas, electrolysis experiments, voltaic and Daniell cells, titration setups, polymerization reactions, structural formulas for organic compounds, energy diagrams, and diagrams of soap and detergent molecules. The purpose seems to be to test students' understanding of chemistry concepts and ability to diagram experimental procedures and molecular structures.
1. Organic chemistry deals with carbon compounds. Naming organic compounds involves identifying the carbon chain, functional group, and structure. (2)
2. Alkanes have single bonds between carbons and are generally unreactive except for combustion and halogen substitution reactions. Alkenes contain double bonds and undergo addition reactions. (3)
3. Physical properties like boiling point depend on molecular mass and structure. Functional groups determine solubility and chemical reactivity. Structural isomers have the same molecular formula but different bonding arrangements. (3)
1) A kinetic method is proposed for the determination of uranium(VI) based on its catalytic action on the decomposition of hydrogen peroxide in alkaline media.
2) The method was optimized and the kinetic expression was derived. Uranium(VI) can be determined in the concentration range of 0.8 to 6.4 μg/ml using the tangent method.
3) The method is selective and enables determination of uranium(VI) in the presence of high concentrations of various interfering ions. It was applied to determine uranium in phosphoric acid and phosphate ores with results matching another method.
Microchimica Acta Volume 84 issue 5-6 1984 [doi 10.1007_bf01197162] G. A. Mil...Sekheta Bros Company
This document describes a kinetic method for determining morphine concentration in urine samples. The method involves reacting morphine in the sample with hydrogen peroxide and cobalt(II) ions to form a colored compound. The rate of decomposition of this compound is measured photometrically and is directly proportional to the concentration of morphine over a certain range. The method was found to accurately determine morphine concentrations from 1.5 to 12.3 μg/ml in urine samples. It was also applied to analyze urine samples from individuals suspected of taking morphine or heroin and the results correlated well with an established HPLC method.
This document discusses carboxylic acids, including their structural formulas, naming conventions, properties, and methods of formation. Carboxylic acids contain a carboxyl functional group (-COOH) and can exist as resonance structures as carboxylate ions (-COO-). They are easily formed from alcohols, aldehydes, alkyl benzenes, nitriles, amides, dry ice, acyl chlorides, acid anhydrides, and esters. Acetic acid is the most important carboxylic acid and is used in vinegar, drugs, dyes, and more. Common carboxylic acids are also listed with their sources.
1. The document discusses various techniques for asymmetric synthesis including asymmetric catalytic reduction, oxidation, and hydrogenation.
2. Asymmetric catalytic reduction uses chiral catalysts like RuCl2 [(R)-BINAP] to reduce pro-chiral compounds to chiral products. The Noyori asymmetric hydrogenation reduces β-keto esters.
3. Asymmetric catalytic oxidation uses catalysts like Sharpless epoxidation and Shi epoxidation to oxidize substrates and form enantiopure products. The Jacobsen epoxidation and Sharpless asymmetric dihydroxylation are examples.
1. The document discusses structural isomers, which are compounds with the same molecular formula but different connectivity of atoms in the skeletal structure.
2. Examples of low molecular weight alkanes (methane to pentane) are used to illustrate how the number of possible structural isomers increases with more carbon atoms. Butane and isobutane are given as an example of structural isomers.
3. Guidelines are provided for systematically drawing out all possible isomers, such as starting with the longest carbon chain and then adding branches in all nonterminal positions to avoid increasing the chain length. This allows different skeletal structures to be identified for compounds with the same molecular formula.
Mass spectrometry is a technique used to identify molecules based on their mass. It works by ionizing molecules and separating the resulting ions based on their mass-to-charge ratio. The document discusses the basic principles and components of a mass spectrometer, including ionization, separation, detection, and fragmentation patterns. Common rules for how different types of molecules like hydrocarbons, alcohols, aromatics, and others fragment are also covered.
The document discusses various fragmentation patterns seen in mass spectrometry for different functional groups. For alcohols, cleavage of the carbon-carbon bond adjacent to the oxygen is common, as is loss of a water molecule. Aromatic ethers often fragment through cleavage of the carbon-oxygen bond or rearrangement within the aromatic ring. Carboxylic acids may lose a hydroxyl group or carboxyl group through cleavage of bonds adjacent to the carbonyl. The presence of halides is indicated by isotopic peaks from chlorine or bromine atoms.
AP Chemistry Chapter 16 Sample ExercisesJane Hamze
The document provides sample exercises for calculating concentrations of conjugate acids and bases, writing equations for acid-base reactions, and predicting equilibrium positions. It asks the reader to identify conjugate acid-base pairs, write equations, and use data like Figure 16.4 to determine if an equilibrium lies to the left or right. Multiple examples are provided and answered to demonstrate techniques for acid-base calculations and equilibrium predictions.
This document contains an example chemistry question from an exam with multiple parts asking about reaction rates and mechanisms. It provides sample solutions for: (1) writing rate equations and explaining how temperature affects reaction rate; (2) calculating time for a reaction to reach a concentration using half-life; (3) explaining how changing concentrations affects rate; (4) drawing an enthalpy profile diagram for a reaction mechanism; (5) explaining observations of precipitation reactions; and (6) describing chemical tests to distinguish between compounds involving addition of reagents and observation of results. Diagrams and chemical equations are included as part of the responses.
This document provides an overview of acids and bases including:
- Definitions of acids and bases according to Arrhenius, Brønsted-Lowry, and Lewis theories
- How acids and bases react in water, forming conjugates
- Factors that influence acid and base strength such as polarity, resonance, and electronegativity
- Calculations involving acid and base dissociation constants (Ka and Kb) to determine pH
1) Secondary ion mass spectrometry (SIMS) involves firing primary ions at a solid surface, which sputters secondary ions, electrons, and neutrals that can be analyzed with a mass spectrometer.
2) SIMS provides highly surface sensitive analysis but has limitations such as limited sample size and overlapping spectra. Multivariate analysis techniques like principal component analysis and canonical variates analysis are used to analyze SIMS data.
3) SIMS can produce 2D spatially resolved chemical images of sample surfaces by collecting full mass spectra at each pixel. Techniques like maximum autocorrelation factor analysis incorporate spatial information with spectral data for more detailed analysis of SIMS images.
This document discusses the hydrolysis of 2-bromopropane. It finds the reaction exhibits both first-order and second-order kinetics, indicating contributions from SN1 and SN2 pathways. The percentage of the reaction proceeding by the SN2 pathway increases with higher hydroxide ion concentration and the activation energy is lower for SN2 than SN1, showing SN2 is favored. Two possible organic byproducts are an alkene from elimination and another alcohol from further reaction of the main product.
AP Chemistry Chapter 17 Sample ExercisesJane Hamze
This document provides two sample exercises for calculating pH at different points in a titration reaction between a strong acid (HCl) and a strong base (NaOH).
In the first exercise, the pH is calculated when 49.0 mL of 0.1 M NaOH has been added to 50.0 mL of 0.1 M HCl. At this point, just before the equivalence point, the pH is determined by the small amount of unreacted HCl.
In the second exercise, the pH is calculated when 51.0 mL of NaOH has been added, just past the equivalence point. Here the pH is determined by the small excess of OH- ions remaining after the HCl is fully
This document summarizes key reactions of alkenes, including addition reactions and mechanisms. It discusses catalytic hydrogenation, electrophilic additions, hydroboration-oxidation, carbene and radical additions, polymerization, and the roles of alkenes in natural products like pheromones. It also provides examples of alkene reactions in nature, like steroid synthesis, and commercial applications, such as in polyethylene and margarine production.
Occurrence of Iodinated-THMs in UK Drinking WatersSimon Parsons
The document discusses a study on iodinated trihalomethanes (I-THMs) in UK drinking waters. The key findings are:
1) A switch from chlorination to chloramination may increase formation of iodinated DBPs such as I-THMs.
2) I-THM levels were highest in summer and levels of iodo-THMs were generally higher than national survey data.
3) I-THM levels correlated with iodide levels in source waters.
Proteins are composed of amino acids linked together by peptide bonds. There are 20 standard amino acids that make up proteins. Amino acids have different properties depending on their side chains, which can be nonpolar, polar, acidic, or basic. When amino acids join together via peptide bonds, they form the primary structure of proteins. The peptide bond is planar and rigid, giving proteins their distinctive 3D structures.
Совместная статья с проф. Коттоном про статистическое разупорядочение фрагментов в кластерных соединениях (первое соединение с разупорядочением и по катиону и по аниону)
The document describes the chemical structures of 16 organic compounds. The compounds include alkanes, alkenes, alkynes, and compounds containing halogens, alkyl groups, and functional groups such as dienes, diyne, and fluoro. The structures range from C8 to C16 in carbon chain length and contain varying numbers of double and triple bonds between carbons.
The document discusses nuclear magnetic resonance (NMR) spectroscopy and provides information about analyzing 1H NMR spectra. It explains that 1H NMR spectra can reveal the number of different types of hydrogens, their chemical environment, relative abundances, and neighboring hydrogen splitting patterns. Examples are given to show how these factors appear in 1H NMR spectra and how they can be used to determine structural information about organic molecules. The document contains over 20 examples of 1H NMR spectra and interpretations.
The document discusses elimination reactions, specifically E1 and β-elimination reactions. It explains that E1 reactions proceed through a two-step unimolecular mechanism, with the first step being rate-determining. Factors that affect E1 reactions include the stability of the carbocation intermediate, steric effects, and the ability of the base to stabilize the carbocation. Rearrangements can also occur through carbocation migration to form more stable products.
This document provides answers to a worksheet on organic chemistry nomenclature and structures. It lists the names of various organic compounds including butanoic acid, pent-1-ene, and methylpropanoate. It also gives the structural formulas for functional groups like alcohols, esters, carboxylic acids, and amines. Additionally, it provides the IUPAC names for substituted alkanes and alkenes, and draws the structure of a haloalkane, alcohol, alkene, and carboxylic acid to illustrate their functional groups.
A mass spectrum (MS) is a graphical representation of the relative abundance of ions at different mass-to-charge ratios (m/z) in a sample. Mass spectrometry is a powerful analytical technique used to identify and characterize the chemical composition of a wide range of substances, including organic compounds, proteins, peptides, and even small molecules. Here's how a typical mass spectrum is generated and what it can tell you:
Ionization: In mass spectrometry, the sample is first ionized, meaning that the atoms or molecules are converted into ions (charged particles). Common ionization methods include electron impact, electrospray ionization, and matrix-assisted laser desorption/ionization (MALDI).
Mass-to-Charge Ratio (m/z): After ionization, the ions are separated based on their mass-to-charge ratio (m/z). This ratio is a dimensionless quantity, and it represents the mass of the ion (in atomic mass units, amu) divided by its charge (in elementary charge units, e).
Ion Separation: The ions are separated by a mass analyzer, such as a magnetic sector, time-of-flight (TOF), quadrupole, or ion trap, depending on the specific instrument used. The mass analyzer sorts ions according to their m/z values.
Detector: As the ions exit the mass analyzer, they are detected, and their abundance is recorded. The detector measures the number of ions at each m/z value.
Data Output: The data from the detector is then used to create a mass spectrum. The x-axis of the mass spectrum represents m/z values, while the y-axis represents the relative abundance or intensity of ions at each m/z value.
A typical mass spectrum might have peaks at specific m/z values, and these peaks can provide valuable information about the sample:
Base Peak: The peak with the highest intensity in the spectrum is called the base peak. It represents the most abundant ion.
Molecular Ion Peak: The peak at the highest m/z value (farthest to the right) often represents the molecular ion, which can provide insight into the molecular weight of the compound.
Fragment Peaks: Peaks at lower m/z values are often fragment ions resulting from the breaking of chemical bonds within the original ions. These fragment ions can provide information about the structure of the compound.
Isotopic Peaks: Some elements have natural isotopes, and their presence can result in multiple peaks with slightly different m/z values. These isotopic peaks can also provide information about the composition of the sample.
Interpreting a mass spectrum involves analyzing the positions and intensities of these peaks to identify the compound and its structure. Mass spectrometry is widely used in various fields, including chemistry, biochemistry, environmental science, and forensic analysis, for tasks such as identifying unknown substances, quantifying the amounts of specific compounds, and studying chemical reactions.
Mass spectrometry is a technique used to identify molecules based on their mass. It works by ionizing chemical compounds to generate molecular or fragment ions and measuring their mass-to-charge ratios. The document discusses the basic principles and components of a mass spectrometer, including ionization, separation of ions based on mass, and detection. It also covers common fragmentation patterns observed for different classes of compounds like hydrocarbons, alcohols, aromatics, and others. General rules for fragmentation are provided along with examples to illustrate how structural information can be determined.
The document provides mechanisms for several reactions involving addition of reagents such as hydrogen chloride, hydrogen bromide, and osmium tetroxide to various alkenes and alkynes. It also provides structures of products expected from these reactions.
This document provides an overview of organic chemistry concepts including:
- Carbon's unique properties allow it to form many diverse organic compounds.
- Hydrocarbons are organic compounds made of carbon and hydrogen that exist as chains or rings.
- Functional groups are atoms or groups that confer unique reactivity, including alcohols, aldehydes, ketones, carboxylic acids, esters, amines, and amides.
- The three main types of organic reactions are addition, elimination, and substitution depending on changes in carbon bonding.
The document discusses stereochemistry and the different types of isomers. It provides examples of carvone isomers that have different smells due to their molecular shapes interacting differently with receptors. Geometrical isomers in alkenes can have groups on the same or opposite sides of the double bond. The E/Z system designates whether the highest priority groups are on the same (Z) or opposite (E) sides. Conformational isomers in ethane result from free rotation around the carbon-carbon bond, with the staggered conformation being more stable.
1. The document provides information on IUPAC nomenclature, including naming organic compounds from their structure and vice versa. Examples of names and structures are given.
2. Reaction mechanisms are discussed, including electrophilic substitution and addition reactions. Common mistakes by students in writing reaction equations are highlighted.
3. Details are given on writing balanced chemical equations, describing reaction conditions and observations, drawing reaction schemes, and defining types of reactions and isomerism. Examples of exam questions and common errors made by students are analyzed.
This document outlines the syllabus for an organic chemistry course. It covers topics such as naming organic compounds with 6 or fewer carbon atoms, nucleophilic substitution reactions, SN1 and SN2 reaction mechanisms and rates, elimination reactions, stereoisomerism including chiral centers, enantiomers, and properties of optical isomers such as their ability to rotate plane-polarized light. It provides study questions, examples to explain, and assignments to complete including drawing organic molecule structures and identifying optically active compounds.
The catalytic converter converts harmful exhaust gases like carbon monoxide into less harmful gases like carbon dioxide. It contains a ceramic monolith with narrow channels coated with precious metals. Chemical reactions that convert pollutants are highly temperature dependent. A mathematical model describes the catalytic converter using conservation equations to model the flow of gases and heat through the converter. The model equations track the concentrations of pollutants in the gas and temperatures of the solid and gas over time and distance along the converter.
The strong peak at 1739 cm-1 indicates the presence of a carbonyl group (C=O). The mass of an oxygen atom is 16. Therefore, the molecular weight of the corresponding hydrocarbon is 102 - 16 = 86. Using the rule of thirteen:
n = 86/13 = 6 (remainder 10)
m = 6 + 10 = 16
The molecular formula is C6H10O.
This document provides sample exercises and solutions for interpreting and balancing chemical equations. It discusses balancing equations by placing coefficients in front of reactants and products to make the number of each type of atom equal on both sides of the reaction arrow. It also covers writing and balancing equations for combination, decomposition, and combustion reactions.
The document discusses chemical reactions and equations. It provides information on:
- Writing balanced chemical equations to represent reactions
- Indications that a reaction occurred like heat/gas production
- Characteristics of chemical equations like conservation of mass
- Examples of balancing equations and writing equations for reactions
1. The document discusses the basics of organic chemistry including nomenclature of organic compounds, functional groups, molecular structure and bonding.
2. Key concepts covered include IUPAC naming rules, identifying primary, secondary and tertiary carbons, common functional groups, covalent and ionic bonding, and molecular orbital theory.
3. Bond polarity is discussed, noting that bonds between carbon and more electronegative atoms like oxygen are polarized with partial positive and negative charges.
This document discusses various types of organic reactions including:
1. Free radical substitution of alkanes
2. Electrophilic addition to alkenes
3. Nucleophilic substitution of haloalkanes and alcohols
4. Oxidation and elimination reactions of alcohols
It provides examples of mechanisms and reaction conditions for each type.
This document summarizes the key sections and processes at a national fertilizers plant. The main sections are the ammonia plant, urea plant, steam generation plant, and bagging plant. The ammonia plant uses a desulphurization section to remove H2S from natural gas feed. It then uses reforming and shift reactions to produce synthesis gas from the desulphurized feed. The synthesis gas is further processed in methanation and ammonia synthesis sections to produce ammonia. The ammonia is then recovered through distillation and used to produce urea in the urea plant.
1. Nuclear magnetic resonance (NMR) spectroscopy exploits the magnetic properties of atomic nuclei to study the physical, chemical, and biological properties of matter.
2. Key developments in NMR history include the first observations of NMR in solutions and solids in 1945, and the development of Fourier transform NMR and 2D NMR in the 1960s-1970s, which enabled the determination of protein structures by NMR.
3. NMR spectroscopy provides information about the number, type, and neighboring environment of nuclei in a molecule based on signals in the NMR spectrum.
[OReilly Superstream] Occupy the Space: A grassroots guide to engineering (an...Jason Yip
The typical problem in product engineering is not bad strategy, so much as “no strategy”. This leads to confusion, lack of motivation, and incoherent action. The next time you look for a strategy and find an empty space, instead of waiting for it to be filled, I will show you how to fill it in yourself. If you’re wrong, it forces a correction. If you’re right, it helps create focus. I’ll share how I’ve approached this in the past, both what works and lessons for what didn’t work so well.
Fueling AI with Great Data with Airbyte WebinarZilliz
This talk will focus on how to collect data from a variety of sources, leveraging this data for RAG and other GenAI use cases, and finally charting your course to productionalization.
Have you ever been confused by the myriad of choices offered by AWS for hosting a website or an API?
Lambda, Elastic Beanstalk, Lightsail, Amplify, S3 (and more!) can each host websites + APIs. But which one should we choose?
Which one is cheapest? Which one is fastest? Which one will scale to meet our needs?
Join me in this session as we dive into each AWS hosting service to determine which one is best for your scenario and explain why!
Introduction of Cybersecurity with OSS at Code Europe 2024Hiroshi SHIBATA
I develop the Ruby programming language, RubyGems, and Bundler, which are package managers for Ruby. Today, I will introduce how to enhance the security of your application using open-source software (OSS) examples from Ruby and RubyGems.
The first topic is CVE (Common Vulnerabilities and Exposures). I have published CVEs many times. But what exactly is a CVE? I'll provide a basic understanding of CVEs and explain how to detect and handle vulnerabilities in OSS.
Next, let's discuss package managers. Package managers play a critical role in the OSS ecosystem. I'll explain how to manage library dependencies in your application.
I'll share insights into how the Ruby and RubyGems core team works to keep our ecosystem safe. By the end of this talk, you'll have a better understanding of how to safeguard your code.
Connector Corner: Seamlessly power UiPath Apps, GenAI with prebuilt connectorsDianaGray10
Join us to learn how UiPath Apps can directly and easily interact with prebuilt connectors via Integration Service--including Salesforce, ServiceNow, Open GenAI, and more.
The best part is you can achieve this without building a custom workflow! Say goodbye to the hassle of using separate automations to call APIs. By seamlessly integrating within App Studio, you can now easily streamline your workflow, while gaining direct access to our Connector Catalog of popular applications.
We’ll discuss and demo the benefits of UiPath Apps and connectors including:
Creating a compelling user experience for any software, without the limitations of APIs.
Accelerating the app creation process, saving time and effort
Enjoying high-performance CRUD (create, read, update, delete) operations, for
seamless data management.
Speakers:
Russell Alfeche, Technology Leader, RPA at qBotic and UiPath MVP
Charlie Greenberg, host
Discover top-tier mobile app development services, offering innovative solutions for iOS and Android. Enhance your business with custom, user-friendly mobile applications.
For the full video of this presentation, please visit: https://www.edge-ai-vision.com/2024/06/temporal-event-neural-networks-a-more-efficient-alternative-to-the-transformer-a-presentation-from-brainchip/
Chris Jones, Director of Product Management at BrainChip , presents the “Temporal Event Neural Networks: A More Efficient Alternative to the Transformer” tutorial at the May 2024 Embedded Vision Summit.
The expansion of AI services necessitates enhanced computational capabilities on edge devices. Temporal Event Neural Networks (TENNs), developed by BrainChip, represent a novel and highly efficient state-space network. TENNs demonstrate exceptional proficiency in handling multi-dimensional streaming data, facilitating advancements in object detection, action recognition, speech enhancement and language model/sequence generation. Through the utilization of polynomial-based continuous convolutions, TENNs streamline models, expedite training processes and significantly diminish memory requirements, achieving notable reductions of up to 50x in parameters and 5,000x in energy consumption compared to prevailing methodologies like transformers.
Integration with BrainChip’s Akida neuromorphic hardware IP further enhances TENNs’ capabilities, enabling the realization of highly capable, portable and passively cooled edge devices. This presentation delves into the technical innovations underlying TENNs, presents real-world benchmarks, and elucidates how this cutting-edge approach is positioned to revolutionize edge AI across diverse applications.
The Microsoft 365 Migration Tutorial For Beginner.pptxoperationspcvita
This presentation will help you understand the power of Microsoft 365. However, we have mentioned every productivity app included in Office 365. Additionally, we have suggested the migration situation related to Office 365 and how we can help you.
You can also read: https://www.systoolsgroup.com/updates/office-365-tenant-to-tenant-migration-step-by-step-complete-guide/
"Frontline Battles with DDoS: Best practices and Lessons Learned", Igor IvaniukFwdays
At this talk we will discuss DDoS protection tools and best practices, discuss network architectures and what AWS has to offer. Also, we will look into one of the largest DDoS attacks on Ukrainian infrastructure that happened in February 2022. We'll see, what techniques helped to keep the web resources available for Ukrainians and how AWS improved DDoS protection for all customers based on Ukraine experience
Programming Foundation Models with DSPy - Meetup SlidesZilliz
Prompting language models is hard, while programming language models is easy. In this talk, I will discuss the state-of-the-art framework DSPy for programming foundation models with its powerful optimizers and runtime constraint system.
For the full video of this presentation, please visit: https://www.edge-ai-vision.com/2024/06/how-axelera-ai-uses-digital-compute-in-memory-to-deliver-fast-and-energy-efficient-computer-vision-a-presentation-from-axelera-ai/
Bram Verhoef, Head of Machine Learning at Axelera AI, presents the “How Axelera AI Uses Digital Compute-in-memory to Deliver Fast and Energy-efficient Computer Vision” tutorial at the May 2024 Embedded Vision Summit.
As artificial intelligence inference transitions from cloud environments to edge locations, computer vision applications achieve heightened responsiveness, reliability and privacy. This migration, however, introduces the challenge of operating within the stringent confines of resource constraints typical at the edge, including small form factors, low energy budgets and diminished memory and computational capacities. Axelera AI addresses these challenges through an innovative approach of performing digital computations within memory itself. This technique facilitates the realization of high-performance, energy-efficient and cost-effective computer vision capabilities at the thin and thick edge, extending the frontier of what is achievable with current technologies.
In this presentation, Verhoef unveils his company’s pioneering chip technology and demonstrates its capacity to deliver exceptional frames-per-second performance across a range of standard computer vision networks typical of applications in security, surveillance and the industrial sector. This shows that advanced computer vision can be accessible and efficient, even at the very edge of our technological ecosystem.
How to Interpret Trends in the Kalyan Rajdhani Mix Chart.pdfChart Kalyan
A Mix Chart displays historical data of numbers in a graphical or tabular form. The Kalyan Rajdhani Mix Chart specifically shows the results of a sequence of numbers over different periods.
Skybuffer SAM4U tool for SAP license adoptionTatiana Kojar
Manage and optimize your license adoption and consumption with SAM4U, an SAP free customer software asset management tool.
SAM4U, an SAP complimentary software asset management tool for customers, delivers a detailed and well-structured overview of license inventory and usage with a user-friendly interface. We offer a hosted, cost-effective, and performance-optimized SAM4U setup in the Skybuffer Cloud environment. You retain ownership of the system and data, while we manage the ABAP 7.58 infrastructure, ensuring fixed Total Cost of Ownership (TCO) and exceptional services through the SAP Fiori interface.
"Choosing proper type of scaling", Olena SyrotaFwdays
Imagine an IoT processing system that is already quite mature and production-ready and for which client coverage is growing and scaling and performance aspects are life and death questions. The system has Redis, MongoDB, and stream processing based on ksqldb. In this talk, firstly, we will analyze scaling approaches and then select the proper ones for our system.
Taking AI to the Next Level in Manufacturing.pdfssuserfac0301
Read Taking AI to the Next Level in Manufacturing to gain insights on AI adoption in the manufacturing industry, such as:
1. How quickly AI is being implemented in manufacturing.
2. Which barriers stand in the way of AI adoption.
3. How data quality and governance form the backbone of AI.
4. Organizational processes and structures that may inhibit effective AI adoption.
6. Ideas and approaches to help build your organization's AI strategy.
Driving Business Innovation: Latest Generative AI Advancements & Success StorySafe Software
Are you ready to revolutionize how you handle data? Join us for a webinar where we’ll bring you up to speed with the latest advancements in Generative AI technology and discover how leveraging FME with tools from giants like Google Gemini, Amazon, and Microsoft OpenAI can supercharge your workflow efficiency.
During the hour, we’ll take you through:
Guest Speaker Segment with Hannah Barrington: Dive into the world of dynamic real estate marketing with Hannah, the Marketing Manager at Workspace Group. Hear firsthand how their team generates engaging descriptions for thousands of office units by integrating diverse data sources—from PDF floorplans to web pages—using FME transformers, like OpenAIVisionConnector and AnthropicVisionConnector. This use case will show you how GenAI can streamline content creation for marketing across the board.
Ollama Use Case: Learn how Scenario Specialist Dmitri Bagh has utilized Ollama within FME to input data, create custom models, and enhance security protocols. This segment will include demos to illustrate the full capabilities of FME in AI-driven processes.
Custom AI Models: Discover how to leverage FME to build personalized AI models using your data. Whether it’s populating a model with local data for added security or integrating public AI tools, find out how FME facilitates a versatile and secure approach to AI.
We’ll wrap up with a live Q&A session where you can engage with our experts on your specific use cases, and learn more about optimizing your data workflows with AI.
This webinar is ideal for professionals seeking to harness the power of AI within their data management systems while ensuring high levels of customization and security. Whether you're a novice or an expert, gain actionable insights and strategies to elevate your data processes. Join us to see how FME and AI can revolutionize how you work with data!
Driving Business Innovation: Latest Generative AI Advancements & Success Story
Mto mechanisms submitted to jacs
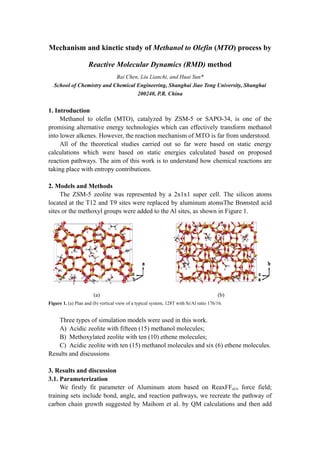
1. Mechanism and kinetic study of Methanol to Olefin (MTO) process by
Reactive Molecular Dynamics (RMD) method
Bai Chen, Liu Lianchi, and Huai Sun*
School of Chemistry and Chemical Engineering, Shanghai Jiao Tong University, Shanghai
200240, P.R. China
1. Introduction
Methanol to olefin (MTO), catalyzed by ZSM-5 or SAPO-34, is one of the
promising alternative energy technologies which can effectively transform methanol
into lower alkenes. However, the reaction mechanism of MTO is far from understood.
All of the theoretical studies carried out so far were based on static energy
calculations which were based on static energies calculated based on proposed
reaction pathways. The aim of this work is to understand how chemical reactions are
taking place with entropy contributions.
2. Models and Methods
The ZSM-5 zeolite was represented by a 2x1x1 super cell. The silicon atoms
located at the T12 and T9 sites were replaced by aluminum atomsThe Brønsted acid
sites or the methoxyl groups were added to the Al sites, as shown in Figure 1.
(a) (b)
Figure 1. (a) Plan and (b) vertical view of a typical system, 128T with Si/Al ratio 176/16.
Three types of simulation models were used in this work.
A) Acidic zeolite with fifteen (15) methanol molecules;
B) Methoxylated zeolite with ten (10) ethene molecules;
C) Acidic zeolite with ten (15) methanol molecules and six (6) ethene molecules.
Results and discussions
3. Results and discussion
3.1. Parameterization
We firstly fit parameter of Aluminum atom based on ReaxFFsi/o force field;
training sets include bond, angle, and reaction pathways, we recreate the pathway of
carbon chain growth suggested by Maihom et al. by QM calculations and then add
2. them in the training sets. (Figure 2 and Figure 3)
Figure 2. Comparisons of energy between ReaxFF and QM on the typical bonds and angle in zeolite system. (a)
Dissociation of the Al-O bond in Al(OH)3cluster; (b) energy of H2Al-O-H as a function of the Al-O-H valance
angle; (c) energy of Al(OH)3 as a function of the O-Al-O valance angle; (d) energy of H3SiO(H)AlH3 as a function
of the Si-O-Al valance angle.
(a)
3. (b)
(c)
Figure 3. Comparison of energy differences between FF and QM results of three reaction pathways in 3T model.
(a)First step of step-wise mechanism, decomposition of methanol and formation of surface methoxyl group;
(b)Second step of step-wise mechanism, carbon chain growth and formation of propene molecule; (c)Concerted
mechanism for formation of propene molecule, carbon chain growth while water molecule dissociated.
3.2. Simulations on Simplified Models
MD simulations were performed on Model A and Model B, several new
mechanisms were identified.
3.2.1 Model A (Methanol/Acidic zeolite)
Trajectory and mechanism analysis were performed on Model A:
4. Figure 4. Product distributions as a function of simulation time of model A (Methanol/Acidic zeolite), The high
temperature regions were removed.
CmHn,
Cm+1Hn+2(3)
H2O
CH3-Z
CH3OH
CH3OH - H-Z Z
H-Z H2O + Collision C2H5 C2H4 + H-Z
H-Z
Collision
CH3OH2 + Z CH3
-Z
CH3OH2
CmHn
Cm+1Hn+3
Z
CmHn - H-Z
H-Z
H2 + CmHn-3 CH4 + Z
Scheme 1. Mechanisms for activation of methanol molecules. Species in red color only observed during high
temperature regions.
The CH3 groups act as a reactive intermediate during conversion, which were
generated from collisions upon absorbed methanol molecules.
5. We identified detailed formation of CH3 groups and C2 species
(a) (b) (c)
Figure 5. Formation of free CH3OH2 groups by collision of a methanol molecule. (a) A methanol
absorbed on the acid cite was attacked by a free methanol molecule, (b) collision between the two
molecules, and (c) CH3OH2 group releases and a deprotonated cite formed.
I(a) I(b) I(c)
II(a) II(b) II(c)
Figure 6. Two pathways of formation of first C2 species in model A (only methanol as reactant).
I(a) A methanol absorbed on the acid cite was attacked by a free CH3, I(b) C-O bond of methanol
stretched, water molecule was formed, and I(c) C-C bond was formed, water molecule was
absorbed at the deprotonated site. II(a) A methanol absorbed on the acid cite was attacked by a
free CH3, II(b) C-C bond was formed and one C-H bond from methoxyl group was stretched, and
(c), a acid site was restored and a C2H5 species was produced.
3.2.2 Model B (Ethene/Methoxylated zeolite)
6. Figure 7. Product distributions as a function of simulation time of Ethene//Methoxylate zeolite system, the high
temperature regions were removed.
- H-Z
CH3CH2CH2 + Z CH3CHCH3 + Z
CH3-Z
C2H4 C2H4, CH3 C3H6
C2H4 - H-Z, CH3-Z, - Z
Z C2H4 Z
- H-Z, CH3-Z
C3H5 + H-Z
- H-Z, CmHn Z
Cm+2Hn+3 Cm+2H + H2 + H-Z
Scheme 2. Mechanisms for carbon chain growth start from ethene. Species with red color only exist in high
temperature regions.
In this model, we identified unprotonated Al center could play a role of catalysis
center, it can activate hydrocarbons in the system. Intramolecular hydrogen transfer
were observed, this may affect product distribution.
3.2.3 Comparison of initial reactions in models A and B
By comparing pre-exponential factors, activation energies, and effective collision
possibility, we found different from QM’s prediction, the actual rate-determining step
is the 2nd step which has lower activation energy – carbon chain growth,
7. Figure 8. Arrhenius extrapolation for pure ethene and pure methanol system, temperature range of 1500-1800K for
the Ethene/Methoxylate zeolite system and 1600-2000K for Methanol/Acidic zeolite system.
(a) (b)
Figure 7. Representation of collisions between reactants of both bad direction and good direction, (a) the first and
second pictures represent collisions between methanol molecule and H-Site in good or bad direction; (b) the third
and fourth pictures represent a collision between ethene molecule and CH3-Site in good or bad direction.
ESA ESA
ECP
TASA A TASA B
Where ESA is the effective molecule surface area, TASA is the total accessible
surface area.
The ECP values are 9.1% for methanol and Brønsted hydrogen, but only 1.8% for
ethene and methoxyl group.
8. 3.3 Model C (Methanol/Ethene/Acidic zeolite)
Figure 9. Product distributions as a function of simulation time of Complex system, numbers of species were
averaged in 15 simulations. The high temperature regions were removed.
15 parallel simulations were performed to gain statistic insights, the commonly
referred chain-growth mechanism, methoxyl + ethene mechanism, is observed as a
small contribution to the total production. Most ethene molecules are activated by
zeolite (unprotonated acidic sites) directly and the activated ethene molecules react
with other species in the system vigorously.
9. [5/5]
- H-Z,
CH3-Z, - Z C3H6
CH3CHCH3+Z [6/62]
C3H5
- H-Z, CH3-Z
[3/62]
[5/5]
C2H4 Z CmHn,
- H-Z
CH3CH2CH2+Z
[16/62] [36/62]
- H-Z,
[62/67] H2O
Z
[5/67] C2H3-OH2
Cm+2Hn+3
CH3-Z
Z C2H4O
[10/16]
C2H4 H-Z
2 4 H-Z CH3OH
C2H4 + H-Z
CH3OH2-Z
Z, [6/6]
(Chain growth…) H2O
- H-Z
[27/210] Collision
[183/210]
[165/186]
C2H5 + H-Z CH3-Z CH3OH2 + Z
Z
[27/27]
[3/27] -Z
CH3-Z
[6/27]
CH3
H2O
CmHn H-Z,
-Z
[9/27]
[9/27]
Cm+1Hn+3 CH4
Scheme 3. Mechanisms collection from Complex model, numbers in parenthesis indicate times reactions occurred
in 15 parallel Complex system simulations. Species with red color only exist in high temperature region. Blue
arrows indicate reactions only occured in simplified models.
The catalysis of unprotonated center was validated by QM calculations:
10. 1.24
1.35
10
Energy (kcal/mol)
5
TS C2H3 + H-Z
C2H4 + Z
0
-5 C2H4…Z
C2H3…H-Z
-10
Figure 10. QM validation of hydrogen transfer process from ethene to deprotonated site, 3T
cluster at B3LYP/6-31g(d,p) level, open shell.
4. Conclusions
The main novel contributions are:
1) Augmented ReaxFF for simulation of catalytic reactions in acidic zeolite.
2) Using three simulation models and programmed data analysis techniques,
complete reaction networks of MTO process are obtained, new reaction
mechanisms or conclusions are proposed.
3) By considering the entropy contributions, the rate-determining step for MTO is
not the activation of methanol, as suggested by static QM calculations, but the
C-C chain formation and growth.
4) New observed mechanisms were identified and made comparison with
experiment.