The Monster Employment Index is a monthly gauge of U.S. online job demand based on a real-time review of
millions of employer job opportunities culled from a large representative selection of corporate career Web sites
and job boards, including Monster.com®.
U.S. employment showed a healthy return to growth in February with 242,000 net new jobs. Unemployment remained at 4.9 percent, but total unemployment dropped to just 9.7 percent—the lowest rate since before the recession.
U.S. employment rate data and trends: March 2014JLL
The U.S. economy added 192,000 jobs in March, a reversal from three months of slowing growth. Unemployment remained stable at 6.7 percent, but improved confidence increased the number of people looking for work. Total unemployment remains above historic norms at 12.7 percent, but 95 percent of jobs have been recovered since the recession. Positive signs include March growth being evenly distributed across industries and spreading more geographically. We expect continued positive momentum throughout 2014.
See details on the data, including demographic, geographic and industry breakdowns, in this report featuring research from the Bureau of Labor Statistics and JLL.
U.S. employment update and outlook: December 2014JLL
November gain of 321,000 jobs confirms the strength of the recovery
The U.S. economy saw the growth of an additional 321,000 net new jobs in November. With revisions of earlier months' data, makes November the ninth consecutive month with gains surpassing 200,000 jobs.
Unemployment remained steady from the previous month at 5.8 percent. Total unemployment—which includes detached workers—dropped by 10 basis points to a recovery low of 11.4 percent, as the number of marginally detached workers slowly declines.
See more economic, office and real estate research at http://bit.ly/1s2tk4M
Saratoga County Manufacturing Economic Index 4.17.19JenniferKelley47
Takeaways from the Saratoga County Manufacturing Index include:
• Manufacturing is the fourth-largest private-sector employer in Saratoga County, representing 11 percent of total employment.
• The semiconductor industry (2,599 jobs) is the leading manufacturing employer, followed by chemicals (1,278), printing (890), paper (518) and fabricated metals (501)
• Nearly half of manufacturing jobs in Saratoga County – 3,678 – are directly supported by exports
• Statewide, the biggest exported NY products by percentage are miscellaneous manufactured commodities (39), followed by semiconductor (12), primary metals (9) and chemicals (9)
• Statewide, the leading foreign countries that receive exported NY products by percentage are Canada (14), Hong Kong (12), Israel (8), the United Kingdom (7) and Switzerland (7)
U.S. employment update and outlook: November 2014JLL
October records another month of 200,000+ job gains
The U.S. economy saw the addition of 214,000 net new jobs in October. With revisions of earlier months’ data, this makes October the eighth consecutive month with gains surpassing 200,000 jobs.
This steady expansion has helped to push down unemployment, which fell by 10 basis points to 5.8 percent. Total unemployment—which includes detached workers—dropped by 30 basis points to a recovery low of 11.5 percent, also below the long-term average.
See more economic, office and real estate research at http://bit.ly/1wCNyXQ
December 2015 U.S. employment update and outlookJLL
Employers added 211,000 net new jobs in November, but the unemployment rate remained at 5 percent. The Federal Reserve's anticipated interest rate hike is now very likely.
September 2016 U.S. employment update and outlookJLL
Despite employment growth in August falling below expectations, the overall U.S. unemployment rate held steady at 4.9 percent as growth in the workforce aligned with employment gains.
February 2016 U.S. employment update and outlook JLL
The labor market recorded a soft opening to 2016, adding only 151,000 new jobs, although unemployment fell below 5.0 percent for the first time since 2008.
The national economy has finally gained back all jobs lost during recession, 79 months after the recession began. Not only are we back to the pre-recession employment peak—we’re 98,000 jobs above it.
The 217,000 new jobs created in May represent the fourth consecutive month of more than 200,000 payroll additions, the first time that this has happened during the recovery of late. Unemployment held steady at 6.3 percent, as did the labor force participation rate at its low of 62.8 percent.
See details on the data, including demographic, geographic and industry breakdowns, in this report featuring research from the Bureau of Labor Statistics and JLL.
U.S. employment update and outlook: October 2014JLL
Unemployment dips to 5.9 percent in September—its first time below 6.0 percent during the recovery.
The U.S. economy got back on track in September, bouncing back from a sluggish August with 248,000 net new jobs. Growth occurred across sectors and geographies, with office-using industries in particular benefiting from improved corporate confidence leading to permanent hiring.
Total unemployment, which includes discouraged and marginally detached workers, also declined slightly to 11.8 percent, bringing it below the 10-year average.
With numerous other employment metrics all pointing up—including job openings, voluntary quits and CEO confidence—sentiment will only become more optimistic over the coming months.
See more real estate and economic research at: http://bit.ly/1vIGt6m
The Federal Government has spent almost $32 billion on cybersecurity-related expenditures in the past 10 years. More importantly, the cyber spending boom shows no sign of slowing, as spending increased 281 percent from 2006 to 2014 (an average of 22 percent annually). This historic growth in cyber spending runs counter to the greater trend in Federal Government spending that has led to a relatively modest increase of 4.2 percent annually over the same time period.
As the world becomes increasingly digitized, so has the Federal Government, but individual agencies are not spending on cybersecurity in similar ways. Each agency's funding over the past 10 years tells a unique story.
May saw the addition of only 138,000 net new jobs, while gains in previous months saw downward revisions. Minimal improvement in retail trade combined with contractions in government and information kept increases down, although professional services, education, health and leisure remained stable.
Learn all about the economic outlook from Sage Policy Group, Inc.'s presentation for Citrin Cooperman's October 19 event, Economic Summit: Planning Your Business for Tomorrow's Economy.
With the economy growing at its fastest pace in the current cycle, employers across industries are adding jobs, especially in urban and dense markets where talent is migrating. As a result, expansionary activity remained the dominant driver of leasing in the third quarter, accounting for 57.9 percent of lease transactions.
We at Alps Venture Partners are constantly contributing towards research in Mergers & Acquisitions across geographies.
This is first in series of 2020-21 M&A Tearsheet which provides detail on the Transaction Multiples (Revenue & EBITDA), Multiples Chart, Active Buyers, Country based multiples & other transaction data observed in South East Asia.
April’s 211,000 net new jobs were a return to the more robust growth rates seen over the past two years, although March figures were revised down once again to 79,000 jobs. Unemployment fell by 10 basis points to another cyclical low of 4.4 percent in April.
April 2011 Index Highlights:
• Annual growth rate at 9 percent in April, marking the 15th consecutive month of year-over year growth
• Index climbs 7 percent (9 points) month-over-month
• 27 of the 28 metro markets showed positive annual growth in April
• Mining, quarrying, oil and gas extraction continues to lead the Index on an annual basis;
manufacturing reaches highest levels of demand since late 2008, driving growth in
manufacturing hubs such as Detroit and Cleveland
The Monster Employment Index is a monthly gauge of U.S. online job demand based on a realtime review of millions of employer job opportunities culled from a large representative selection of career Web sites and online job listings.
The Index does not reflect the trend of any one advertiser or source, but is an aggregate measure of the change in job listings across the industry.
The Chicago Job Conditions Report offers insights and analysis from Chicago recruiters, hiring managers and job seekers. This study focuses on both Chicago professionals and recruiters looking to hire Chicago talent.
Gain insight on online recruitment trends, supply and demand conditions, and how job seeker characteristics mesh against employer needs. Plus, see what Chicago professionals reveal about their careers, job search obstacles, and most valued skills and qualifications.
This report provides:
* An overall look at the Chicago supply and demand, together with a comparison of job seeker characteristics and employer requirements
* A look at recruiters and hiring managers and their plans for acquiring Chicago talent in 2011
* Insight on Chicago professionals and their careers, job search obstacles and valued qualifications and skills
The Myths and Power of Social in Acquiring the Best TalentMonster
“Social” is bringing new opportunities and challenges to all parts of business, and human resources and recruiting are no exception. In this deck, we explore six new realities surrounding “social” recruiting and strategies you can employ to help you succeed in today’s social world. We’ll separate the myths from reality and share emerging practices on how social tools and tactics fit into an overall recruiting strategy.
You will learn:
Why “social” matters and how it’s changing business, HR and the recruiting landscape
How to think about bringing social into your recruiting processes in ways that are relevant to your industry and company culture (it’s not a one size fits all world!)
Where to learn more, get the support you need to be successful.
The Seattle Job Conditions Report offers a comprehensive view of the Seattle job market. This study highlights online job postings and candidate resume activity across Seattle and focuses on Seattle professionals and recruiters looking to hire Seattle talent.
Gain insight on online recruitment trends, supply and demand conditions, and how job seeker characteristics mesh against employer needs. Plus, see what Seattle professionals reveal about their careers in Seattle, job search obstacles, and most valued skills and qualifications.
This report provides:
* An overall look at Seattle supply and demand, together with a comparison of job seeker characteristics and employer requirements
* A look at recruiters and hiring managers and their plans for acquiring Seattle talent in 2011
* Insight on Seattle professionals and their careers, job search obstacles and valued qualifications and skills
The Biotechnology Job Conditions Report offers a comprehensive view of the Biotechnology job market. This study highlights online job postings and candidate resume activity across the United States and focuses on Biotechnology professionals and recruiters looking to hire Biotechnology talent.
Gain insight on online recruitment trends, supply and demand conditions, and how job seeker characteristics mesh against employer needs. Plus, see what Biotechnology professionals reveal about their careers in Biotechnology, job search obstacles, and most valued skills and qualifications.
This report provides:
* An overall look at Biotechnology supply and demand, together with a comparison of job seeker characteristics and employer requirements
* A look at recruiters and hiring managers and their plans for acquiring Biotechnology talent in 2011
* Insight on Biotechnology professionals and their careers, job search obstacles and valued qualifications and skills
Developing Talent To Increase Business PerformanceMonster
TALENT is the engine of business growth and long-term competitiveness. When the right capabilities are built and leveraged within an organization, results follow. Savvy managers know how to build the capabilities needed to perform today and deliver talent results needed for tomorrow’s business needs.
Talent needs to KNOW what to do, be able to do (CAN do), and WANT to do to in order to achieve organization results.
This Slideshare contains information on:
- How to build talent (the CAN do)
- How to Engage talent (the WANT to do)
- How to deliver an increase in their organization’s business performance
How to Groom Your Millennial Employees to Be Effective Young LeadersMonster
Due to demographic trends, many companies have to move Millennials into leadership roles sooner than generations before them did. But are your younger employees prepared to assume these roles and responsibilities? In this info-packed webinar, Lisa will provide tips and insights to help you begin fostering a leadership mindset within your Millennial talent (even an entry-level manager position is a leadership role!). And smart companies know the future of their success is based on grooming their Millennial employees sooner, rather than later, for leadership.
The tips and insights shared are things that both bosses and Millennials will benefit from!
Navigation Employment Trends: A Monster Intelligence briefingMonster
At the 2015 Monster Customer Summit — held Oct. 7-10 in Boston, Massachusetts — Joanie Courtney, senior vice president of Global Market Insights at Monster, outlined how the industry has gotten to this point, and which trends to keep an eye on as we move toward the future of recruitment.
With so many trends to watch, these are the few you should have your eyes on over the next few months.
Your cover letter is the first thing employers see when they open your materials. Avoid these 10 mistakes, and make your first impression a good and lasting one.
The Current State Of Company Loyalty and Employee EngagementMonster
In the wake of the global economic downturn, more than a quarter of employees worldwide say that the recession has made them more loyal to their employer. Organizations with positive management, strong morale and active communications have succeeded in making their workforce more engaged in spite of the uncertainty caused by falling profits and layoffs. Using Kelly’s Global Workforce Index as a backdrop for the conversation, this webinar focuses on why company loyalty and employee engagement should be top priority for every organization.
At the conclusion of this presentation, you will understand:
* How the “War for Talent” is affecting employee loyalty and engagement
* Current company loyalty and employee engagement ratings by region (North America, Europe, Asia Pacific)
* The difference between engagement and satisfaction, and why it is so important to have truly engaged employees
* What you can do to foster engagement in your organization
Analysis of recent transactions in South East Asia across four major Industries detailing on Transaction Multiples (Revenue & EBITDA), Multiples Chart, Active Buyers & Transaction Data.
eThekwini State of the Economy - Presentation to the S.D.B LED StakeholderMarketing Durban Chamber
On Tuesday, 14 April the Durban Chamber's Southern Area Business Meeting held a forum discussion, where they hosted Vuyo Jayiya. Vuyo discussed, "Doing business in the south region".
The presentation covered:
• South economic contribution to eThekwini and country
• Economic profile of existing industry
• Constraints and Opportunities to doing business in South
India is the world's fourth agricultural power in the world.
Agriculture contributes to about 20% of the GNP and employs close to two- thirds of the active population in India.
The main agricultural products are: wheat, millet, rice, corn, sugar cane, tea, potatoes and cotton.
India is also the second producer of cattle, third producer of sheep and fourth in fishing production.
Coal is the country's main energy source
(India is the third largest world producer of coal).
MSME Sector - Growth, Challenges & Opportunities Resurgent India
The MSME sector contributes in a significant way to the growth of the Indian economy across the realms of production system, employment generation, national output, exports etc. The MSME Sector comprises of approximately 48 million units that produce more than 6,000 products ranging from traditional to high-tech items. The sector is driving sustainable growth in Indian economy by providing employment to around 111 million people, accounts for 45% of the manufacturing output, 40% of the country's exports and contributes 8-9% to the country's GDP.
The structured analysis of MEtS was executed by India’s leading economic research firm Indicus Analytics
Driven by India’s economic turnaround post downturn, hiring in the organized sector is set to pick up at a greater pace in the second quarter reveals the first quarter results of the Ma Foi Randstad Employment Trends Survey.
The findings of the study for the period of January – March 2010 was released by Mr. K. Pandia Rajan, CEO, Ma Foi Randstad (India & Sri Lanka).
Ma Foi Randstad is the leading integrated HR services provider in the country and has been conducting the employment trends survey since 2004. This study is India’s largest job market study.
In March 2010, Ma Foi Randstad predicted creation of 1 million jobs in the year 2010.The latest projection for the period of April to June (Q2) and estimates of actual job creation in January to March 2010 (Q1) for the organized sector was arrived at, after surveying the employment trends in 650 companies across 13 industry sectors in eight major cities - Ahmedabad, Bangalore, Chennai, Delhi, Hyderabad, Kolkata, Mumbai and Pune. These companies were queried about (a) hiring in the first 3 months of the year and (b) hiring intentions over the next 3 months.
The study reveals creation of 1,53,564 jobs during Jan - March 2010 and 3,47,463 jobs are getting created in the period of April – June 2010.
Sector-wise Employment Trends:
According to the survey, the employment trend across all sectors – BFSI, IT & ITES, Pharma, Healthcare, Trade including Consumer, Retail & Services, Energy, Transport, Storage & Communication, Real Estate & Construction, Hospitality, Media & Entertainment, Non-Machinery Manufacturing, Manufacturing of Machineries & Equipments, Education, Training & Consultancy are on the same card in the first quarter and are expected to continue at a faster pace in the second quarter.
The recovery from economic crisis has further strengthened the momentum of the Healthcare sector which has reported the greatest employment generation of 52,752 new jobs in Q1, followed by Hospitality with 21,500 in the same period. Education, Training & Consultancy sector added 16, 200 new jobs in Q1.
Projection for Q2 is that healthcare sectcor again will add the largest number of new jobs – 96248. Real estate and construction sector is estimated to add 52115, the 2nd highest job creator in the economy. This will be closely followed by Hospitality sector that is estimated to create 49000 jobs. IT and ITES sectcor is estimated to add 34000 new jobs; Media and entertainment sector to add 28700 jobs; Education, Training and Consultancy to add 23200 jobs. Non-machinery Manufacturing (17,300), BFSI (15,800), Transport, Storage and Communication (8,800), Pharma (6100), Energy (5,900), Manufacture of machinery and equipment (5300) and Trade including consumer, retail and services (5,000) are expected to pick up hiring momentum in Q2 of the year.
There is a significant increase of hiring intentions in Q2 vis-à-vis Q1 for sectors of Real Estate and Construction, Media and Entertainment and Healthcare.
City-wise Employment Trends:
Delhi & NCR is expected to add 38, 350 jobs (added 17650 in Q1 and likely to add 20700 in Q2) by June 2010. The expectation of better performance across sectors has increased optimism among companies, resulting in increase in hiring intent. Mumbai is expected to add 27, 650 jobs (12750 in Q1 and 14900 in Q2) and Chennai is expected to add 11,900 jobs (5600 in Q1 and 6300 in Q2) by June 2010. Following these top three cities are Kolkatta – 8350 jobs, Bangalore – 6800 jobs, Hyderabad – 6200 jobs, Pune – 5400 jobs and Ahmedabad – 3260 jobs.
Sector-wise Fresher/
Similar to Monster Employment Index - January 2011 (20)
Why Candidate Experience Will Make or Break More Than Just HiringMonster
Monster Vice President Eric Winegardner and Chris Hoyt delivered this presentation on the candidate experience during the 2015 Monster Recruitment Summit, held in Boston on Oct. 7-10.
Social Recruiting Strategies Conference presentation — Jan. 28, 2015Monster
Slides presented by Monster Vice President for Product and Technology Joe Budzienski and ManpowerGroup Digital Marketing Lead Michail Takach at the Social Recruiting Strategies Conference in San Francisco, California on January 28, 2015.
In honor of Veterans Day on November 11, we have gathered some of our favorite quotes on the honor and leadership of men who serve their countries, said by great leaders throughout history.
#MWchat Part Two: How to Achieve Work-Life BalanceMonster
Career experts Charles Purdy, Cali Williams-Yost and Maggie Mistal share their best tips for finding a job that will allow you to achieve a healthy work-life balance.
For more career tips, visit the Monster Facebook page at http://mnstr.me/GT7hds or follow @MonsterCareers and the #MWChat hashtag on Twitter.
2012 Atlanta Job Market Report - Monster.comMonster
The Atlanta Job Conditions Report offers a comprehensive view of the Atlanta job market. This study highlights online job postings and candidate resume activity across Atlanta and focuses on Atlanta professionals and recruiters looking to hire Atlanta talent.
Gain insight on online recruitment trends, supply and demand conditions, and how job seeker characteristics mesh against employer needs.
This report provides:
An overall look at market conditions including unemployment shifts, payroll changes and online recruitment trends in the Atlanta area
A profile of Atlanta talent that includes insight into the types of candidates that are currently in supply
An analysis of Atlanta supply and demand, together with a comparison of job seeker characteristics and employer requirements
The Education Job Candidate Report offers a concise view of the Education job market. This study highlights current employment trends and candidate activity across the United States and focuses on Education professionals and recruiters looking to hire Education talent.
This report provides:
An overall look at Education market conditions and employment forecasts
A look at demographics and locations of Education talent across the United States
Insight on Education professionals and their evaluation of job opportunities
The Legal Job Candidate Report offers a concise view of the Legal job market. This study highlights current employment trends and candidate activity across the United States and focuses on Legal professionals and recruiters looking to hire Legal talent.
This report provides:
An overall look at Legal market conditions and employment forecasts
A look at demographics and locations of Legal talent across the United States
Do you know what benefit Millennial employees want 3 TIMES MORE than cash bonuses?
Millennials, or the Gen Y workforce born between 1982 and 2002, are success-oriented but can be very high maintenance. They don’t adapt to corporate cultures. Your company must be “Millennial-friendly” or risk a high turnover rate with this not-so-tolerant generation.
With mass Boomer retirement starting, and the smaller number of Gen X workers replacing them, smart employers are currently scrambling to determine not only how to recruit their next generation of young employees, but how to retain the Millennials they have now.
Join us as Lisa Orrell, author of 2 best-selling books, Millennials Incorporated and Millennials into Leadership, explains the eight critical retention requirements Millennials seek from an employer. Lisa’s insight is backed by recent research into the Millennial generation and her years of experience working with multi-generations in organizations large and small.
In this presentation you will learn:
What makes the Millennial worker tick?
Where do you find and recruit this next generation worker?
How can you motivate, inspire and retain your Millennial workers?
Learn how your company can keep its best & brightest future leaders.
For more on recruiting and retaining Gen Y workers, visit
http://www.monsterthinking.com
The Impact of Stress on Your Business Bottom Line (Part 2)Monster
Stress. We all feel it. In today’s over-scheduled workday, stress sneaks up on us and then delivers a one two punch to our productivity and job performance.
In this two-part series, Dr. Daniel Crosby, President of IncBlot, helps you better understand how stress impacts job performance and what you can do about it.
Part II:
We discuss ways to manage stress in the workplace
We define proven strategies to help your workforce tame stress that detracts from their performance while leveraging stress that spurs growth.
We uncover some common behaviors people use to deal with stress and discuss which ones really work.
These presentations help define stress and build stress management plans that best fits your business culture so you can reduce the negative impact of stress in your company.
SeeMore is the industry's first semantic search and analytics platform for talent. Built on Monster's highly successful 6Sense® semantic search technology, SeeMore provides you with intelligence and visibility into multiple talent pools and helps managers and recruiters efficiently identify, access and manage their talent, regardless of source.
2011 Sales Job Candidate Career Outlook - Monster.comMonster
The Sales Job Candidate Report offers a concise view of the Sales job market. This study highlights current employment trends and candidate activity across the United States and focuses on Sales professionals and recruiters looking to hire Sales talent.
This report provides:
An overall look at Sales market conditions and employment forecasts
A look at demographics and locations of Sales talent across the United States
Insight on Sales professionals and their evaluation of job opportunities
The Columbus Job Conditions Report offers a comprehensive view of the Columbus job market. This study highlights online job postings and candidate resume activity across Columbus and focuses on Columbus professionals and recruiters looking to hire Columbus talent.
Gain insight on online recruitment trends, supply and demand conditions, and how job seeker characteristics mesh against employer needs. Plus, see what Columbus professionals reveal about their careers in Columbus, job search obstacles, and most valued qualifications.
This report provides:
An overall look at Columbus supply and demand, together with a comparison of job seeker characteristics and employer requirements
A look at recruiters and hiring managers and their plans for acquiring Columbus talent in 2011
Insight on Columbus professionals and their careers, job search obstacles and valued qualifications.
Career Sites, Recruiting Strategy & The Candidate ExperienceMonster
A significant component of a company’s recruitment strategy is a corporate website. This website showcases your company, your culture and your recruitment brand. Great Candidates who are carefully managing their careers are visiting your website and making assumptions about your organization based on what they find. Unfortunately, many websites are not designed with the Candidate experience in mind and fail to engage the right talent.
This presentation illustrates how leading edge organizations are developing sites that are intuitive, experiential and most importantly help filter the right Candidates in and the wrong Candidates out.
When do you consider your employee survey to be complete?
Once all of your employees have taken the survey
Once your organization has received the data
After you’ve shared a couple of reports with senior management
Find out why employee surveys should be an ongoing process, where the actions taken post-survey are even more important than the survey itself. Ignoring post-survey steps can be more detrimental to Employee Engagement and Satisfaction than not conducting the survey in the first place. In this presentation, we discuss essential post-survey steps, the importance of creating an ongoing survey process, why Engagement matters, and how to create a culture of Engagement.
Monster Employment Index - Europe (July 2011)Monster
European Online Recruitment Grows 21% Year-over-Year, Reports Monster Employment Index Europe
July 2011 Index Highlights:
• The Monster Employment Index Europe demonstrates 21 percent annual growth in July
• Industrial production and related sectors complete a sixth consecutive month at the top with the strongest growth of all industries
• Telecommunication remains a strong performer in July, moving to fourth position by measure of annual growth in the Index
• Public sector and the arts remain in annual decline although the arts experiences a slight easing on its rate of decline
• Growth takes place across all EU countries monitored by the Index in July, with Germany continuing to lead with 36 percent
The good news: With the worst of the recession behind us, companies are once again hiring.
The bad news: Many talented workers are now looking for growth opportunities and are ready to leave their current employer.
What will you do to retain your best talent?
Whether you are a small business or a large enterprise organization, you need to identify strategies to help minimize a post-recession talent exodus in your company. Check out this presentation and learn how worker loyalty differs by company size and explore ways to increase worker loyalty in your company. We will emphasize strategies that can be used by small businesses to help them better manage their workforce during this period of economic transition.
You will learn ways to:
Address any misalignment in compensation
Target the “right” hire
Communicate a strong employer brand
Continually fill a pipeline of prospects
Strive to keep your “A” workers
The Engineering Job Conditions Report offers a comprehensive view of the Engineering job market. This study highlights online job postings and candidate resume activity across the United States and focuses on Engineering professionals and recruiters looking to hire Engineering talent.
Gain insight on online recruitment trends, supply and demand conditions, and how job seeker characteristics mesh against employer needs. Plus, see what Engineering professionals reveal about their careers in Engineering, job search obstacles, and most valued skills and qualifications.
This report provides:
A look at recruiters and hiring managers and their plans for acquiring Engineering talent in 2011
Insight on Engineering professionals and their careers, job search obstacles and valued qualifications and skills
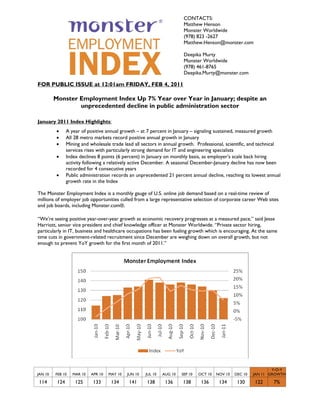
1. CONTACTS:
Matthew Henson
Monster Worldwide
(978) 823 -2627
Matthew.Henson@monster.com
Deepika Murty
Monster Worldwide
(978) 461-8765
Deepika.Murty@monster.com
FOR PUBLIC ISSUE at 12:01am FRIDAY, FEB 4, 2011
Monster Employment Index Up 7% Year over Year in January; despite an
unprecedented decline in public administration sector
January 2011 Index Highlights:
• A year of positive annual growth – at 7 percent in January – signaling sustained, measured growth
• All 28 metro markets record positive annual growth in January
• Mining and wholesale trade lead all sectors in annual growth. Professional, scientific, and technical
services rises with particularly strong demand for IT and engineering specialists
• Index declines 8 points (6 percent) in January on monthly basis, as employer’s scale back hiring
activity following a relatively active December. A seasonal December-January decline has now been
recorded for 4 consecutive years
• Public administration records an unprecedented 21 percent annual decline, reaching its lowest annual
growth rate in the Index
The Monster Employment Index is a monthly gauge of U.S. online job demand based on a real-time review of
millions of employer job opportunities culled from a large representative selection of corporate career Web sites
and job boards, including Monster.com®.
“We’re seeing positive year-over-year growth as economic recovery progresses at a measured pace,” said Jesse
Harriott, senior vice president and chief knowledge officer at Monster Worldwide. “Private sector hiring,
particularly in IT, business and healthcare occupations has been fueling growth which is encouraging. At the same
time cuts in government-related recruitment since December are weighing down on overall growth, but not
enough to prevent YoY growth for the first month of 2011.”
Y-O-Y
JAN 10 FEB 10 MAR 10 APR 10 MAY 10 JUN 10 JUL 10 AUG 10 SEP 10 OCT 10 NOV 10 DEC 10 JAN 11 GROWTH
114 124 125 133 134 141 138 136 138 136 134 130 122 7%
2. Page 2 of 8
Industry Year-over-year Trends: 12 of the 20 industries monitored by the Index showed positive annual
growth trends.
• Wholesale Trade (up 14 percent) was amongst the top-moving sectors in January, in contrast to seasonal
expectations, as sector employers appeared to carry- over their year-end momentum into 2011
• Professional, scientific, and technical services (up 14 percent) remained strong year-over-year, and
stable month-over-month due to particularly strong demand for IT and engineering specialists
• Accommodation and food services (down 16 percent) was amongst the slowest growing sectors in the
Index following a relatively active month of online hiring activity in December
• Finance and insurance (up 2 percent) remained flat from December on an annual basis, yet demand trends
for workers in a number of financial service occupations remained high
• Public administration (down 21 percent) registered the steepest annual decline, with eased job creation for
federal and local government
Top Growth Industries Lowest Growth Industries
Jan Jan % Growth Jan Jan % Growth
Year-over-year Growth 10 11 Y-o-y Year-over-year Growth 10 11 Y-o-y
Mining, Quarrying, Oil and Gas
139 211 52% Educational Services 82 77 -6%
Extraction
Transportation and Warehousing 125 143 14% Real Estate and Rental and Leasing 51 47 -8%
Agriculture, Forestry, Fishing, and
Wholesale Trade 121 138 14% 203 177 -13%
Hunting
Professional, Scientific, and
49 56 14% Accommodation and Food Services 94 79 -16%
Technical Services
Information 68 76 10% Public Administration 180 142 -21%
Occupation Year-over-year Trends: Annual online demand for workers rose in 15 of the 23 occupational categories in
January.
• Architecture and Engineering (up 16 percent) and Computer and mathematical (up 14 percent) registered
improved demand trends with a general escalation in job availability for professionals with advanced technical
specializations
• Business and financial operations (up 15 percent) saw improved demand conditions for accountants and
financial analysts across a wide range of sectors, across all geographic regions
Top Growth Occupations Lowest Growth Occupations
Jan Jan % Growth Jan Jan % Growth
Year-over-year Growth 10 11 Y-o-y Year-over-year Growth 10 11 Y-o-y
Installation, Maintenance, and
116 138 19% Education, Training and Library 118 108 -8%
Repair
Arts, Design, Entertainment,
75 89 19% Military Specific 156 137 -12%
Sports and Media
Architecture and Engineering 75 87 16% Food Preparation and Serving 96 79 -18%
Business and Financial Operations 122 140 15% Farming, Fishing, and Forestry 200 162 -19%
Computer and Mathematical 86 98 14% Protective Service 84 55 -35%
2
3. Page 3 of 8
Geographic year-over-year Trends: All 28 metro markets recorded positive annual growth in January
• Detroit (up 51 percent) and Philadelphia (up 39 percent) continued to remain among top growth
markets.
• San Diego (up 8 percent) remained stable year-over-year but recorded a mild monthly decline of 3
percent in January. Online recruitment trends were strongest for production; sales; and arts, design,
entertainment, sports, and media related occupations in the long-term
• Among the 50 states and the District, 40 registered annual increases in online job demand.
Top Growth Metro Markets Lowest Growth Metro Markets
Jan Jan % Growth Jan Jan % Growth
Year-over-year Growth 10 11 Y-o-y Year-over-year Growth 10 11 Y-o-y
Detroit 57 86 51% Phoenix 60 66 10%
Philadelphia 36 50 39% Houston 97 106 9%
Minneapolis 68 89 31% San Diego 60 65 8%
Chicago 55 71 29% Washington, D.C. 38 41 8%
Orlando 36 46 28% Baltimore 38 40 5%
International Trends:
• Monster Employment Index Europe continued a steady positive annual growth rate (up 22 percent
in December) ending the year with relatively strengthened demand for production; manufacturing and
transportation/ logistics sectors. Germany continued to be the strongest overall creator of job
opportunities in Europe
• Monster Employment Index India annual growth rate accelerated to 27 percent in December 2010,
with demand picking notably for the IT sector. Several other categories including banking/ finance and
engineering continued to exhibit strong long-term growth
To obtain a full copy of the Monster Employment Index report for January 2011, and to access current individual
data charts for each of the 28 metro markets tracked, please visit http://about-monster.com/employment-index.
Data for the month of February 2011 will be released on March 3, 2011.
3
7. Page 7 of 8
By Region
2010 2011
Jan Feb Mar Apr May Jun Jul Aug Sep Oct Nov Dec Jan
New England 103 112 112 124 124 130 126 122 125 123 123 117 110
Mid-Atlantic 105 114 117 130 129 133 132 130 130 128 122 117 110
East North Central 101 111 112 119 120 127 125 124 125 124 125 122 117
West North Central 113 124 121 128 130 141 138 137 139 141 142 140 128
South Atlantic 110 117 119 128 127 134 130 128 128 125 126 121 115
East South Central 122 132 130 132 135 142 140 136 140 138 136 134 125
West South Central 175 200 200 202 204 216 210 211 214 205 201 194 182
Mountain 118 124 123 129 132 137 136 134 142 142 141 135 120
Pacific 96 102 105 113 114 119 117 115 114 112 111 106 106
About the Monster Employment Index
Launched in April 2004 with data collected since October 2003, the Monster Employment Index is a broad and
comprehensive monthly analysis of U.S. online job demand conducted by Monster Worldwide, Inc. Based on a
real-time review of millions of employer job opportunities culled from a large, representative selection of online
career outlets, including Monster, the Monster Employment Index presents a snapshot of employer online
recruitment activity nationwide. The Monster Employment Index’s underlying data is validated for accuracy by
Research America, Inc. – an independent, third-party auditing firm – to ensure that measured online job
recruitment activity is within a margin of error of +/- 1.05%.
About Monster Worldwide
Monster Worldwide, Inc. (NYSE: MWW), parent company of Monster, the premier global online employment
solution for more than a decade, strives to inspire people to improve their lives. With a local presence in key
markets in North America, Europe, and Asia, Monster works for everyone by connecting employers with quality
job seekers at all levels and by providing personalized career advice to consumers globally. Through online media
sites and services, Monster delivers vast, highly targeted audiences to advertisers. Monster Worldwide is a
member of the S&P 500 index. To learn more about Monster's industry-leading products and services, visit
www.monster.com. More information about Monster Worldwide is available at http://about-monster.com/
Special Note: Safe Harbor Statement Under the Private Securities Litigation Reform Act of 1995: Except for historical information contained
herein, the statements made in this release constitute forward-looking statements within the meaning of Section 27A of the Securities Act of
1933 and Section 21E of the Securities Exchange Act of 1934. Such forward-looking statements involve certain risks and uncertainties, including
statements regarding Monster Worldwide, Inc.'s strategic direction, prospects and future results. Certain factors, including factors outside of
Monster Worldwide's control, may cause actual results to differ materially from those contained in the forward- looking statements, including
economic and other conditions in the markets in which Monster Worldwide operates, risks associated with acquisitions, competition,
seasonality and the other risks discussed in Monster Worldwide's Form 10-K and other filings made with the Securities and Exchange
Commission.
Contacts:
Media Inquiries:
Matthew Henson
Monster Worldwide
978-823-2627
Matthew.Henson@monster.com
7
8. Page 8 of 8
General Information:
Deepika Murty
Monster Worldwide
978-461-8765
Deepika.Murty@monster.com
8