The document discusses economic trends in the United States. It notes that the US economy is divided into eight regions, and the finance, insurance and real estate industry and manufacturing industry make up 37% of GDP. Certain regions and states have experienced stronger growth than others in recent years, led by industries like mining, utilities and information. The largest states by GDP are California, Texas, New York, Florida and Illinois.
Did you know total nonfarm payroll employment fell by 701,000 in March 2020, measuring the effects of COVID-19 and efforts to contain it? Employment in leisure and hospitality fell by 459,000, mainly in food services and drinking places. Notable declines also occurred in health care and social assistance, professional and business services, retail trade, and construction.
Fred Dickson, Chief Investment Strategist for DA Davidson spoke at the Southern Oregon Business Conference on January 26, 2011. While our region has some specific challenges, it is good to hear that we are avoiding a double-dip recession and we can expect to continue a slow recovery.
The Federal Government has spent almost $32 billion on cybersecurity-related expenditures in the past 10 years. More importantly, the cyber spending boom shows no sign of slowing, as spending increased 281 percent from 2006 to 2014 (an average of 22 percent annually). This historic growth in cyber spending runs counter to the greater trend in Federal Government spending that has led to a relatively modest increase of 4.2 percent annually over the same time period.
As the world becomes increasingly digitized, so has the Federal Government, but individual agencies are not spending on cybersecurity in similar ways. Each agency's funding over the past 10 years tells a unique story.
Tightening labour markets: threat or opportunity for HR service providers? The presentation start with an economic outlook and the conséquences for the labour market in Belgium. With some concluding remarks voor HR service providers.
Mercer Capital's Value Focus: Construction and Building Materials | Q1 2020 |...Mercer Capital
Mercer Capital's Construction Industry newsletter provides a broad range of specialized valuation and transaction advisory services to the construction industry, including residential, commercial, civil, paving, concrete, and more. Each issue includes a segment focus, market overview, mergers and acquisitions review, and more.
http://pwc.to/1lN91cC
Comme tous les mois, l’équipe d’économistes de PwC publie une note sur la situation macro-économique mondiale. Ce mois-ci, focus sur l’accroissement des inégalités dans les pays matures ; les incertitudes concernant la croissance chinoise ; et les prévisions de croissance pour la Grande-Bretagne.
This report offers a comprehensive overview of the situation in the United States focusing on the business perspective. The United States remains one of the world’s key economic players. With a real GDP per capita of US$62,479.3, this high-income country occupied 6th place in a 2019 global comparison. The U.S. was home to about 329.1 million people in 2019 and is renowned for its extensive entertainment industry.
What's included?
Economic conditions (incl. COVID-19 economic impact), public finances, and detailed information on the labor force
Demographics, consumption, and income
Imports, exports, foreign direct investments
Fitch Solutions operational risk indexes
Business culture and local habits
Government structure, overview of stability and threats, and the political environment
Territorial CO2 emissions, energy shares, and PM2.5 exposure
In the US …
> US federal R&E credit lapses again – will it be renewed?
> Presidential candidates acknowledge need for a better federal-level program
> California, Wisconsin and Indiana increase their state-level tax credits
In Canada …
> Ottawa hints at “SR&ED Overhaul” in 2008 budget
Breaking Out of a Circle of Scarcity: The Oregon Business Plan's Challenge f...The Oregon Business Plan
Sliding per capita income is leading to low investments in public services. Medicaid and Prison spending are squeezing out investments in education, further driving down personal incomes. Over the next decade the aging baby-boomers and an increasingly diverse population will put more pressure on government revenues. Oregon is trapped in a "circle of scarcity." Breaking out of it is the most important task for Oregon's business, elected and community leaders today.
Why the Income Tax Cuts Hurt More Than They HelpWomen for Kansas
Presentation by Bernie Koch, director of the Kansas Economic Progress Council, given at the Taking Back Kansas convention on August 30, 2014, in Wichita, Kansas.
U.S. employment update and outlook: November 2014JLL
October records another month of 200,000+ job gains
The U.S. economy saw the addition of 214,000 net new jobs in October. With revisions of earlier months’ data, this makes October the eighth consecutive month with gains surpassing 200,000 jobs.
This steady expansion has helped to push down unemployment, which fell by 10 basis points to 5.8 percent. Total unemployment—which includes detached workers—dropped by 30 basis points to a recovery low of 11.5 percent, also below the long-term average.
See more economic, office and real estate research at http://bit.ly/1wCNyXQ
Latin America’s emerging sectors:A closer look at fintech and renewable energyDubaiChamber
Latin America’s emerging sectors: A closer look at fintech and renewable energy is an Economist Intelligence Unit report, sponsored by Dubai Chamber of Commerce and Industry. This report explores high potential emerging economic sectors in Latin America, focusing on financial technology (fintech) and renewable energy. We review the factors driving growth in these
sectors and key impediments to further growth. This report is based on extensive desk research and in-depth interviews with entrepreneurs and regional experts in Latin America and the Caribbean (LAC). The interviews were conducted in December 2017 and January 2018.
IAR Public Policy Meetings, January 26, 2011.
Presented by Geoffrey J.D. Hewings, Director, Regional Economics Applications Laboratory - University of Illinois Institute of Government and Public Affairs
GroupM has released its Global Mid-Year Media Forecast that details how COVID-19 sharply transformed the global advertising economy from a 6.2% growth rate in 2019 to a double-digit decline this year.
This report report from Brookings, with Rockefeller Foundation support, shows that building up a region’s advanced industries is one such possibility with enormous potential. These industries not only create good jobs within the industry, but also up and down their massive supply chains. These jobs provide higher wages and greater opportunity to low and middle-income workers adversely affected by the economic recession.
Running head COMPARISON OF SOUTH KOREA AND USA .docxtodd271
Running head: COMPARISON OF SOUTH KOREA AND USA 1
COMPARISON OF SOUTH KOREA AND USA 6
COMPARISON OF SOUTH KOREA AND USA
Applied Managerial Economic
April 15, 2020
To asses and look at the Gross domestic product and different elements of the nation, it is significant for rulers to contemplate the administrative, financial aspects. Administrative, financial matters are the training of how phenomenal assets are assimilated most expertly to achieve administrative zones. It is an esteemed gear for inspecting business conditions to take better ends. We can concentrate as a matter of first importance the interest and its different components influencing the interest; it would be the primary substances of any nation or individual development. To assess the Gross domestic product of any nation, it is significant for the researcher to look at the interest capacities and their employment rate.
In 2018, the normal inflation rate in South Korea added up to about 1.48 percent contrasted with the earlier year, while in the USA added up to about 2.4 percent.
High paces of inflations are unfortunate, much the same as low rates, and South Korea is right now battling with the last mentioned. South Korea is really a prosperous nation and at present positions eleventh on the rundown of the 20 nations with the biggest Gross domestic product; however, its inflation rate is liable to worry, as it is right now at levels beneath 2 percent (Plecher, 2019).
Notwithstanding, there is still an expectation that inflation will come back to steady rates somewhere in the range of 3 and 4.5 percent. At present, South Korea is endeavoring to adjust its dependence on exports by growing the services industry, particularly as the export marketplace declines.
Gross domestic product is the aggregate of business offering manufactured in a nation annually; it is a solid pointer of financial quality. In 2018, South Korea's Gross domestic product was about 1.72 trillion U.S. dollars. While the USA's Gross domestic product was about 20.58 trillion dollars
In the USA, the economy is relied upon to develop at a gentler pace this year. Obscuring monetary upgrade and frail business venture will diminish development, while further drawback dangers radiate from a submissive worldwide crisis, the coronavirus epidemic and the impacts of waiting for exchange pressures. Economists see Gross domestic product extending 1.7% in 2020, declining 0.1 rate points from previous month prediction and in 2021, its 1.8 percent (U.S. Economic Outlook, 2020).
In South Korea, this year, monetary development is relied upon to speed up marginally because of improvement in fixed speculation and as the innovation and development parts fortify. Eventually, more vulnerable than-anticipated development in China, the coronavirus pandemic in the locale and political strains with Japan present significant draw.
This presentation provides analysis of GDP (Gross Domestic Product) for Canada. The presentation will highlight areas like consumer spending, exports, government spending and other areas.
The DC Development Report is a summary of the major development and construction projects in the District of Columbia. The Washington, DC Economic Partnership (WDCEP) began tracking development activity in 2001 with the hope of creating a comprehensive database that would answer a number of questions in regards to the construction activity in the city. The Report summarizes our entire database of projects, highlights major projects and what lies ahead for development in the District of Columbia.
This update of the DC Development Report is an overview of development activity and of the expansion occurring in DC. As a resource book, it is a compilation of nearly 14 years of data collection and research that provides an overview of an ever-changing development and construction cycle.
The WDCEP performs an annual “development census” in the month of September and receives contributions from more than 100 developers, architects, contractors and economic development organizations. This outreach results in updates to more than 350 projects. While our database of projects is constantly being updated, for the purposes of this publication all data reflects project status, design and information as of September 2014.
In 2014 the WDCEP partnered with CBRE to provide an economic overview of DC and in-depth analysis of the office, retail and residential markets. Although every attempt was made to ensure the quality of the information contained in this document, the WDCEP and CBRE makes no warranty or guarantee as to its accuracy, completeness or usefulness for any given purpose.
1.
1
Muni
Economic
Outlook
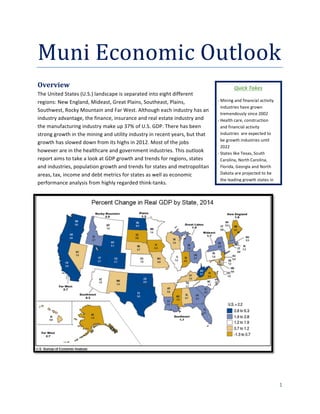
Overview
The
United
States
(U.S.)
landscape
is
separated
into
eight
different
regions:
New
England,
Mideast,
Great
Plains,
Southeast,
Plains,
Southwest,
Rocky
Mountain
and
Far
West.
Although
each
industry
has
an
industry
advantage,
the
finance,
insurance
and
real
estate
industry
and
the
manufacturing
industry
make
up
37%
of
U.S.
GDP.
There
has
been
strong
growth
in
the
mining
and
utility
industry
in
recent
years,
but
that
growth
has
slowed
down
from
its
highs
in
2012.
Most
of
the
jobs
however
are
in
the
healthcare
and
government
industries.
This
outlook
report
aims
to
take
a
look
at
GDP
growth
and
trends
for
regions,
states
and
industries,
population
growth
and
trends
for
states
and
metropolitan
areas,
tax,
income
and
debt
metrics
for
states
as
well
as
economic
performance
analysis
from
highly
regarded
think-‐tanks.
Quick
Takes
-‐ Mining
and
financial
activity
industries
have
grown
tremendously
since
2002
-‐ Health
care,
construction
and
financial
activity
industries
are
expected
to
be
growth
industries
until
2022
-‐ States
like
Texas,
South
Carolina,
North
Carolina,
Florida,
Georgia
and
North
Dakota
are
projected
to
be
the
leading
growth
states
in
2.
2
Past
&
Future
Trends
in
the
U.S.
Economy
GDP
Trends
Region
The
eight
regions
of
the
U.
S.
are
most
notably
known
for
their
exposure
to
the
finance,
insurance
and
real
estate
(financial
activity)
indsutry.
The
regions
driving
the
financial
activity
exposure
are
both
the
Mideast
and
the
Southeast
making
up
about
44%
of
the
industry.
The
Southeast
and
the
Far
West
are
the
two
largest
regions
from
a
GDP
standpoint
(see
chart
above).
The
Southeast
region
has
large
exposure
to
both
the
financial
activity
industrry
(22%)
and
manufacturing
industry
(15%).
The
Far
West
region
has
large
exposure
to
both
the
financial
activity
industry
(23%)
and
professional
and
business
service
industry
(14%),
which
consists
of
technical
services,
management
of
companies,
and
waste
services.
The
Soutwest
region
had
the
largest
growth
from
2011
to
2014.
This
growth
was
led
by
the
mining
industry
with
32%
growth.
Most
of
the
southwest
mining
exposure
comes
from
Texas,
who
has
greatly
benefitted
from
the
oil
boom
that
we
have
most
recently
seen.
State
California
is
the
largest
state
in
the
U.S.
from
a
GDP
standpoint
and
has
had
extraordinary
growth
in
the
information
industry
since
2011.
This
industry
consists
of
publishing,
software,
motion
picture
and
many
other
sectors.
Its
largest
industry
is
the
financial
activity
industry
representing
21%
of
their
GDP.
Texas
has
been
the
outlier
compared
to
other
large
states
with
growth
of
22%.
This
growth
has
been
fueled
by
both
the
utility
industry
(52%)
consisting
of
electric
power,
natural
gas,
water
supply
and
waste
management
and
the
mining
industry
(37%).
Area
Percent
Growth
(2011-2014)
2014 GDP
(Millions)
% of U.S.
Economy
Southwest 16.90 1,975,615 13%
Rocky Mountain 8.60 542,102 3%
Far West 8.20 2,947,421 19%
United States 7.60 15,773,516 100%
Plains 7.20 1,021,091 6%
Great Lakes 6.40 2,187,656 14%
Mideast 5.60 2,876,279 18%
Southeast 5.00 3,365,475 21%
New England 4.70 852,517 5%
Percent
Growth
(2011-2014)
United States 12.3 15,773,516$ 100.0%
California 13.7 2,113,280$ 13.4%
Texas 22 1,467,342$ 9.3%
New York 13.8 1,279,921$ 8.1%
Florida 14 769,662$ 4.9%
Illinois 9.6 680,448$ 4.3%
Area
2014 GDP
(Millions)
% of U.S.
Economy
3.
3
From
a
growth
perspective,
different
states
take
the
stage.
North
Dakota
led
the
way
with
36%
growth
led
by
the
mining
industry
(107%)
and
the
construction
industry
(61%).
Although
North
Dakota
should
not
be
discounted,
it
only
represents
0.3%
of
U.S.
GDP.
Colorado,
behind
Texas
is
the
second
largest
state
with
notable
growth.
Colorado
has
seen
growth
in
its
construction
industry
(33%)
and
utility
industry
(20%).
The
financial
activity
industry
represents
19%
of
their
GDP
and
grew
at
a
rate
of
17%
from
2011
to
2014.
Industry
Trends
The
private
industry
accounts
for
88%
of
the
U.S.
GDP.
A
substaintial
amount
of
the
U.S.
GDP
comes
from
the
financial
activity
industry,
professional
and
business
services
industry,
and
the
manufacturing
industry.
The
financial
activity
industry
represnts
about
23%
of
GDP
and
grew
about
15%
from
2011
to
2014.
The
professional
and
business
services
industry
represents
about
14%
of
GDP
and
grew
about
15%
from
2011
to
2014.
The
manufacturing
industry
represents
about
14%
of
GDP
and
grew
about
9%
from
2011
to
2014.
Although
the
manufacturing
industry
has
grown
over
the
four
year
span,
the
rate
at
which
it
has
grown
year
over
year
has
been
declining.
This
can
mainly
be
attributed
to
developing
coutries
having
a
cheap
labor
advantage,
therefore
companies
outsource
their
manufacturing
to
countries
other
than
the
U.S.
From
a
growth
perspective,
the
construction
industry
had
the
highest
growth
than
any
other
industry
at
18%.
Although
they
recorded
the
highest
growth,
their
industry
growth
growth
has
been
decreasing
year
over
year.
On
the
other
hand,
indutries
like
utilities
and
mining
have
experienced
lower
growth,
but
consistenet
increases
in
year
over
year
growth.
The
utility
inudstry
only
experienced
7%
growth
from
2011
to
2014,
but
their
growth
trend
is
positive
at
8%.
The
mining
industry
experienced
15%
growth
from
2011
to
2014
and
their
growth
trend
has
been
positive
at
3%.
Industries
that
have
had
large
negative
growth
trends
are
agriculture,
construction,
trade
and
manufacturing.
Percent
Growth
(2011-2014)
United States 12.3 15,773,516$ 100.0%
Texas 22 1,467,342$ 9.3%
Colorado 15 279,650$ 1.8%
Oklahoma 13.2 162,377$ 1.0%
Utah 13.4 128,178$ 0.8%
North Dakota 36.2 48,233$ 0.3%
Area
2014 GDP
(Millions)
% of U.S.
Economy
4.
4
Although
most
of
the
U.S.
GDP
between
2011
and
2014
came
from
the
financial
activity
industry,
that
was
not
the
case
for
job
growth.
The
professional
and
business
services
industry
is
the
largest
industry,
other
than
the
government
from
an
employment
standpoint.
The
professional
and
business
services
industry
represents
12%
of
the
private
jobs
and
grew
about
12%
since
2002.
The
healthcare
and
social
assistance
industry
represents
12%
of
private
industry
jobs
and
has
grown
25%
since
2002.
Forward
looking,
health
care
and
social
assistance
had
the
highest
projected
job
growth
from
2012
to
2022
with
a
growth
rate
of
about
29%.
Some
reasons
this
could
be
the
case
is
the
shift
towards
an
older
demographic
creating
more
care
needs
and
the
implementation
of
Obamacare
(ACA)
bringing
more
customers
to
healthcare
companies.
Some
of
the
areas
that
could
benefit
from
healthcare
growth
are
Houston,
TX;
Philadelphia,
PA;
Boston,
MA;
Denver,
CO
and
Fargo,
ND.
Following
right
along,
construction
is
also
projected
to
grow
at
about
29%
between
that
time
period
as
well.
Although
the
U.S.
economy
is
considered
to
be
sluggish,
it
is
continuing
to
grow,
and
the
construction
industry
is
an
industry
highly
correlated
with
GDP
growth.
Some
of
the
areas
that
could
benefit
from
the
increase
in
construction
are
New
York,
NY;
Dallas,
TX;
Washington,
D.C.
and
Atlanta,
GA.
On
the
other
hand,
some
of
the
industries
where
employment
fell
by
21%
were
agriculture
and
manufacturing.
States
that
have
large
exposure
to
the
agriculture
industry
are
Rhode
Island,
Idaho,
New
Mexico
and
Alaska
and
states
that
have
large
exposure
to
the
manufacturing
industry
are
Indiana,
Wisconsin,
Michigan,
Iowa
and
Alabama.
As
we
look
towards
future
investments
in
municipal
bonds,
states
with
large
exposure
to
these
declining
industries
will
certainly
be
a
factor
in
determining
final
investment.
5.
5
Population
Trends
State
U.S.
population
grew
at
an
average
rate
of
0.76%
and
a
total
rate
of
3%
from
2010
to
2014.
Twenty-‐eight
states
had
population
growth
less
than
the
U.S
and
thirty-‐one
states
had
population
outflows.
The
most
notable
states
with
outflows
were
Alaska,
Washington,
D.C.,
New
Mexico,
Wyoming
and
Connecticut.
On
the
contrary,
the
states
with
the
most
notable
population
inflows
were
Nevada,
North
Dakota,
Arizona,
Idaho
and
South
Carolina.
It
is
interesting
to
see
the
states
that
have
seen
the
highest
population
outflows
also
have
some
of
the
highest
outstanding
debt
per
capita.
As
mentioned
earlier,
California
is
the
largest
state
from
a
GDP
standpoint
and
as
we
can
see
from
the
chart
on
our
right,
it
is
also
the
largest
state
from
a
population
standpoint.
Most
notably,
the
state’s
population
that
grew
the
most
over
this
time
period
was
Texas.
The
reason
that
Texas’
population
grew
at
such
a
high
rate
is
because
of
the
growth
in
the
utility
industry
and
mining
industry.
Utility
and
mining
industry
growth
was
also
prominent
in
North
Dakota
where
it
grew
about
107%
and
was
a
large
factor
in
their
10%
population
growth
since
2010.
Population
growth
and
trends
carry
a
lot
of
weight
when
looking
at
this
type
of
data.
Population
growth
gives
us
an
indication
as
to
where
people
have
been
moving
to
and
the
trend
helps
us
to
gage
a
better
indication
as
to
where
people
are
headed
to
in
the
future.
State Population Growth Since 2010 Trend
California 38,802,500 3.9% -0.01%
Texas 26,956,958 6.8% 0.07%
Florida 19,893,297 5.5% 0.14%
New York 19,746,227 1.8% -0.37%
Illinois 12,880,580 0.3% -0.22%
Pennsylvania 12,787,209 0.6% -0.21%
Ohio 11,594,163 0.5% 0.15%
Georgia 10,097,343 3.9% 0.01%
North Carolina 9,943,964 4.0% 0.00%
Michigan 9,909,877 0.3% 0.13%
Top 10 States by Population
State Population Growth Since 2010 Trend
North Dakota 739,482 9.7% 0.54%
District of Columbia 658,893 8.9% -1.01%
Texas 26,956,958 6.8% 0.07%
Colorado 5,355,866 6.1% 0.18%
Utah 2,942,902 6.1% -0.10%
Florida 19,893,297 5.5% 0.14%
Nevada 2,839,099 5.0% 1.15%
Arizona 6731484 5.0% 0.50%
Washington 7,061,530 4.7% 0.07%
South Dakota 853,175 4.5% -0.07%
Top 10 States by Growth
6.
6
Metropolitan
Area
Metropolitan
areas
(metro
areas)
have
always
been
viewed
as
the
most
populated
areas
given
the
mass
amount
of
employers
in
those
areas.
As
we
approached
2015
however,
that
trend
has
been
reversing.
The
average
population
growth
trend
for
all
U.S.
metro
areas
has
been
flat
since
2010
and
there
has
been
total
population
outflows
from
metro
areas
of
-‐0.24%.
Based
on
population
growth
in
metro
areas
from
2010
to
2014,
there
seems
to
be
a
negative
growth
trend.
To
understand
more
about
what
metro
areas
are
causing
this
negative
trend,
we
will
dig
into
growth
data
for
the
largest
metro
areas,
highest
growth
metro
areas,
and
metro
areas
with
the
best
and
worst
trends.
The
top
five
populated
metro
areas
are
New
York-‐Newark-‐Jersey
City,
NY-‐NJ-‐PA;
Los
Angeles-‐Long
Beach-‐Anaheim,
CA;
Chicago-‐Naperville-‐Elgin,
IL-‐IN-‐WI;
Dallas-‐Fort
Worth-‐Arlington,
TX
and
Houston-‐
The
Woodlands-‐Sugar
Land,
TX.
On
average,
population
in
those
these
areas
grew
about
4%
from
2010
to
2014
with
the
Houston-‐The
Woodlands-‐Sugar
Land
metro
area
being
the
highest
at
9%
and
Chicago-‐
Naperville-‐Elgin
being
the
lowest
at
0.89%.
The
average
population
growth
for
these
areas
showed
a
flat
trend
and
total
negative
outflows.
Only
the
two
metro
areas
of
Dallas-‐Fort
Worth-‐Arlington
and
Houston-‐The
Woodlands-‐Sugar
Land
have
positive
population
growth
trends
since
2010.
This
data
shows
that
the
population
growth
that
large
metro
areas
were
once
seeing
is
slowing
down
and
in
some
cases
non-‐existent.
Given
the
slow
and
flat
population
growth
in
metro
areas,
there
are
some
bright
spots
in
the
less
populated
metro
areas.
The
top
five
metro
areas
that
have
seen
the
highest
growth
since
2010
have
been
The
Villages,
FL;
Midland,
TX;
Austin-‐Round
Rock,
TX;
Odessa,
TX
and
Myrtle
Beach-‐Conway-‐North
Myrtle
Beach,
SC-‐NC.
They
averaged
population
growth
of
14%
since
2010
and
have
had
both
an
average
and
total
population
inflow
trend.
The
trend
of
a
metro
areas
population
is
the
best
indication
of
future
metro
area
migration
as
population
projections
are
not
released
by
the
government.
The
top
five
metro
areas
who
have
shown
strong
positive
growth
trends
since
2010
are
Punta
Gorda,
FL;
Panama
City,
FL;
Jacksonville,
NC;
Hilton
Head
Island-‐Bluffton-‐Beaufort,
SC
and
Bend-‐Redmond,
OR.
These
metro
areas
although
smaller
in
population,
have
experienced
a
positive
growth
trend
and
have
had
population
growth
of
about
6%
since
2010.
Most
of
the
metro
areas
with
strong
population
growth
trends
are
concentrated
in
Florida,
North
Carolina
and
South
Carolina.
These
areas
have
attracted
migration
primary
from
retirees
looking
for
a
lower
tax
structure
and
cost
of
living,
but
also
because
they
are
seen
as
more
attractive
areas
for
the
younger
population.
On
the
contrary,
there
are
also
some
less
populated
metro
areas
that
have
seen
tremendous
population
outflows.
These
metro
areas
consist
of Columbus,
GA-‐AL,
Manhattan,
KS,
Yuma,
AZ,
Kennewick-‐
Richland,
WA
and
Hinesville,
GA.
Although
these
areas
have
had
average
population
growth
of
5.5%
since
2010,
they
are
seeing
the
growth
decline.
With
a
large
negative
growth
trend,
these
areas
have
the
largest
population
outflows.
For
more
metro
area
population
data,
please
see
Appendix
A1.
7.
7
Tax,
Income
and
Debt
Metrics
States
that
have
high
state
and
local
tax
burdens
seem
to
also
have
high
per
capita
income
as
indicated
on
the
two
charts
to
the
right.
As
we
saw
from
the
state
population
growth
charts
before,
states
like
Connecticut
and
Rhode
Island,
where
population
growth
has
been
slow
could
be
because
of
high
state
and
local
tax
burdens.
Net
Tax-‐
Supported
Debt
Per
Capita
(NTSD)
is
a
good
indication
of
a
state’s
debt
outstanding.
A
similar
trend
is
revealed
here
from
the
charts
above
as
we
see
states
like
CT,
MA,
NY
and
NJ
in
the
top
ranks.
When
taxes
are
tied
up
in
debt,
it
sometimes
can
limit
the
state’s
ability
to
use
it
for
growth
and
expansion
projects.
As
this
may
be
the
case
on
certain
occasions,
low
NTSD
does
not
necessarily
mean
more
spending
to
come
in
the
future.
States
have
been
conservative
when
issuing
debt
even
given
the
low
interest
rate
environment.
Their
debt
issuance
has
been
targeted
toward
refinancing
as
they
would
like
to
spend
more
on
education
and
healthcare
in
the
future.
Another
metric
similar
to
NTSD
is
total
debt
per
capita,
which
brings
together
the
NTSD
debt
as
well
as
any
other
debt
outstanding.
Puerto
Rico
and
Washington,
D.C.,
the
two
municipalities
that
that
have
the
highest
NTSD
also
have
the
highest
total
debt
outstanding.
Puerto
Rico
leads
the
pack
with
$27,934
per
capita.
States
like
Connecticut,
Hawaii,
Illinois
and
Rhode
Island
who
are
seen
as
economically
troubled
states
also
have
very
high
total
debt
per
capita.
Some
states
with
low
debt
per
capita
include
South
Dakota,
Tennessee,
North
Carolina
and
Nebraska.
Florida
and
Texas
also
have
relatively
low
total
debt
per
capita
and
could
be
poised
for
strong
economic
growth
in
the
future.
State 2011 2010 Change
U.S. Average $ 4,217 $ 4,112 2.6%
Connecticut $ 7,150 $ 6,984 2.4%
New Jersey $ 6,675 $ 6,689 -0.2%
Dist. Of Columbia $ 6,641 $ 5,991 10.8%
New York $ 6,622 $ 6,375 3.9%
Maryland $ 5,598 $ 5,234 7.0%
Massachusetts $ 5,586 $ 5,422 3.0%
California $ 5,136 $ 4,934 4.1%
Minnesota $ 4,858 $ 4,727 2.8%
Rhode Island $ 4,676 $ 4,627 1.1%
Illinois $ 4,658 $ 4,512 3.2%
Total State- Local
Taxes Per Capita
State 2011 2010
Change
U.S. Average 42,473$ 41,146$ 3.2%
Dist. Of Columbia 68,795$ 64,756$ 6.2%
Connecticut 60,287$ 56,914$ 5.9%
New Jersey 54,422$ 53,869$ 1.0%
Massachusetts 54,321$ 51,991$ 4.5%
Maryland 52,805$ 51,329$ 2.9%
New York 52,417$ 49,935$ 5.0%
Wyoming 50,805$ 47,900$ 6.1%
Virginia 48,498$ 46,872$ 3.5%
Alaska 47,354$ 46,098$ 2.7%
New Hampshire 47,349$ 45,864$ 3.2%
Per Capita Income
8.
8
Think-‐‑Tank
Analysis
Brookings
Institute
William
Frey
from
the
Brooking
Institute
is
an
expert
on
U.S.
Census
data,
migration
and
urban
and
metropolitan
demographics
as
well
as
many
other
areas.
In
a
recent
study
regarding
America’s
Young
Adults,
Frey
voiced
his
opinion
on
where
the
millennial
generation
is
migrating.
Frey
refers
to
the
young/millennial
generation
as
those
from
25-‐29
years
old
and
his
belief
is
that
this
age
group
is
moving
long
distance
rather
than
short
distance.
The
question
is
where
are
they
going?
Technology
has
been
the
trend
over
the
past
couple
of
years
and
millennials
are
moving
to
knowledge
base
areas
and
high
tech
area’s
because
it
offers
them
more
of
a
youthful
appeal.
Areas
that
have
these
types
of
characteristics
are
Washington,
D.C.,
Houston,
Denver
and
Austin.
The
main
reason
that
they
are
moving
to
these
areas
is
for
jobs.
In
addition
to
this,
the
reason
that
they
can
afford
to
make
long
distance
moves
is
because
they
do
not
have
any
“baggage”
as
Frey
calls
it.
Essentially,
they
have
no
reason
to
stay
where
they
currently
are
and
therefore
have
the
ability
to
relocate.
Young
adults
are
seen
as
a
leading
indicator
as
to
where
the
population
shift
will
be
in
the
future.
Two
of
the
places
that
he
believes
will
see
the
most
population
inflows
will
be
Charlotte,
NC
and
Atlanta,
GA
because
of
their
younger
population
and
growing
economies.
ALEC
Laffer
Report
–
2015
The
ALEC
Laffer
report
is
a
study
done
by
three
economists
who
analyze
and
project
current
and
future
state
performance
based
on
15
policy
variables
and
3
performance
variables.
Their
theory
is
that
states
that
spend
less
and
tax
less
experience
more
economic
growth
than
those
who
spend
and
tax
more.
Once
the
states
are
ranked
based
on
the
15
policy
objectives,
they
are
weighted
for
state
gross
domestic
product,
absolute
domestic
migration
and
non-‐farm
payroll.
On
the
next
page,
you
will
find
two
sets
of
charts
representing
current
state
economic
performance
as
well
as
projected
state
economic
performance.
Many
of
the
states
with
the
highest
economic
outlook
are
states
that
we
believe
will
have
future
economic
success
too.
9.
9
Economic
Performance
and
Outlook
Rankings
The
three
variables
for
measuring
state
performance
were
GDP
growth,
migration,
and
non-‐farm
payroll
growth.
The
Top
10
states
showed
average
GDP
growth
of
about
79%,
compared
to
about
34%
for
the
Bottom
10,
migration
inflows
of
185,209
compared
to
outflows
of
178,748
and
non-‐farm
payroll
growth
of
about
16%
compared
to
0.08%.
The
major
variables
that
separate
the
Top
10
from
the
Bottom
10
are:
lower
taxes,
no
progressive
personal
income
tax,
low
top
marginal
and
corporate
tax
rates,
high
sales
tax
burden,
but
a
low
property
tax
burden
and
are
right
to
work
states.
The
economic
outlook
ranking
given
by
ALEC
Laffer
is
out
of
50
and
the
Top
10
have
an
average
of
16.5
while
to
Bottom
10
have
an
average
of
33.4.
For
more
data
on
specific
states,
please
see
Appendix
A2.
Rank State
Rank State
1 Texas 41 Mississippi
2 North
Dakota 42 Missouri
3 Utah 43 Wisconson
4 Oklahoma 44 Maine
5 Wyoming 45 Connecticut
6 Washington 46 Illinois
7 Oregon 47 Rhode
Island
8 Montana 48 New
Jersey
9 Colorado 49 Ohio
10 North
Carolina 50 Michigan
Top
10
Economic
Performance
Rankings Bottom
10
Economic
Performance
Rankings
Rank State
Rank State
1 Utah 41 Pennsylvania
2 North
Dakota 42 Maine
3 Indiana 43 Montana
4 North
Carolina 44 California
5 Arizona 45 Oregon
6 Idaho 46 New
Jersey
7 Georgia 47 Connecticut
8 Wyoming 48 Minnesota
9 South
Dakota 49 Vermont
10 Nevada 50 New
York
Top
10
Economic
Outlook
Rankings Bottom
10
Economic
Outlook
Rankings
10.
10
Conclusion
From
2002
to
the
present
day,
the
states
who
are
big
players
in
the
mining
industry
have
seen
extraordinary
economic
growth.
Texas
and
North
Dakota
are
two
examples
of
this.
Texas
has
grown
about
21%
since
2011
and
North
Dakota
has
grown
about
36%
since
2011.
The
extraordinary
growth
these
states
saw
also
drove
their
respective
regions
to
be
strong
growth
regions
as
well.
When
taking
a
look
at
the
states
that
represent
a
large
portion
of
the
U.S.
economy,
California,
Texas
and
New
York
lead
the
pack.
Together
they
represent
a
little
bit
over
30%
of
the
U.S.
economy,
but
besides
Texas,
they
have
been
growing
at
rates
similar
to
the
U.S.
economy
as
a
whole.
The
main
reason
that
this
is
the
case
is
because
of
the
high
tax
environment
the
states
operate
in.
Population
growth
in
populated
metro
areas
has
been
slowing
down.
One
factor
behind
this
is
the
increasing
older
population
is
seeking
a
living
environment
where
they
can
enjoy
their
retirement
and
their
cost
of
living
is
low.
This
means
that
high
income
and
high
tax
states
such
as
Connecticut,
New
Jersey,
New
York
and
Massachusetts
have
seen
population
outflows
mainly
due
to
high
tax
burdens
and
costs
of
living.
Meanwhile,
states
like
North
Dakota
and
Texas
who
have
low
tax
burdens
and
somewhat
diversified
economies
have
seen
increasing
economic
growth.
Although
oil
has
been
the
driver
of
some
economies
over
the
past
couple
of
years,
economies
have
also
seen
strong
GDP
growth
in
the
finance
and
healthcare
industries.
As
one
of
the
most
advanced
economies,
the
U.S.
is
moving
toward
an
economy
focused
on
capital
markets
and
health.
The
Bureau
of
Labor
Statistics
believes
that
the
finance
and
healthcare
industry
is
poised
to
enter
a
takeoff
period
where
employment
growth
could
increase
20%
for
both
industries.
Areas
such
as
Boston,
MA;
Denver,
CO
and
Fargo,
ND
could
benefit
greatly
from
the
expected
growth
in
healthcare.
Given
all
of
the
economic
data
discussed,
we
believe
that
there
are
a
handful
of
states
to
watch
as
they
may
struggle
from
the
path
the
U.S.
economy
is
headed.
Michigan
is
the
auto
manufacturing
hub
and
could
either
benefit
from
the
growing
economy
or
struggle
from
the
declining
manufacturing
industry.
Tennessee
was
just
voted
the
best
place
to
manufacture
automobiles
and
is
seen
as
an
attractive
contender
to
Michigan
with
its
low
tax
environment.
Connecticut,
New
Jersey
and
New
York
are
also
on
the
watch
list
as
they
operate
in
an
extremely
high
tax
rate
environment.
The
millennial
generation
is
in
the
search
for
areas
with
youthful
population
and
technological
innovation
and
the
older
population
is
in
search
for
areas
with
low
taxes
and
low
costs
of
living.
So,
the
final
question
to
ask
is
what
states
are
going
to
benefit
from
future
economic
growth:
Texas,
particularly
Houston
and
Dallas
are
two
areas
that
have
experienced
strong
economic
growth,
as
well
as
population
growth
and
the
trends
seem
to
be
in
their
favor.
South
Carolina
and
North
Carolina
are
two
states
that
have
low
debt
outstanding,
strong
migration
trends
and
a
large
financial
activity
industry.
Florida
has
always
had
strong
population
growth
and
is
a
pro-‐business
state.
Georgia
was
most
recently
voted
the
best
state
to
do
business
and
a
growing
economy
with
a
youthful
appeal.
Lastly,
even
though
North
Dakota
saw
strong
economic
growth
in
recent
years,
it
is
still
in
a
goof
position
to
grow
with
large
healthcare,
financial
activity
and
mining
industries
and
strong
migration
trends.
11.
11
Appendix
A1
State 2014 Growth since 2010 Trend
The Villages, FL Metro Area 114,350 21.3% 0.84%
Midland, TX Metro Area 161,290 13.7% 0.32%
Austin-Round Rock, TX Metro Area 1,943,299 12.5% -0.10%
Odessa, TX Metro Area 153,904 12.3% 1.04%
Myrtle Beach-Conway-North Myrtle Beach, SC-NC Metro Area 417,668 10.3% 1.32%
Bismarck, ND Metro Area 126,597 9.9% 0.23%
St. George, UT Metro Area 151,948 9.8% 0.63%
Auburn-Opelika, AL Metro Area 154,255 9.6% -0.70%
Cape Coral-Fort Myers, FL Metro Area 679,513 9.5% 0.99%
Crestview-Fort Walton Beach-Destin, FL Metro Area 258,042 9.3% 0.62%
Metropolitan Area 2014 Growth since 2010 Trend
New York-Newark-Jersey City, NY-NJ-PA Metro Area 20,092,883 2.52% -0.3%
Los Angeles-Long Beach-Anaheim, CA Metro Area 13,262,220 3.25% -0.2%
Chicago-Naperville-Elgin, IL-IN-WI Metro Area 9,554,598 0.89% -0.1%
Dallas-Fort Worth-Arlington, TX Metro Area 6,954,330 7.77% 0.0%
Houston-The Woodlands-Sugar Land, TX Metro Area 6,490,180 9.10% 0.6%
Philadelphia-Camden-Wilmington, PA-NJ-DE-MD Metro Area 6,051,170 1.34% -0.2%
Washington-Arlington-Alexandria, DC-VA-MD-WV Metro Area 6,033,737 6.49% -0.9%
Miami-Fort Lauderdale-West Palm Beach, FL Metro Area 5,929,819 6.15% -1.0%
Atlanta-Sandy Springs-Roswell, GA Metro Area 5,614,323 5.8% 0.3%
Boston-Cambridge-Newton, MA-NH Metro Area 4,732,161 3.67% -0.2%
Metropolitan Area 2014 Growth since 2010 Trend
The Villages, FL Metro Area 114,350 21.3% 0.8%
Midland, TX Metro Area 161,290 13.7% 0.3%
Austin-Round Rock, TX Metro Area 1,943,299 12.5% -0.1%
Odessa, TX Metro Area 153,904 12.3% 1.0%
Myrtle Beach-Conway-North Myrtle Beach, SC-NC Metro Area 417,668 10.3% 1.3%
Bismarck, ND Metro Area 126,597 9.9% 0.2%
St. George, UT Metro Area 151,948 9.8% 0.6%
Auburn-Opelika, AL Metro Area 154,255 9.6% -0.7%
Cape Coral-Fort Myers, FL Metro Area 679,513 9.5% 1.0%
Crestview-Fort Walton Beach-Destin, FL Metro Area 258,042 9.3% 0.6%
Metropolitan Area 2014 Growth since 2010 Trend
Punta Gorda, FL Metro Area 168,474 5.34% 2.33%
Panama City, FL Metro Area 194,929 5.30% 2.04%
Jacksonville, NC Metro Area 187,589 4.47% 1.96%
Hilton Head Island-Bluffton-Beaufort, SC Metro Area 203,022 8.05% 1.53%
Bend-Redmond, OR Metro Area 170,388 7.96% 1.43%
North Port-Sarasota-Bradenton, FL Metro Area 748,708 6.43% 1.41%
Sebastian-Vero Beach, FL Metro Area 144,755 4.72% 1.39%
Myrtle Beach-Conway-North Myrtle Beach, SC-NC Metro Area 417,668 10.31% 1.32%
Prescott, AZ Metro Area 218,844 3.96% 1.29%
Deltona-Daytona Beach-Ormond Beach, FL Metro Area 609,939 3.26% 1.28%
Metropolitan Area 2014 Growth since 2010 Trend
Columbus, GA-AL Metro Area 314,005 5.92% -3.03%
Manhattan, KS Metro Area 98,091 5.09% -2.72%
Yuma, AZ Metro Area 203,247 3.12% -2.20%
Kennewick-Richland, WA Metro Area 274,295 7.32% -1.96%
Hinesville, GA Metro Area 82,311 6.39% -1.87%
Watertown-Fort Drum, NY Metro Area 119,103 2.15% -1.80%
El Paso, TX Metro Area 836,698 3.67% -1.74%
Fayetteville, NC Metro Area 377,939 2.78% -1.44%
Valdosta, GA Metro Area 143,317 2.29% -1.31%
Fairbanks, AK Metro Area 99,357 1.21% -1.29%
Top 10 Metropolitan Area's by Population
Top 10 Metropolitan Area's by Growth
Top 10 Metropolitan Area's by Growth Trend
Bottom 10 Metropolitan Area's by Growth Trend
12.
12
A2
State
Gross
Domestics
Product
Growth Absolute
Domestic
Migration Non-‐Farm
Payroll
Texas 81.70% 1229173 20.50%
North
Dakota 149.40% 32185 35.00%
Utah 76.10% 78474 24.00%
Oklahoma 71.00% 97612 11.70%
Wyoming 111.35% 31416 15.80%
Washington 57.30% 275864 11.00%
Oregon 71.40% 174782 7.10%
Montana 69.40% 48162 11.70%
Colorado 51.30% 272722 11.60%
North
Carolina 50.50% 655663 8.30%
State
Gross
Domestics
Product
Growth Absolute
Domestic
Migration Non-‐Farm
Payroll
Mississippi 41.80% -‐41744 0.00%
Missouri 34.00% -‐6229 2.50%
Wisconson 37.70% -‐56632 2.30%
Maine 30.00% -‐1063 -‐1.00%
Connecticut
45.20% 584103 9.10%
Illinois 35.60% -‐646867 0.50%
Rhode
Island 31.60% -‐69187 -‐2.80%
New
Jersey 34.60% -‐524205 -‐1.10%
Ohio 32.60% -‐397184 -‐2.30%
Michigan 14.40% -‐628472 -‐6.40%
Top
10
Economic
Performance
Rankings,
2003-‐2013
Bottom
10
Economic
Performance
Rankings,
2003-‐2013
UT ND ID NC AZ IH GA WY SD NV
Top
Marginal
Personal
Income
Tax
Rate 5.00% 3.22% 5.07% 5.75% 4.54% 7.40% 6.00% 0.00% 0.00% 0.00%
Top
Marginal
Corporate
Income
Tax
Rate 5.00% 4.53% 7.00% 5.00% 6.00% 7.40% 6.00% 0.00% 0.00% 0.00%
Personal
Income
Tax
Progressivity 0 9.12 0.68 5.75 10.62 13.4 6.53 0 0 0
Property
Tax
Burden 26.98 22.01 26.68 24.49 29.21 25.57 28.56 45.43 26.81 27.2
Sales
Tax
Burden 25.17 35.62 27.33 21.54 36.74 22.48 25.25 41.38 30.46 35.96
Remaining
Tax
Burden 15.59 19.68 18.54 16.89 12.58 15.18 11.18 12.2 17.76 35.54
Estate/Inheritance
Tax
Levied? No No No No No No No No No No
Recently
Legislated
Tax
Changes 0.17 -‐3.78 -‐0.37 -‐0.43 -‐0.24 -‐0.34 -‐0.3 2.34 0 0
Debt
Service
as
a
Share
of
Tax
Revenue 7.80% 2.70% 8.60% 7.50% 9.80% 5.40% 7.50% 2.50% 7.00% 10.70%
Public
Employees
Per
10,000 488.8 625.1 486.3 558 427.8 496 512.6 865.5 548.3 367.6
State
Liability
System
Survey 69.7 69.8 69 65.8 66.8 70.5 64 72.6 69.5 57
State
Minimum
Wage 7.25 7.25 7.25 7.25 8.05 7.25 7.25 7.25 8.5 8.25
Average
Workers’
Compensation
Costs 1.31 0.88 1.06 1.85 1.6 2.01 1.75 1.76 1.86 1.26
Right-‐to-‐Work
State? Yes Yes Yes Yes Yes Yes Yes Yes Yes Yes
Number
of
Tax
Expenditure
Limits 1 0 1 1 2 1 0 0 1 2
PA ME MO CA OE NJ CT MN VM NY
Top
Marginal
Personal
Income
Tax
Rate 6.99% 7.95% 6.90% 13.30% 10.62% 9.97% 6.70% 9.85% 8.95% 12.70%
Top
Marginal
Corporate
Income
Tax
Rate 17.03% 8.93% 6.75% 88.40% 11.25% 9.00% 9.00% 9.80% 8.50% 17.16%
Personal
Income
Tax
Progressivity 0 19.47 18.02 38.34 15.54 24.81 7.67 18.42 28.69 12.66
Property
Tax
Burden 29.98 45.5 36.26 29.72 33.69 54.07 44.8 31.75 50.32 46.19
Sales
Tax
Burden 17.25 20.38 0 23.6 0 16.92 17.98 20.44 12.83 24.21
Remaining
Tax
Burden 24.04 19.59 23.77 16.21 22.87 14.22 17.83 24.58 28.85 20.59
Estate/Inheritance
Tax
Levied? Yea Yes No No Yes Yes Yes Yes Yes Yes
Recently
Legislated
Tax
Changes 1.82 -‐0.17 -‐0.13 -‐0.47 0.88 -‐0.39 1.66 2.36 2.6 -‐1.48
Debt
Service
as
a
Share
of
Tax
Revenue 8.60% 6.00% 5.80% 10.50% 8.90% 6.60% 7.80% 7.50% 5.30% 9.40%
Public
Employees
Per
10,000 444.9 548 562 446.3 482.8 531.2 516.9 509.7 632.2 596.4
State
Liability
System
Survey 56.3 69.2 52.2 50.6 62.6 60.1 63.8 71.4 67.1 66.4
State
Minimum
Wage 7.25 7.5 8.05 9 9.25 8.38 9.15 8 9.15 8.75
Average
Workers’
Compensation
Costs 2 2.15 2.21 3.48 1.37 2.82 2.87 1.99 2.33 2.75
Right-‐to-‐Work
State? No No No No No No No No No No
Number
of
Tax
Expenditure
Limits 0 1 0 2 2 1 1 0 0 0
Top
10
States
for
Economic
Outlook
Rnakings
Bottom
10
States
for
Economic
Outlook
Rnakings