Download as PDF, PPTX


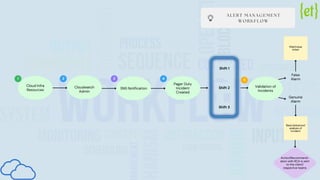
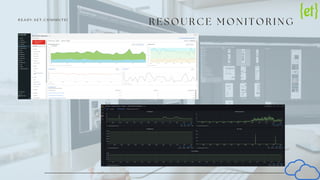
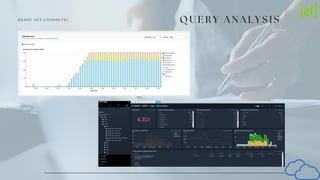


Euphoric provides comprehensive cloud monitoring solutions that ensure real-time visibility into files, applications, and users, while proactively identifying and resolving performance bottlenecks. Their client onboarding process includes gathering information and establishing communication channels, and they offer continuous monitoring, incident management, and automated handling of incidents. With a focus on service level agreements, 24/7 operational support, and detailed reporting, Euphoric aims to enhance cloud security and optimize infrastructure utilization.