Download as PDF, PPTX

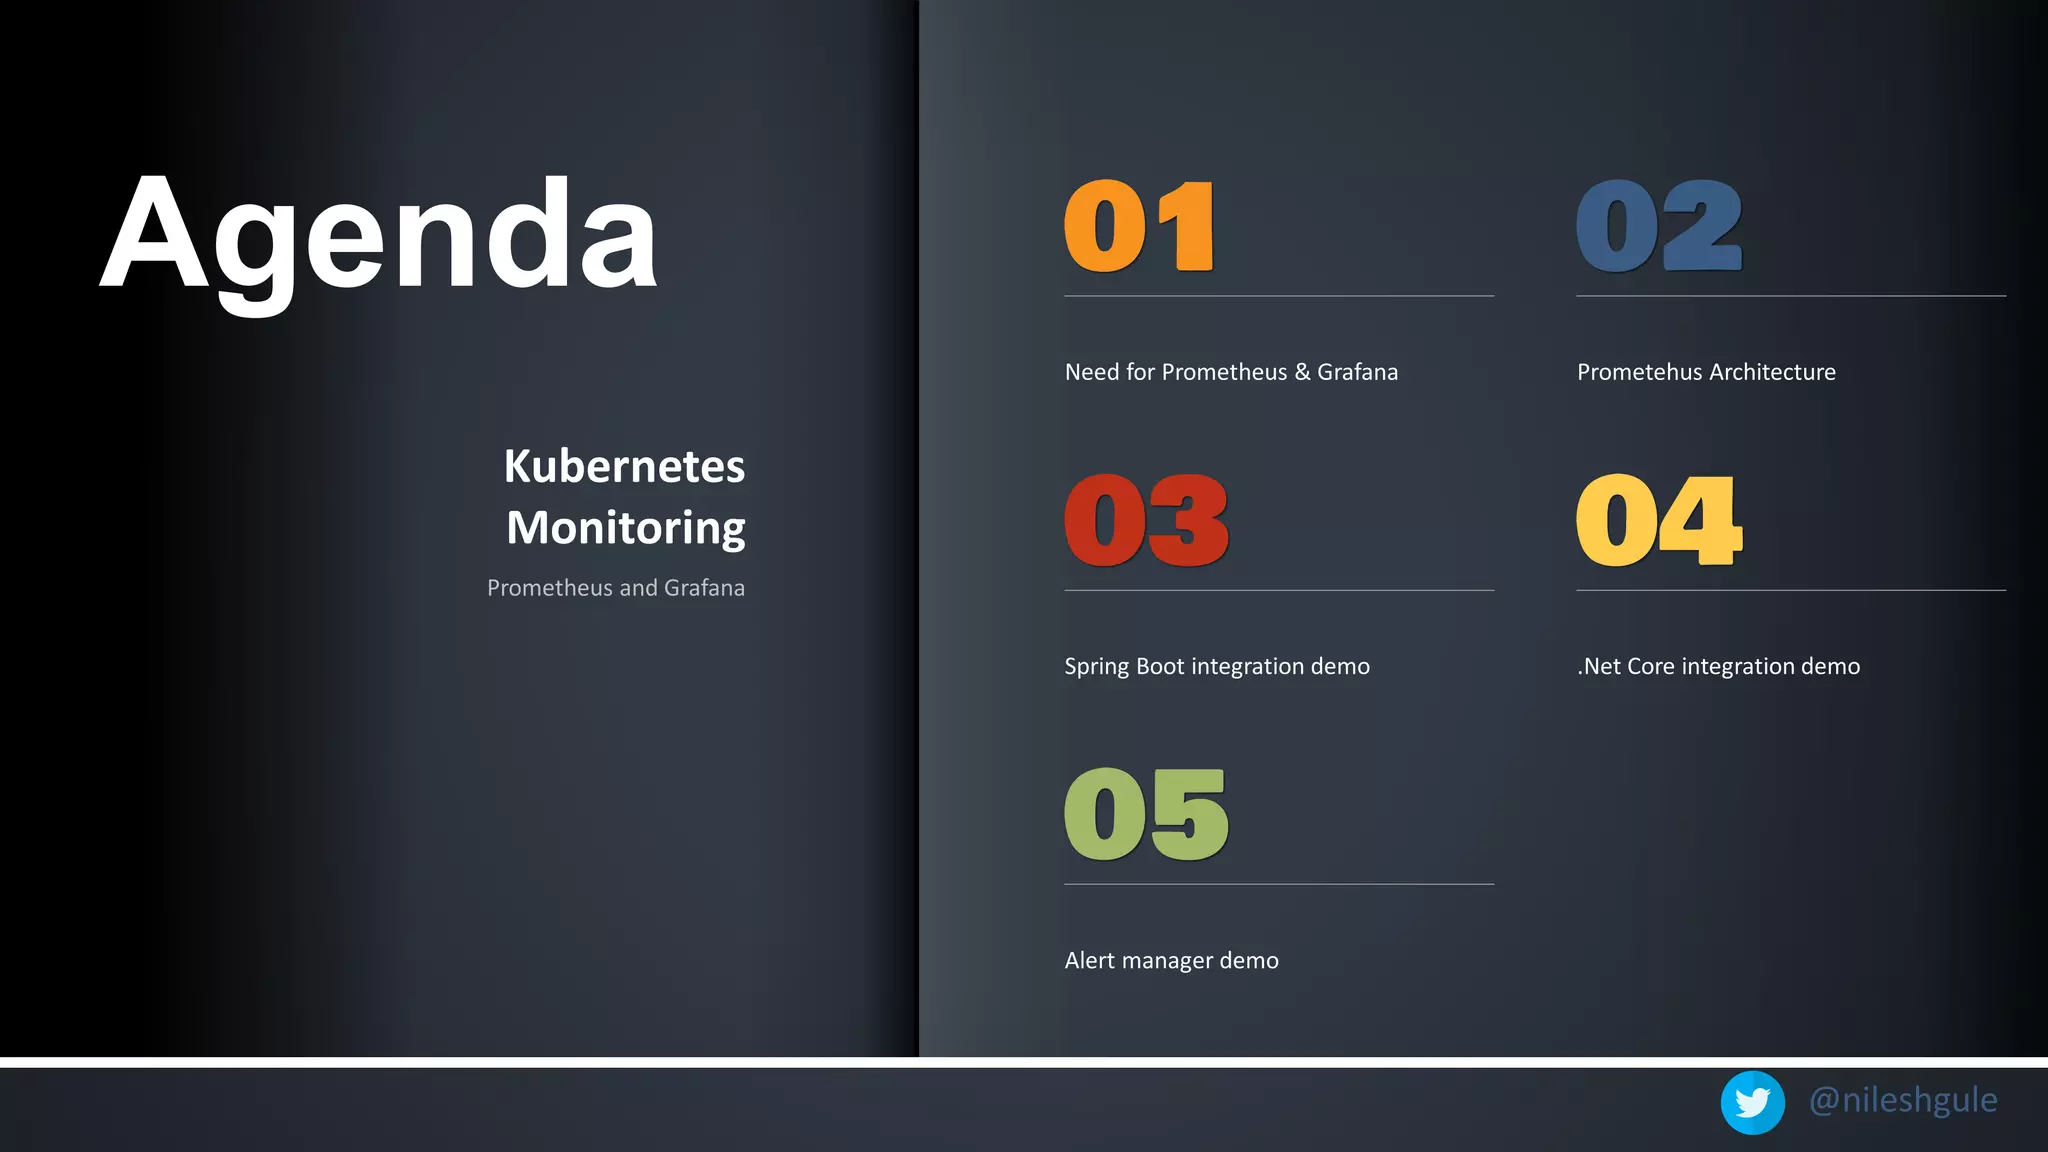

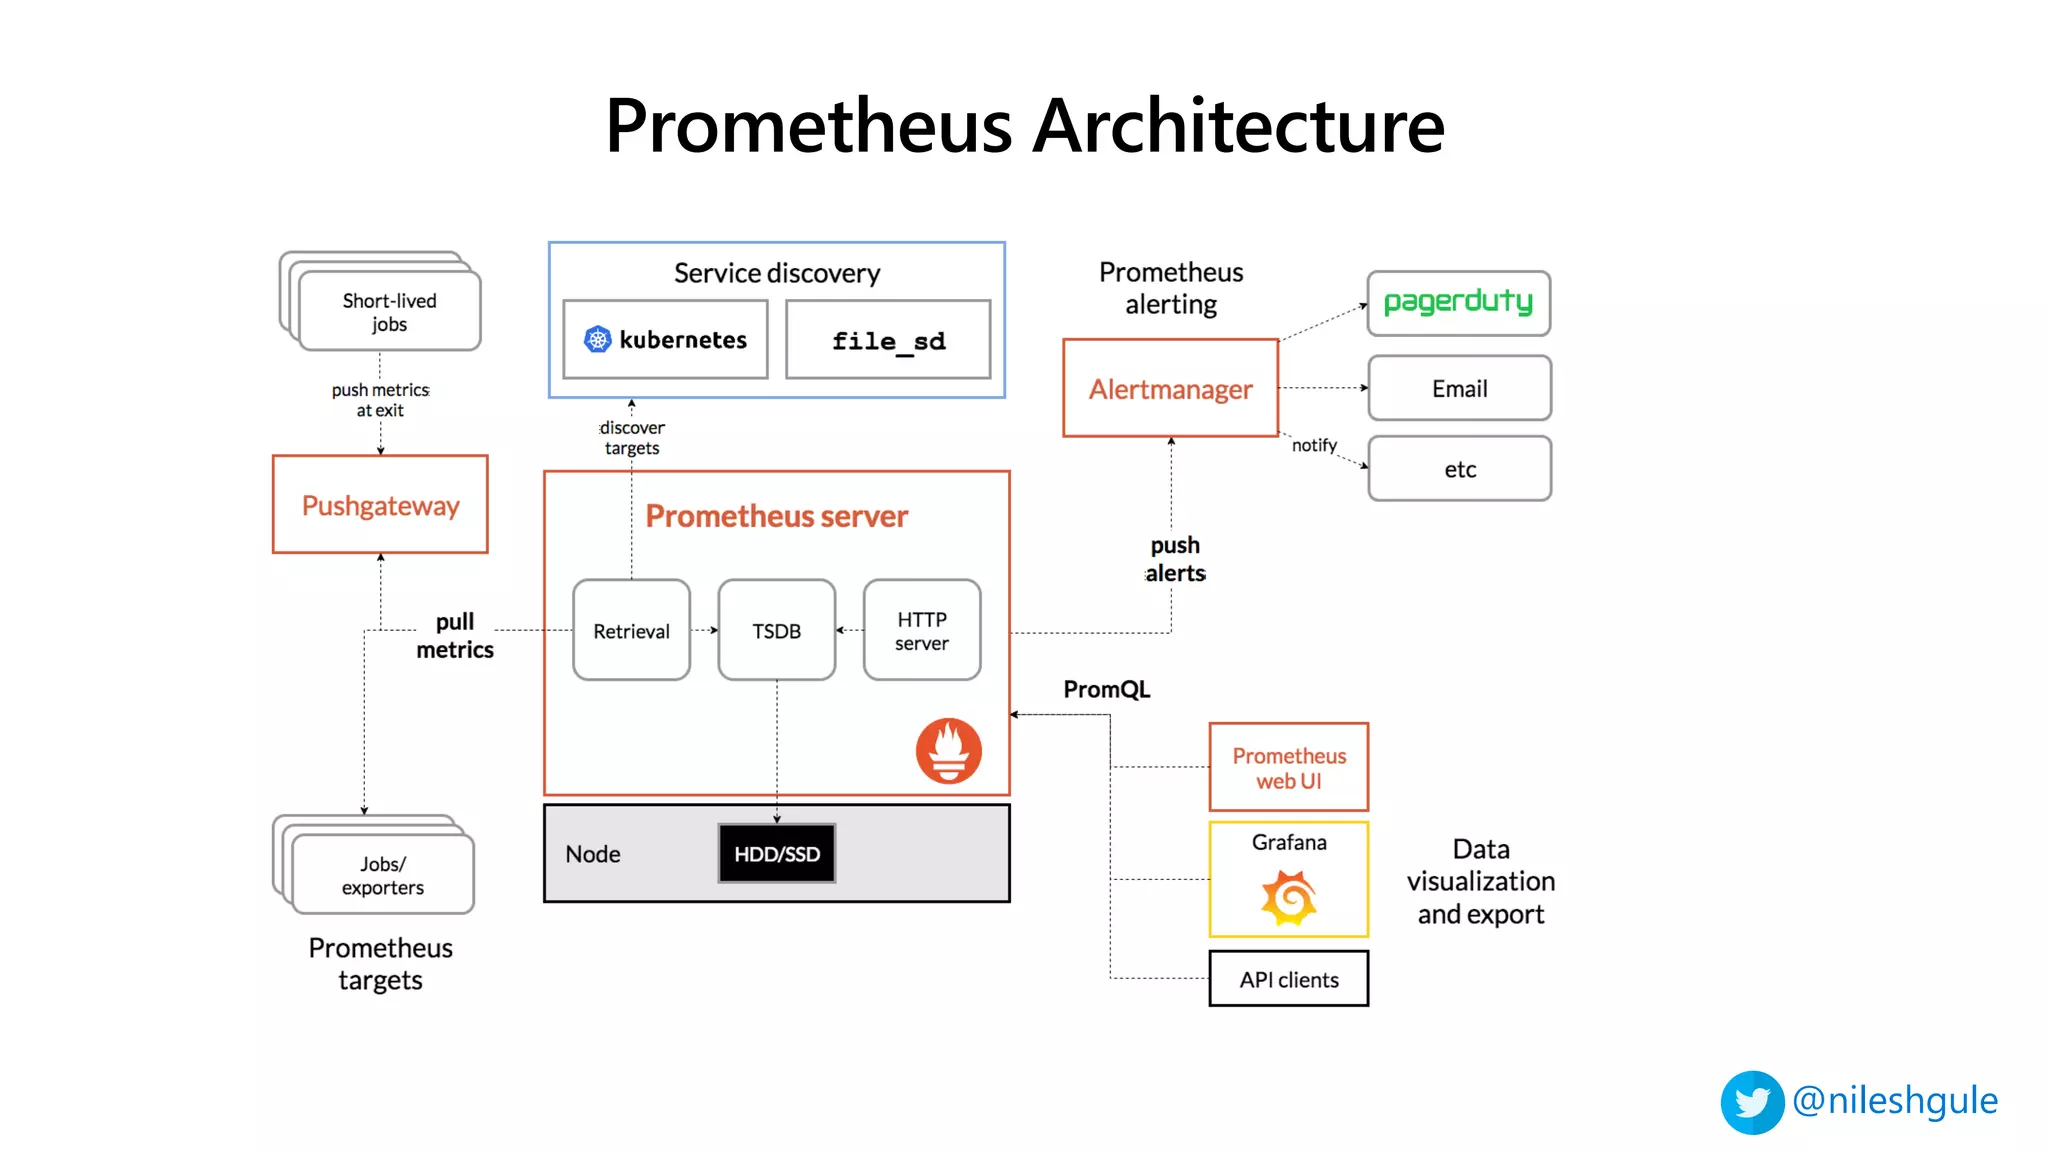
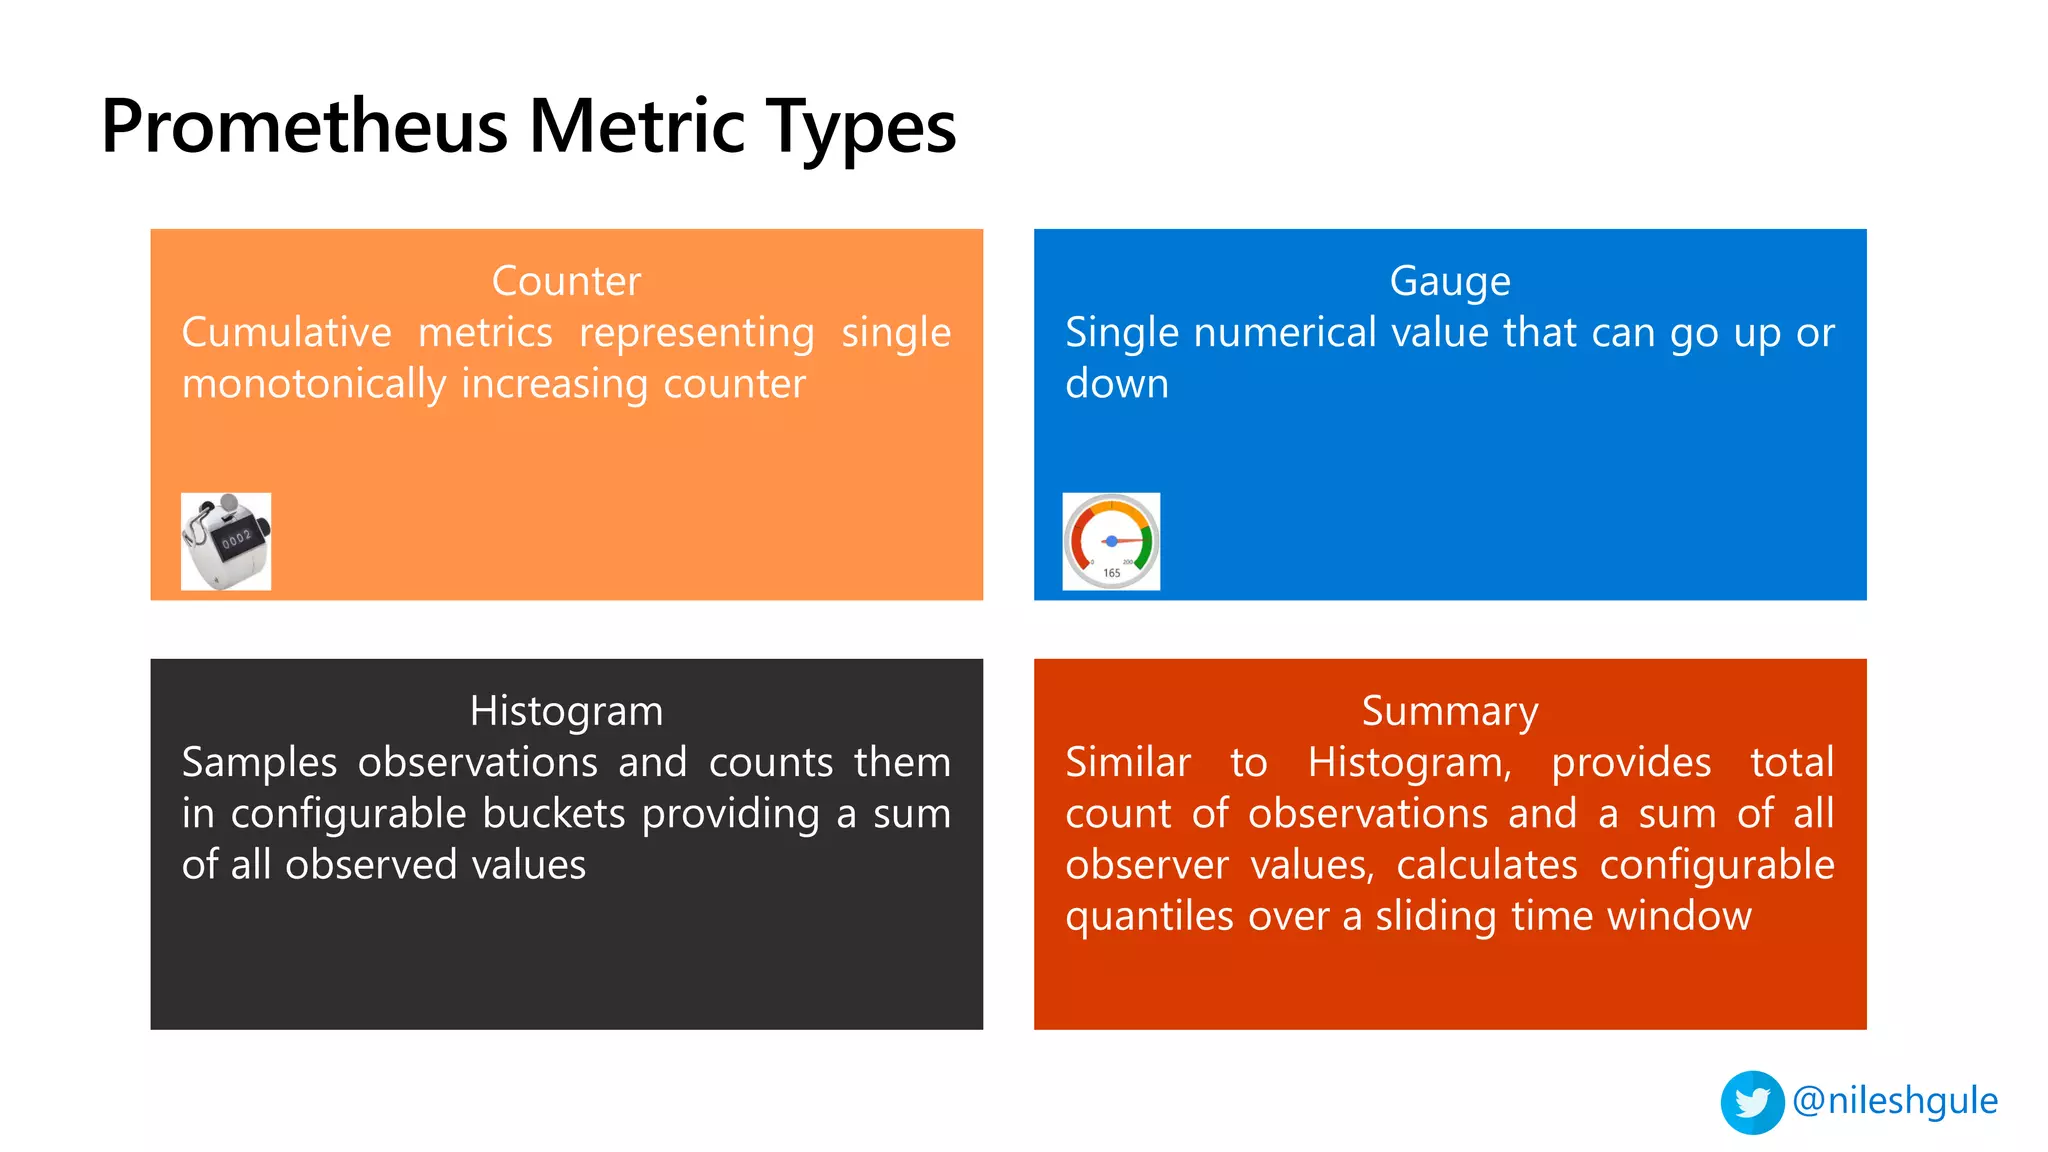
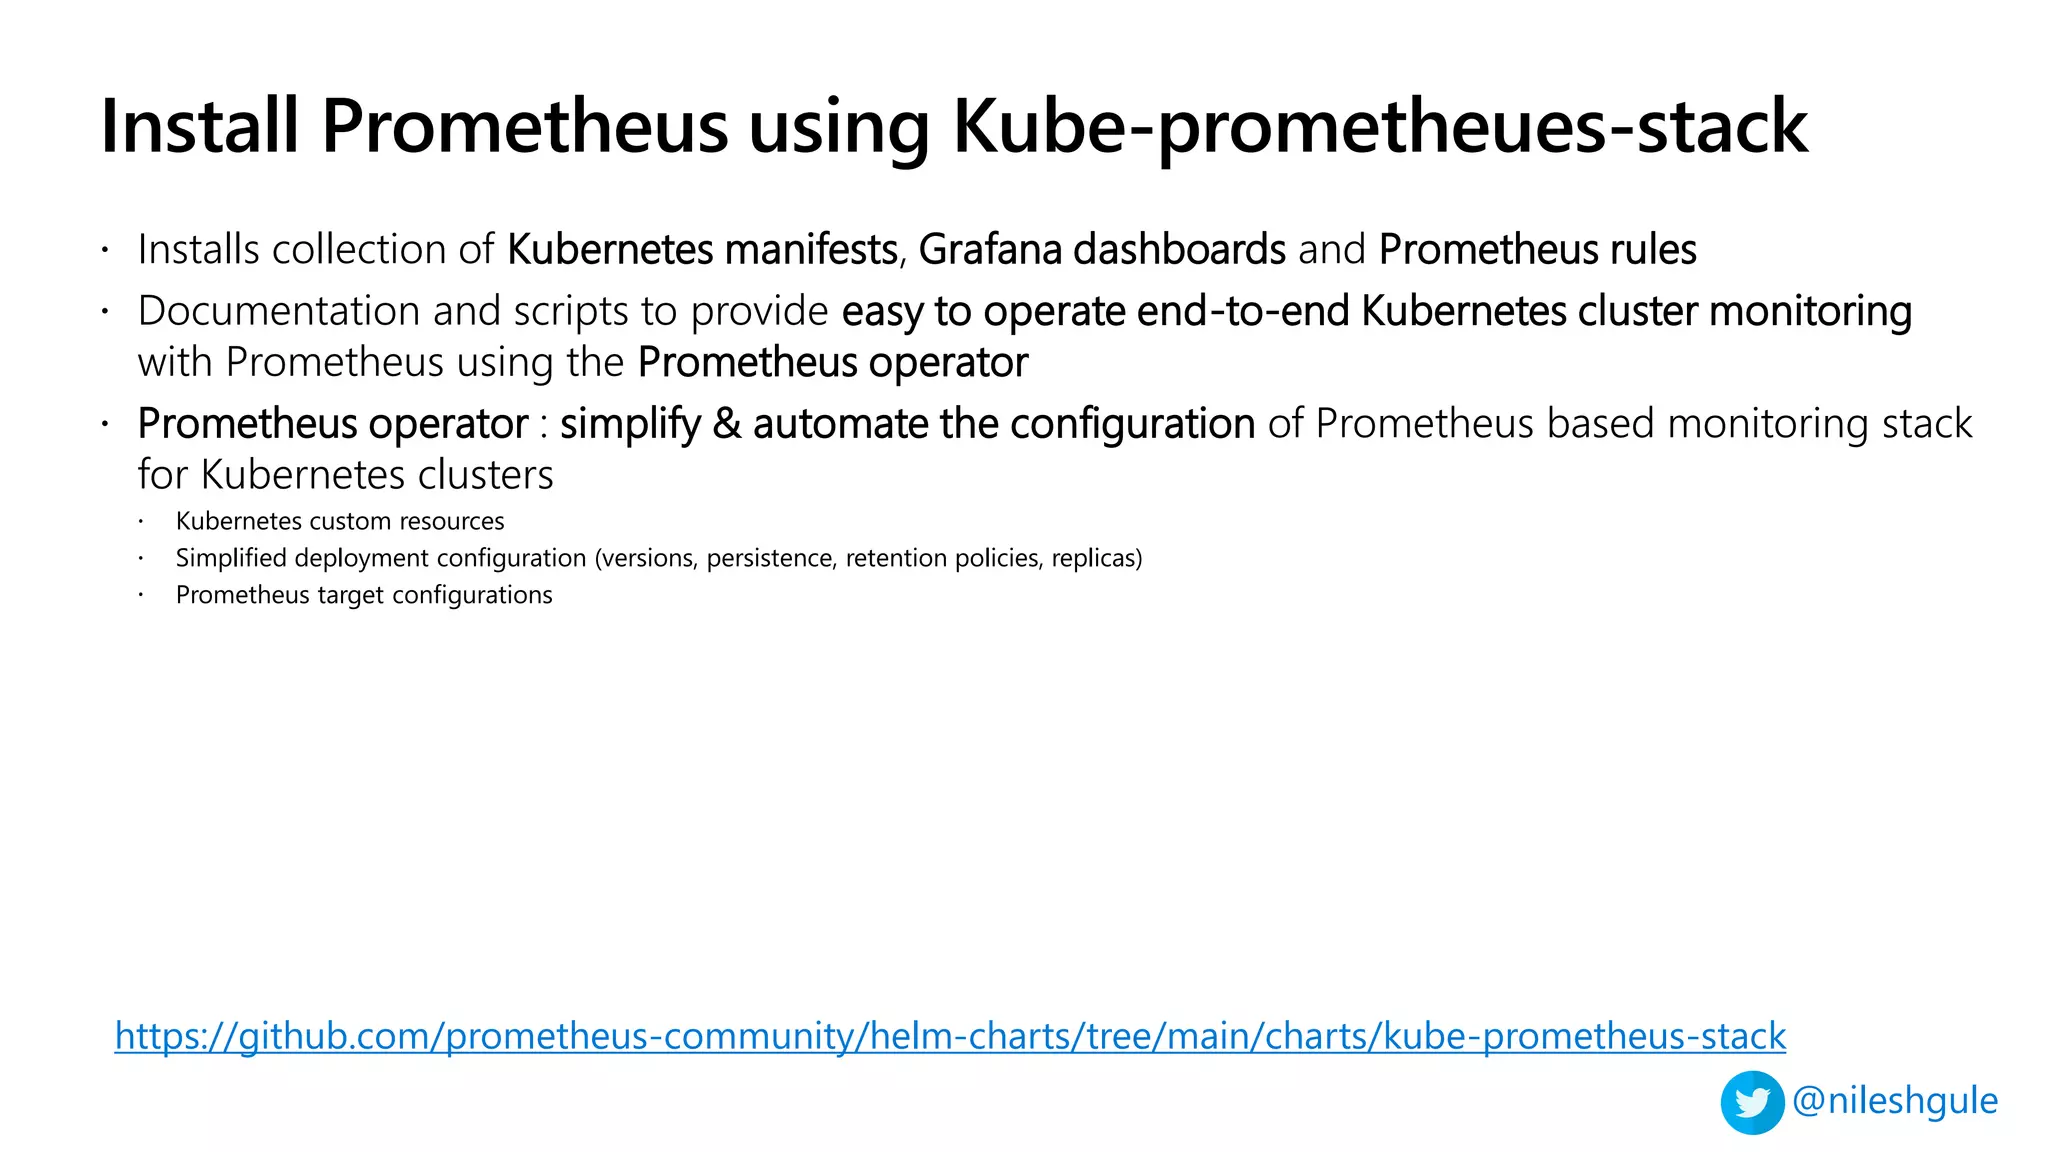
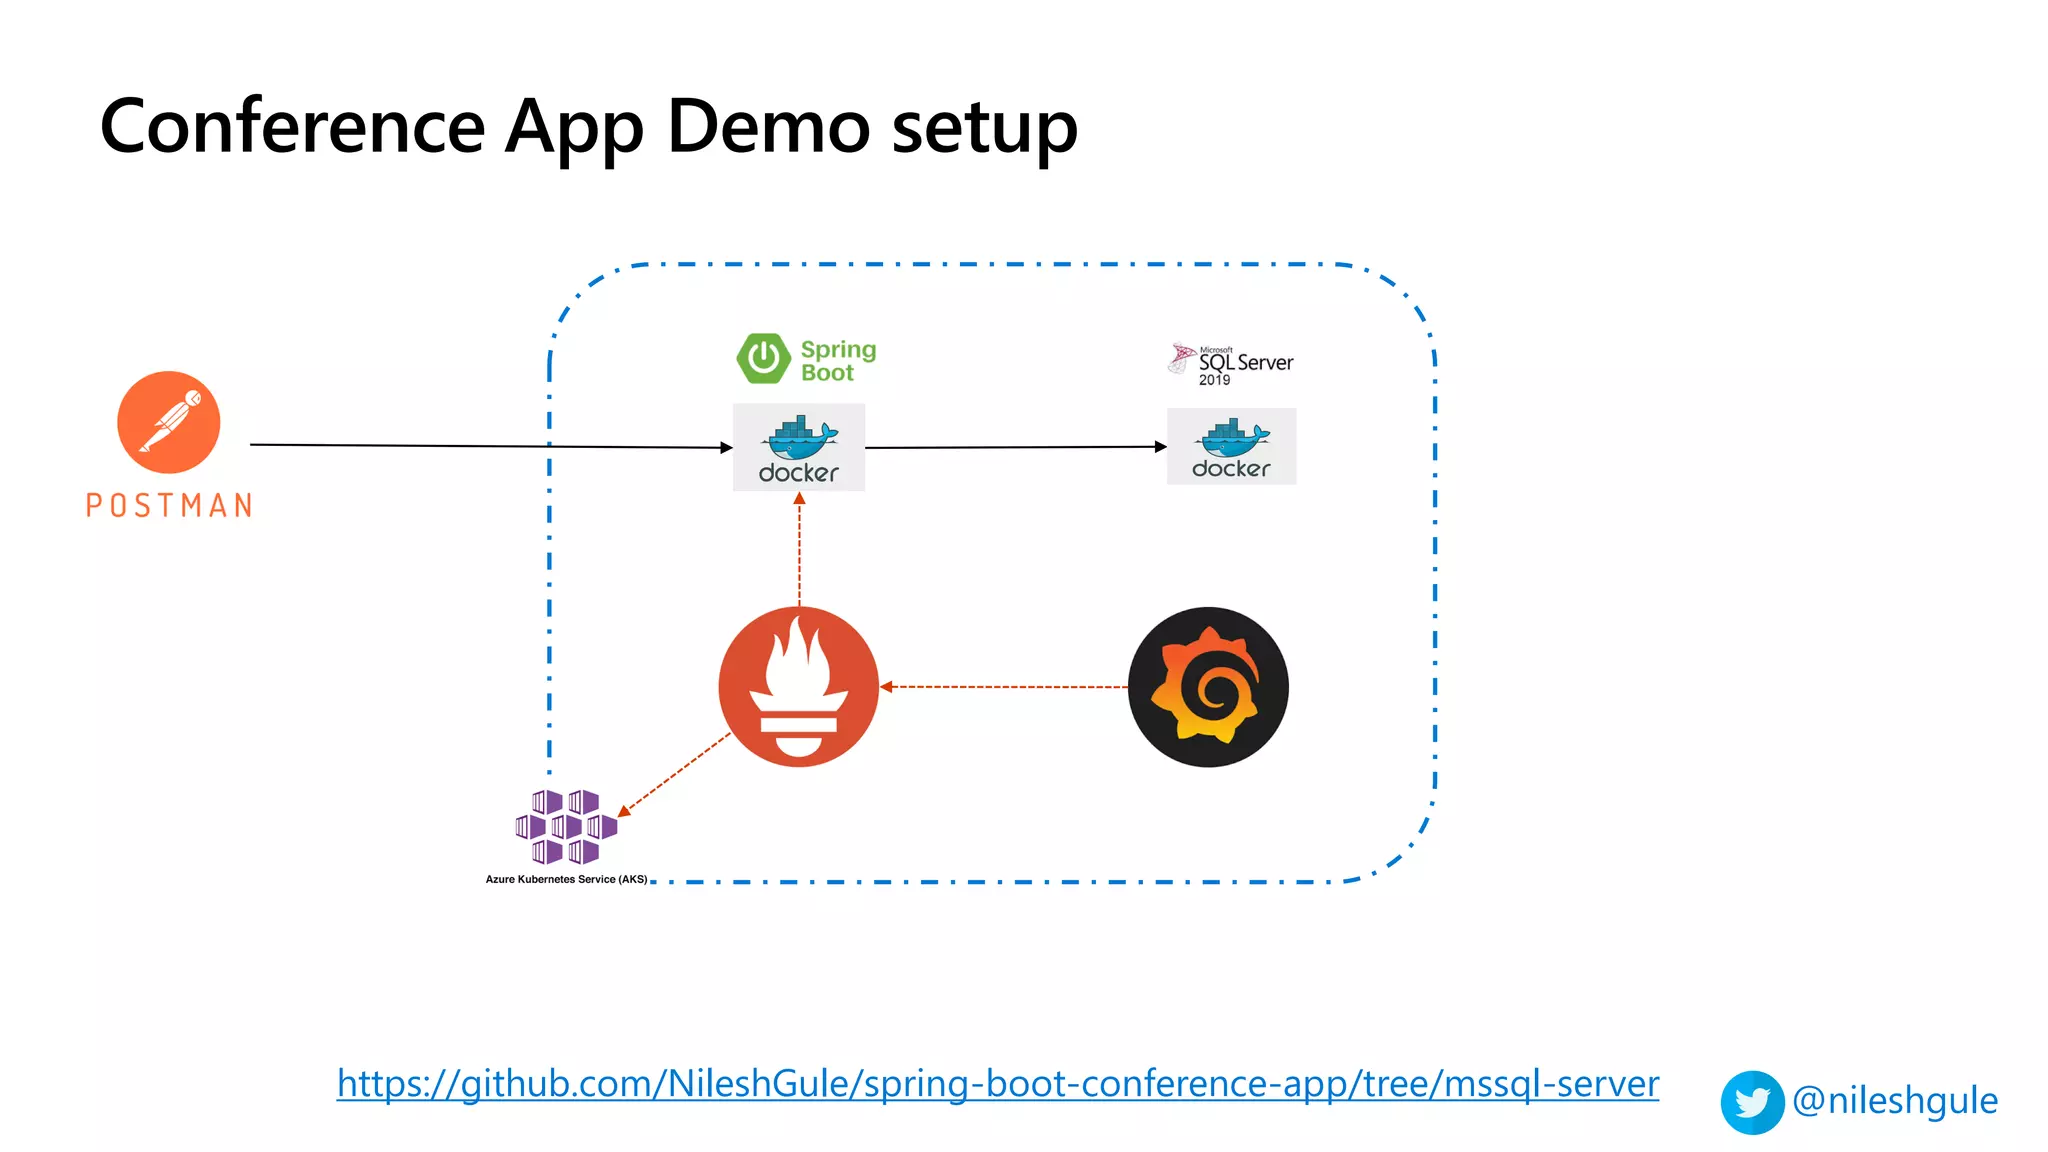
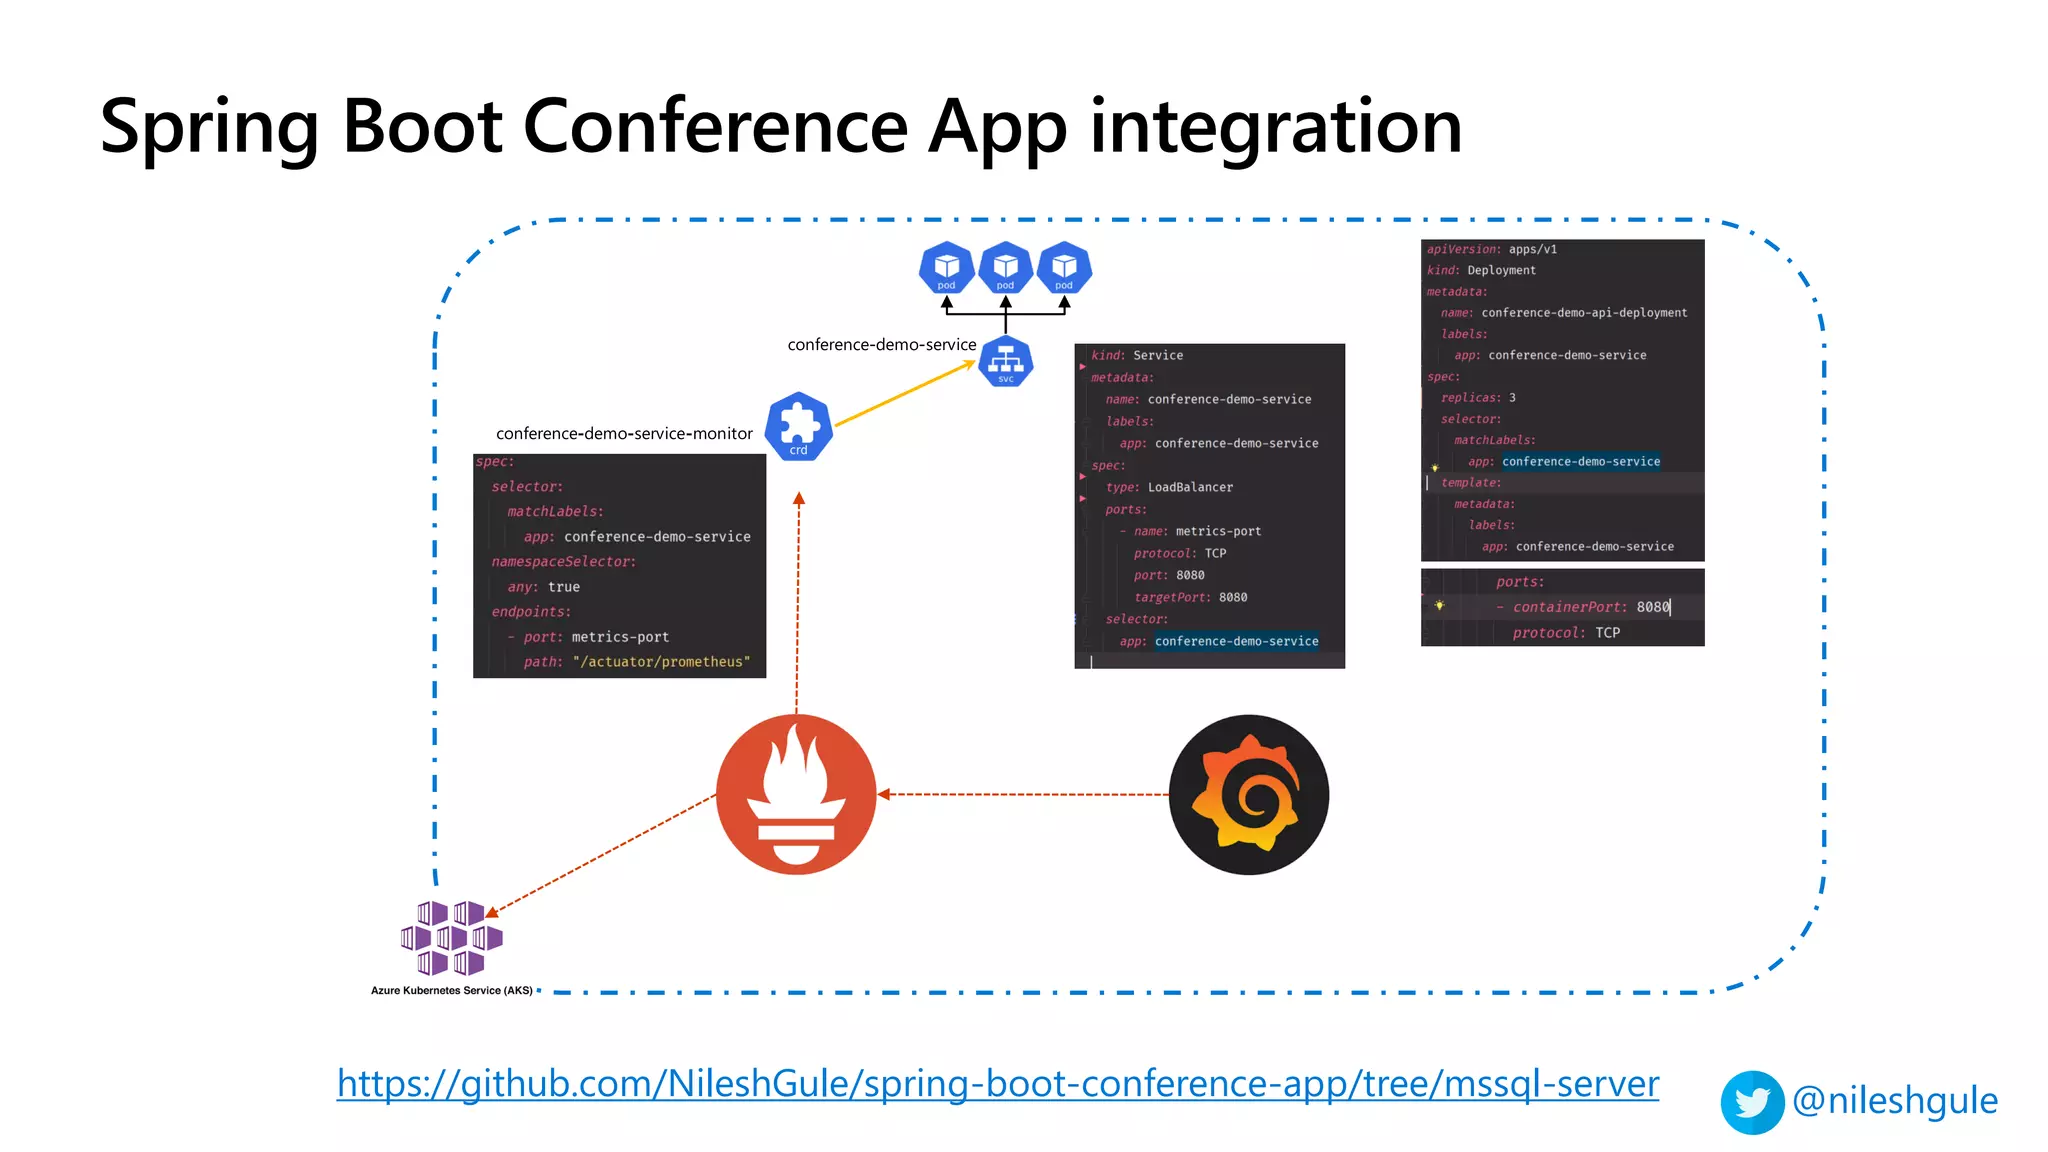
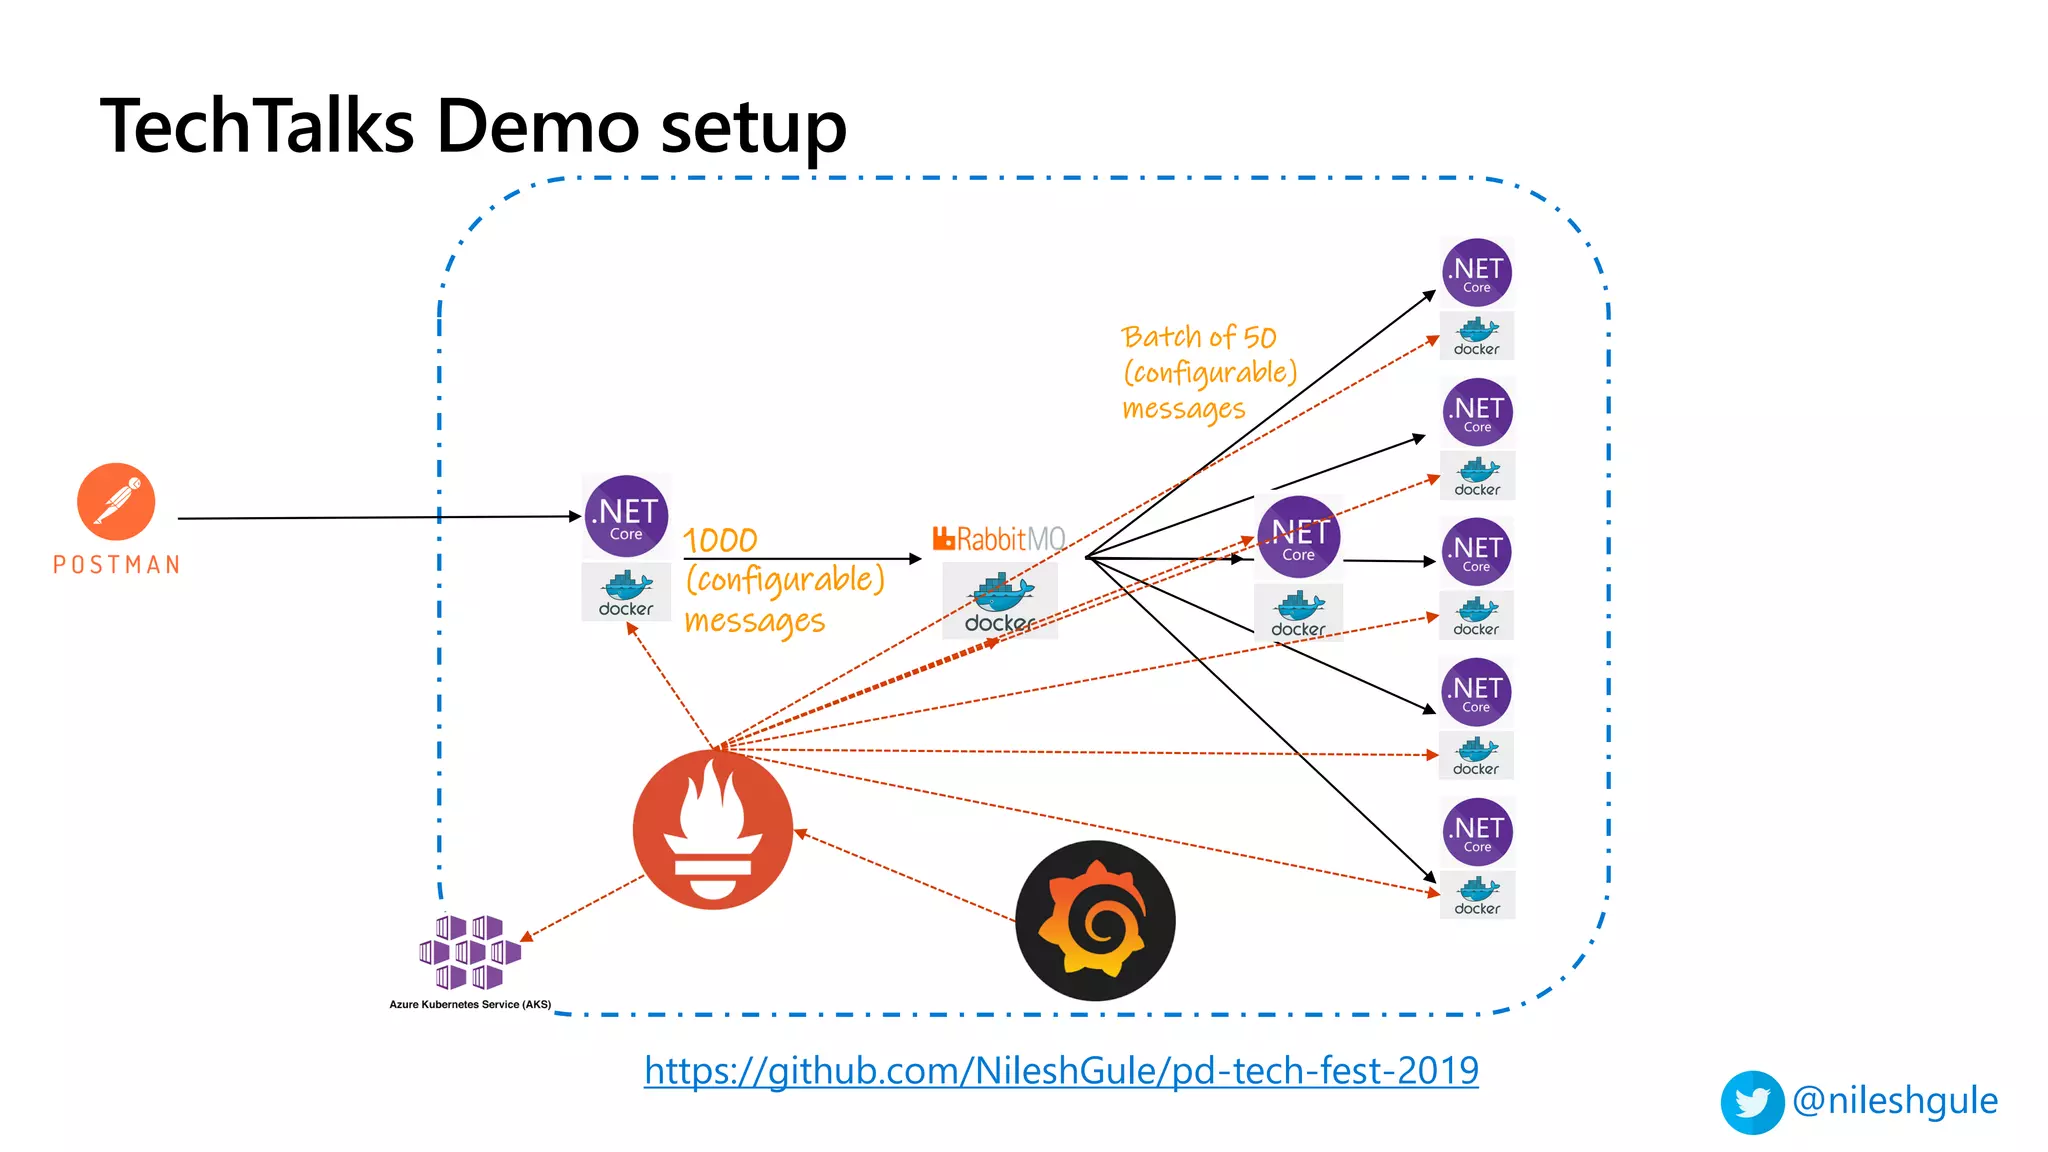
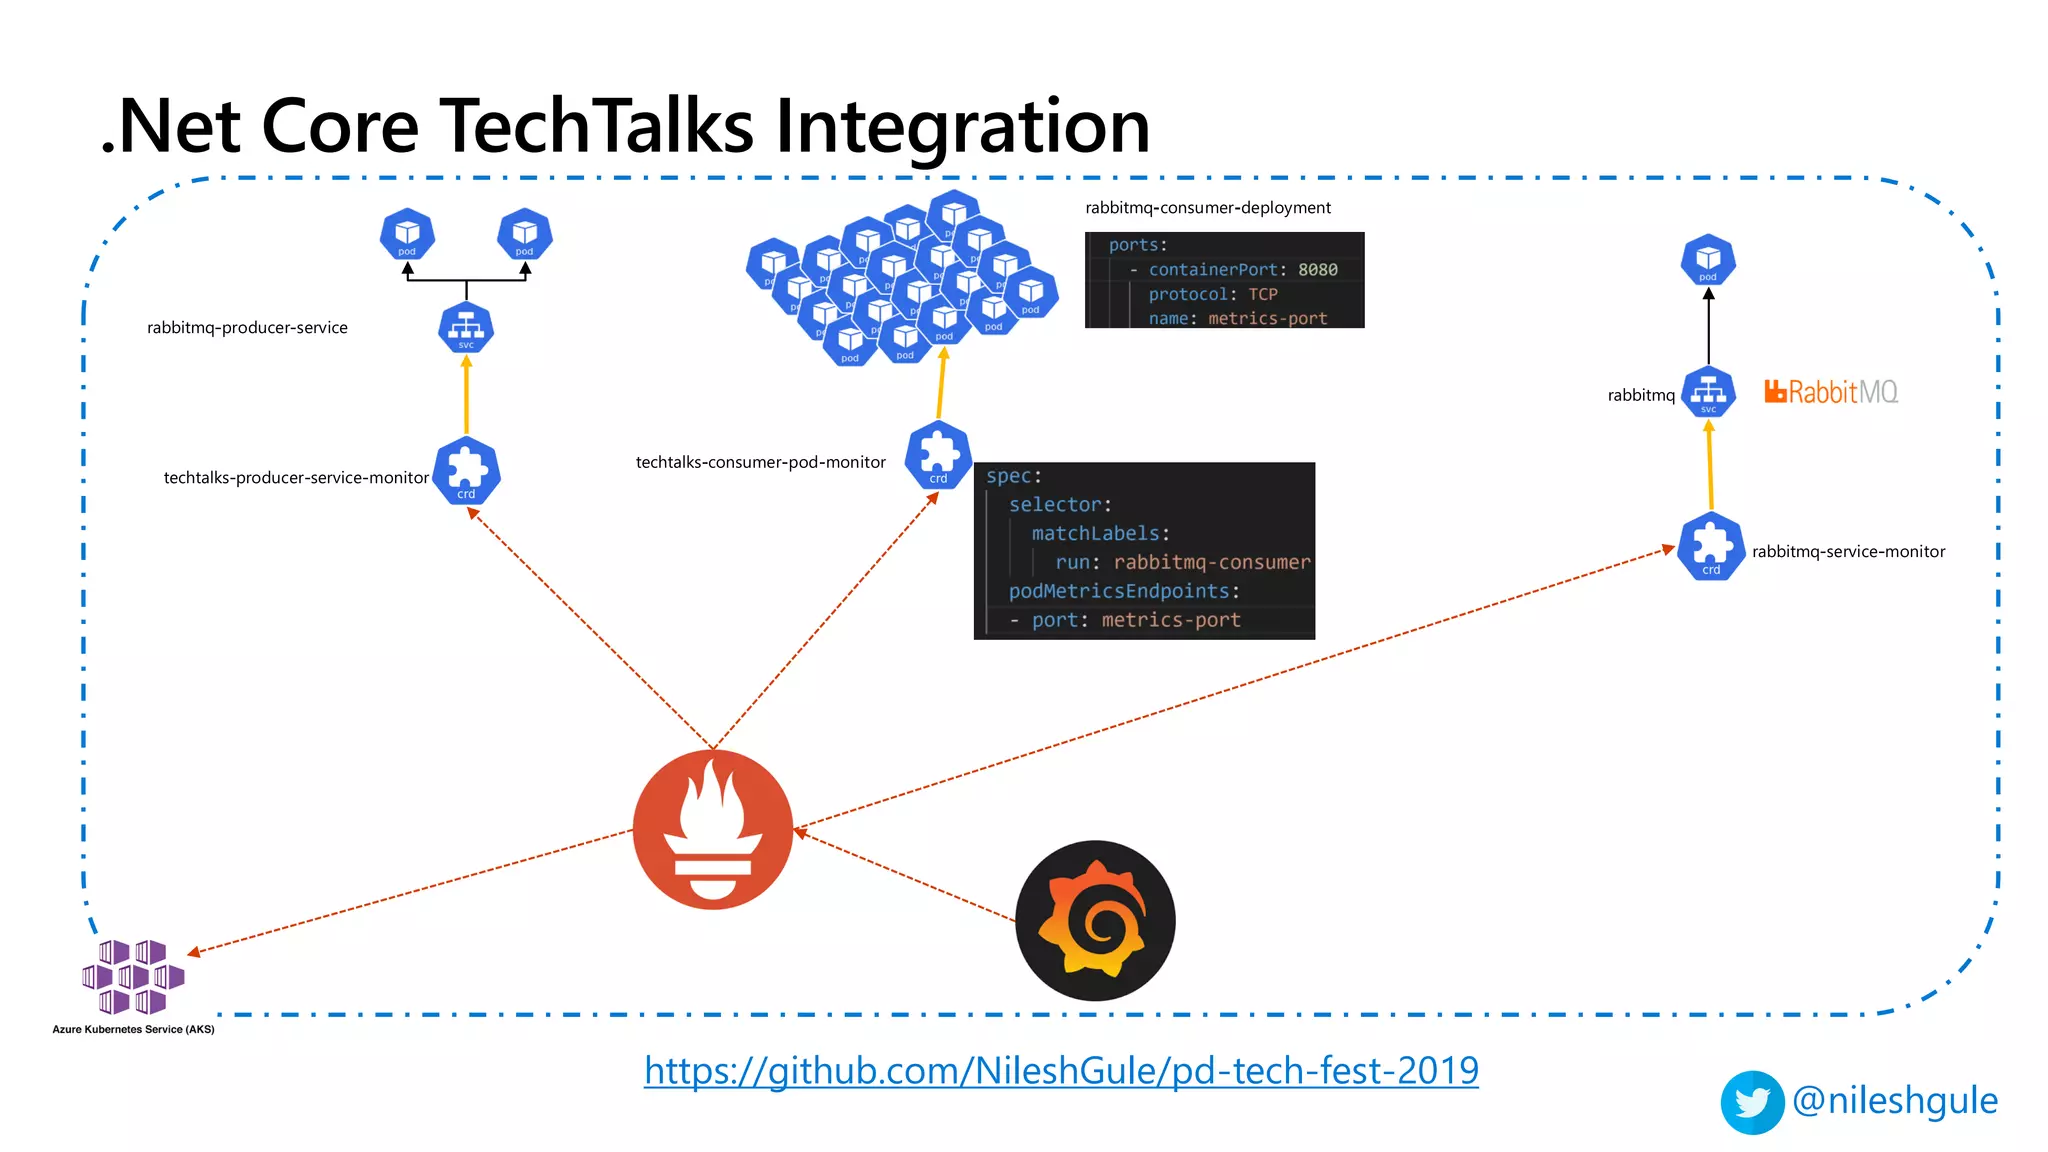
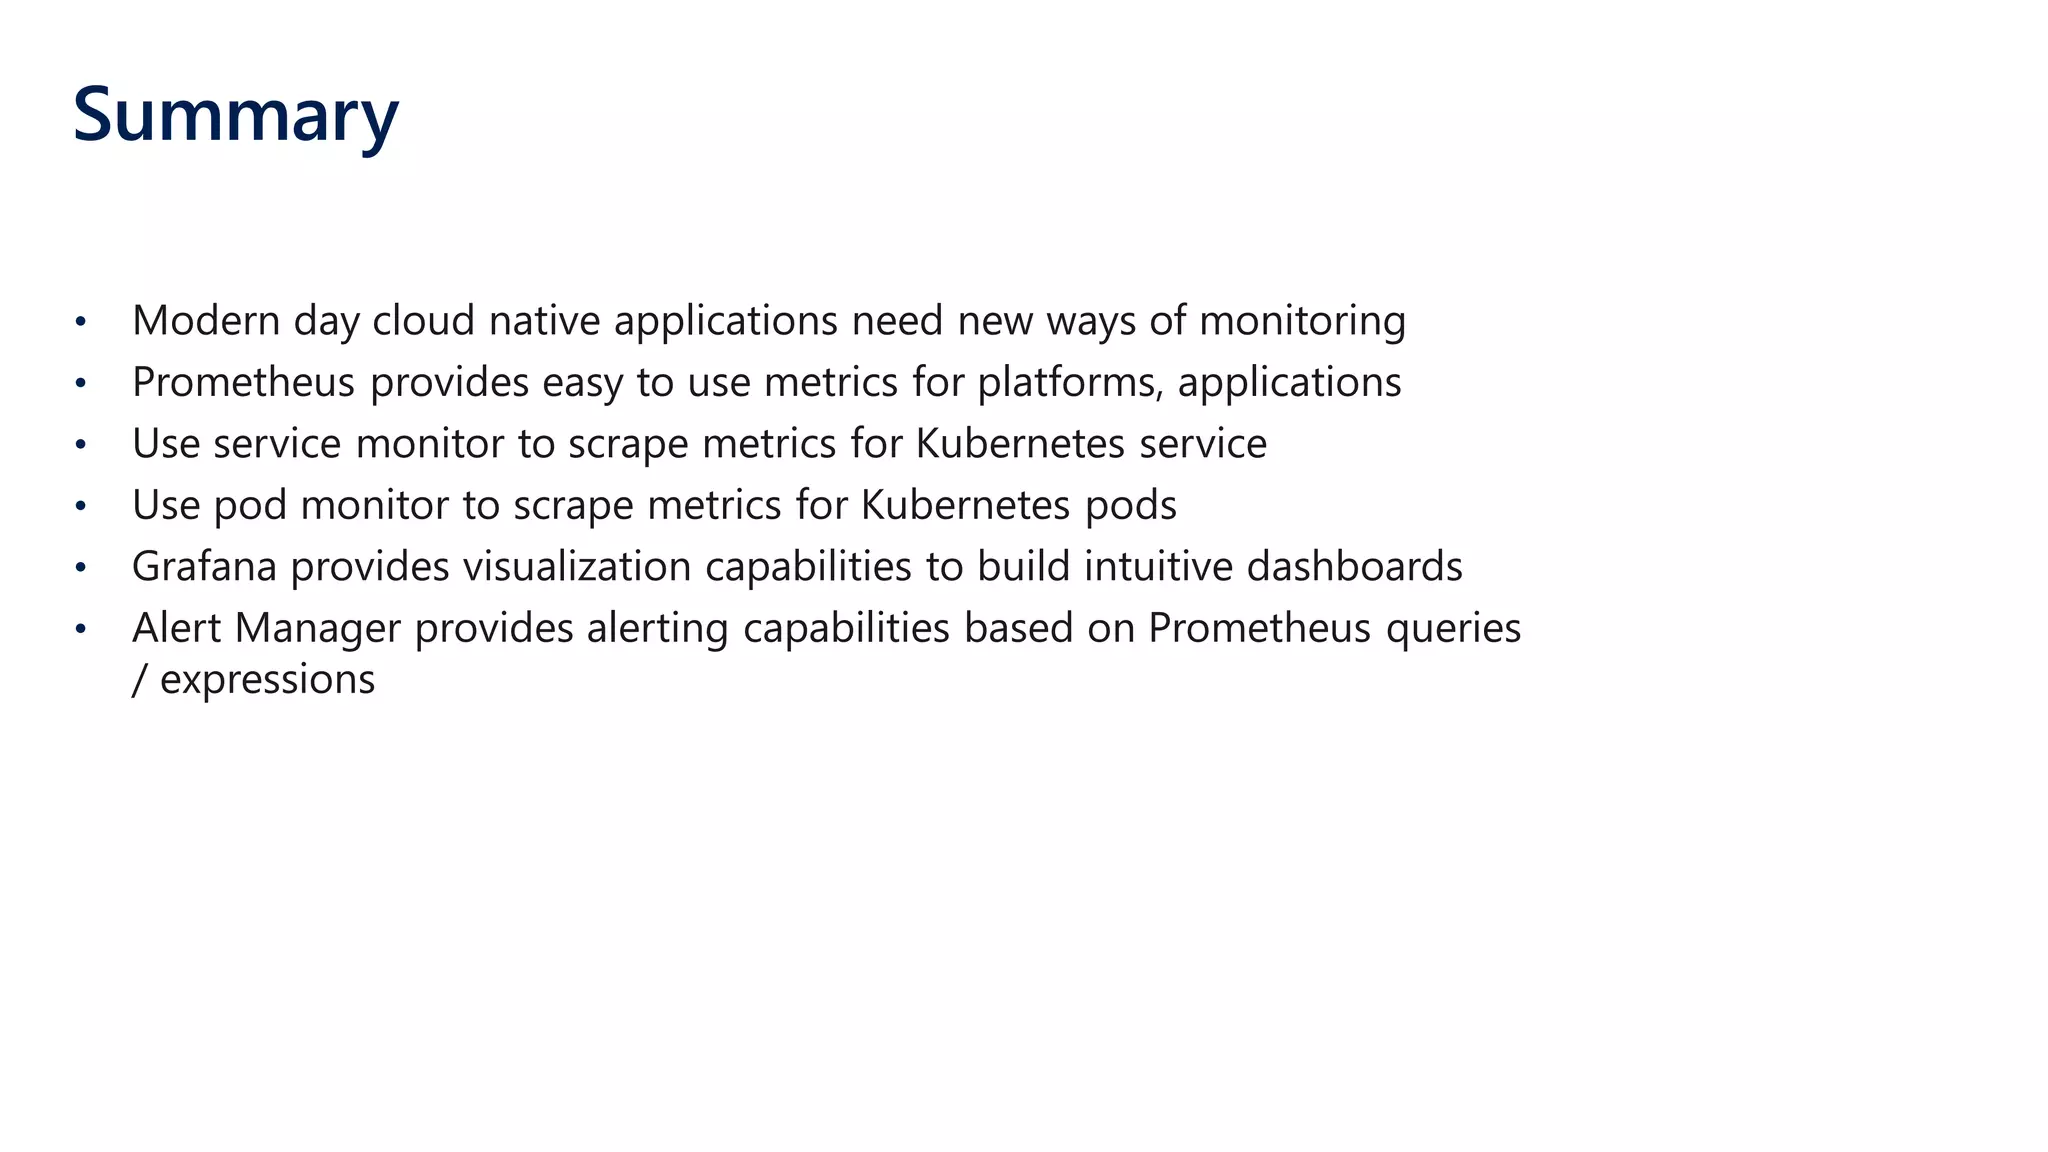


The document discusses Kubernetes monitoring using Prometheus and Grafana, highlighting the need for effective monitoring in cloud-native applications. It provides an overview of Prometheus architecture, integration demos with Spring Boot and .NET Core, and emphasizes the importance of metrics collection and visualization. Additionally, it addresses the installation of Prometheus through the kube-prometheus-stack and the use of service and pod monitors for scraping metrics.