Downloaded 10 times


![I’m looking at you, KOPS!
scrape_configs+: [
k8s_pod_scrape("kube-system/kube-apiserver", 443) {
scheme: "https",
},
k8s_pod_scrape("kube-system/kube-scheduler", 10251),
k8s_pod_scrape("kube-system/kube-controller-manager", 10252),
// kops doesn't configure kube-proxy to listen on non-localhost,
// can't scrape.
// k8s_pod_scrape("kube-system/kube-proxy", 10249),
// kops firewalls etcd on masters off from nodes, so we
// can't scrape it with Prometheus.
// k8s_pod_scrape("kube-system/etcd-server", 4001),
// k8s_pod_scrape("kube-system/etcd-server-events", 4002),
],](https://image.slidesharecdn.com/monitoringmixins-180221091249/75/Prometheus-Monitoring-Mixins-Berlin-CNCB-Meetup-7-2048.jpg)

![Jsonnet Primer
{ a: 1, b: 2 } +
{ b: 22, c: 3 } +
{ d:: self.a + 10 } +
{ list: [{s: “%(var)s}] } +
{ list+: [{ e: $.d }]} %
{ var: “foo” }
= { a: 1, b: 22, c: 3, list: [{ s: “foo” }, { e: 11}] }](https://image.slidesharecdn.com/monitoringmixins-180221091249/75/Prometheus-Monitoring-Mixins-Berlin-CNCB-Meetup-13-2048.jpg)
![Jsonnet Primer
// Default/Base config
{ a: 1, b: 2 } +
// Override some values
{ b: 22, c: 3 } +
// Calculate local fields
{ d:: self.a + 10 } +
// Base rules
{ list: [{s: “%(var)s}] } +
// Add custom rules
{ list+: [{ e: $.d }]} %
// Set variables
{ var: “foo” }
= { a: 1, b: 22, c: 3, list: [{ s: “foo” }, { e: 11}] }](https://image.slidesharecdn.com/monitoringmixins-180221091249/75/Prometheus-Monitoring-Mixins-Berlin-CNCB-Meetup-14-2048.jpg)
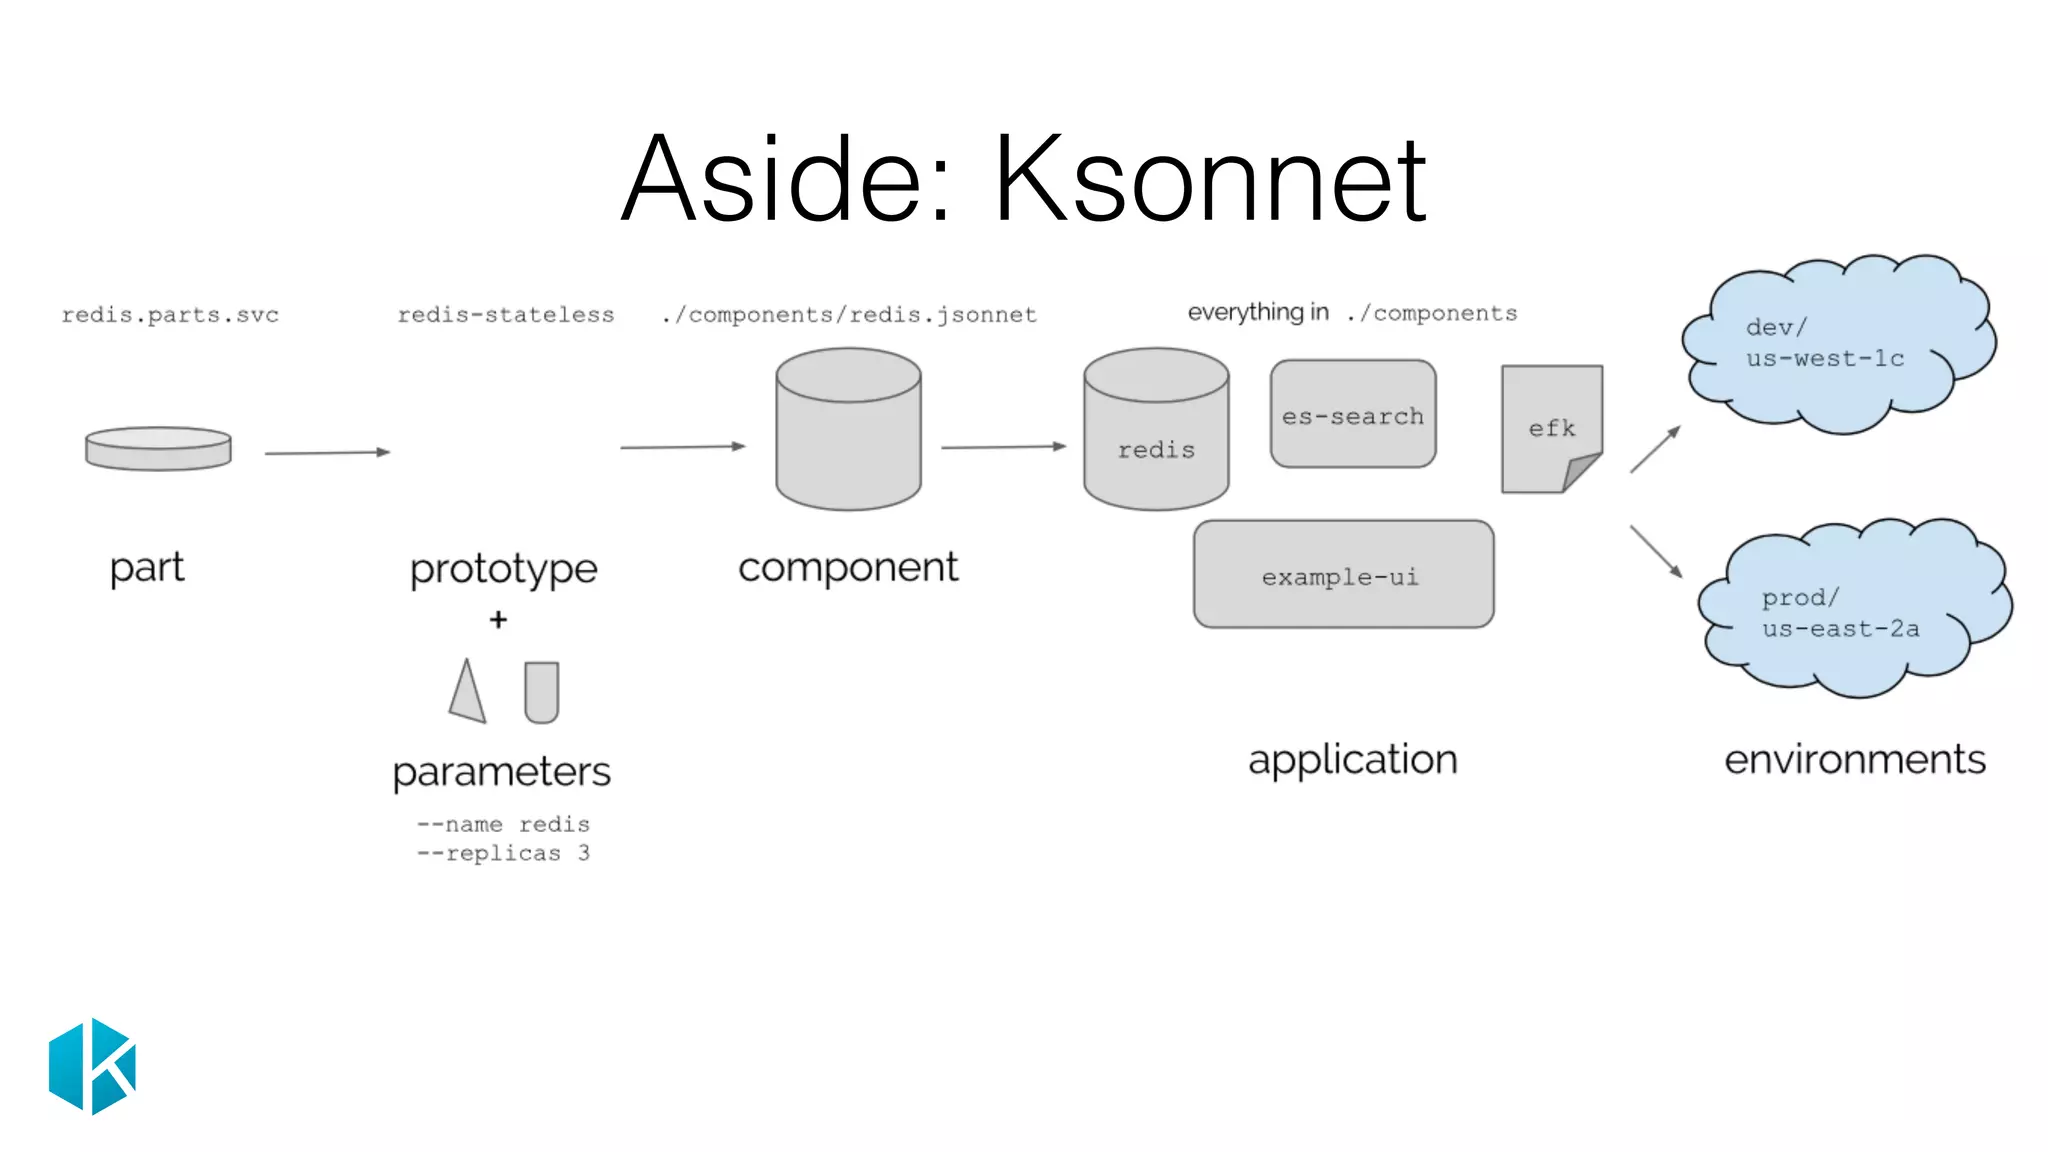
![Aside: Ksonnet K8s Primitives
local container = $.core.v1.container,
node_exporter_container::
container.new("node-exporter", $._images.nodeExporter) +
container.withPorts($.core.v1.containerPort.new("http-metrics", 9100)) +
container.withArgs([
"--path.procfs=/host/proc",
"--path.sysfs=/host/sys",
"--collector.filesystem.ignored-mount-points=^/(sys|proc|dev|host|etc)($|/)",
]),
local daemonSet = $.extensions.v1beta1.daemonSet,
node_exporter_deamonset:
daemonSet.new("node-exporter", [$.node_exporter_container]) +
$.util.hostVolumeMount("proc", "/proc", "/host/proc") +
$.util.hostVolumeMount("sys", "/sys", "/host/sys") +
$.util.hostVolumeMount("root", "/", "/rootfs"),](https://image.slidesharecdn.com/monitoringmixins-180221091249/75/Prometheus-Monitoring-Mixins-Berlin-CNCB-Meetup-17-2048.jpg)
![Configurable Grafana Configs
"k8s-resources-namespace.json":
local tableStyles = {
pod: {
alias: "Pod",
link: "%s/dashboard/file/k8s-resources-pod.json?var-datasource=$datasource&var-
namespace=$namespace&var-pod=$__cell" % $._config.grafanaPrefix,
},
};
g.dashboard("K8s / Compute Resources / Namespace")
.addTemplate("namespace", "kube_pod_info", "namespace")
.addRow(
g.row("CPU Usage")
.addPanel(
g.panel("CPU Usage") +
g.queryPanel('sum(irate(container_cpu_usage_seconds_total{namespace="$namespace"}[1m]))
by (pod_name)', "{{pod_name}}") +
g.stack,
)
)](https://image.slidesharecdn.com/monitoringmixins-180221091249/75/Prometheus-Monitoring-Mixins-Berlin-CNCB-Meetup-19-2048.jpg)
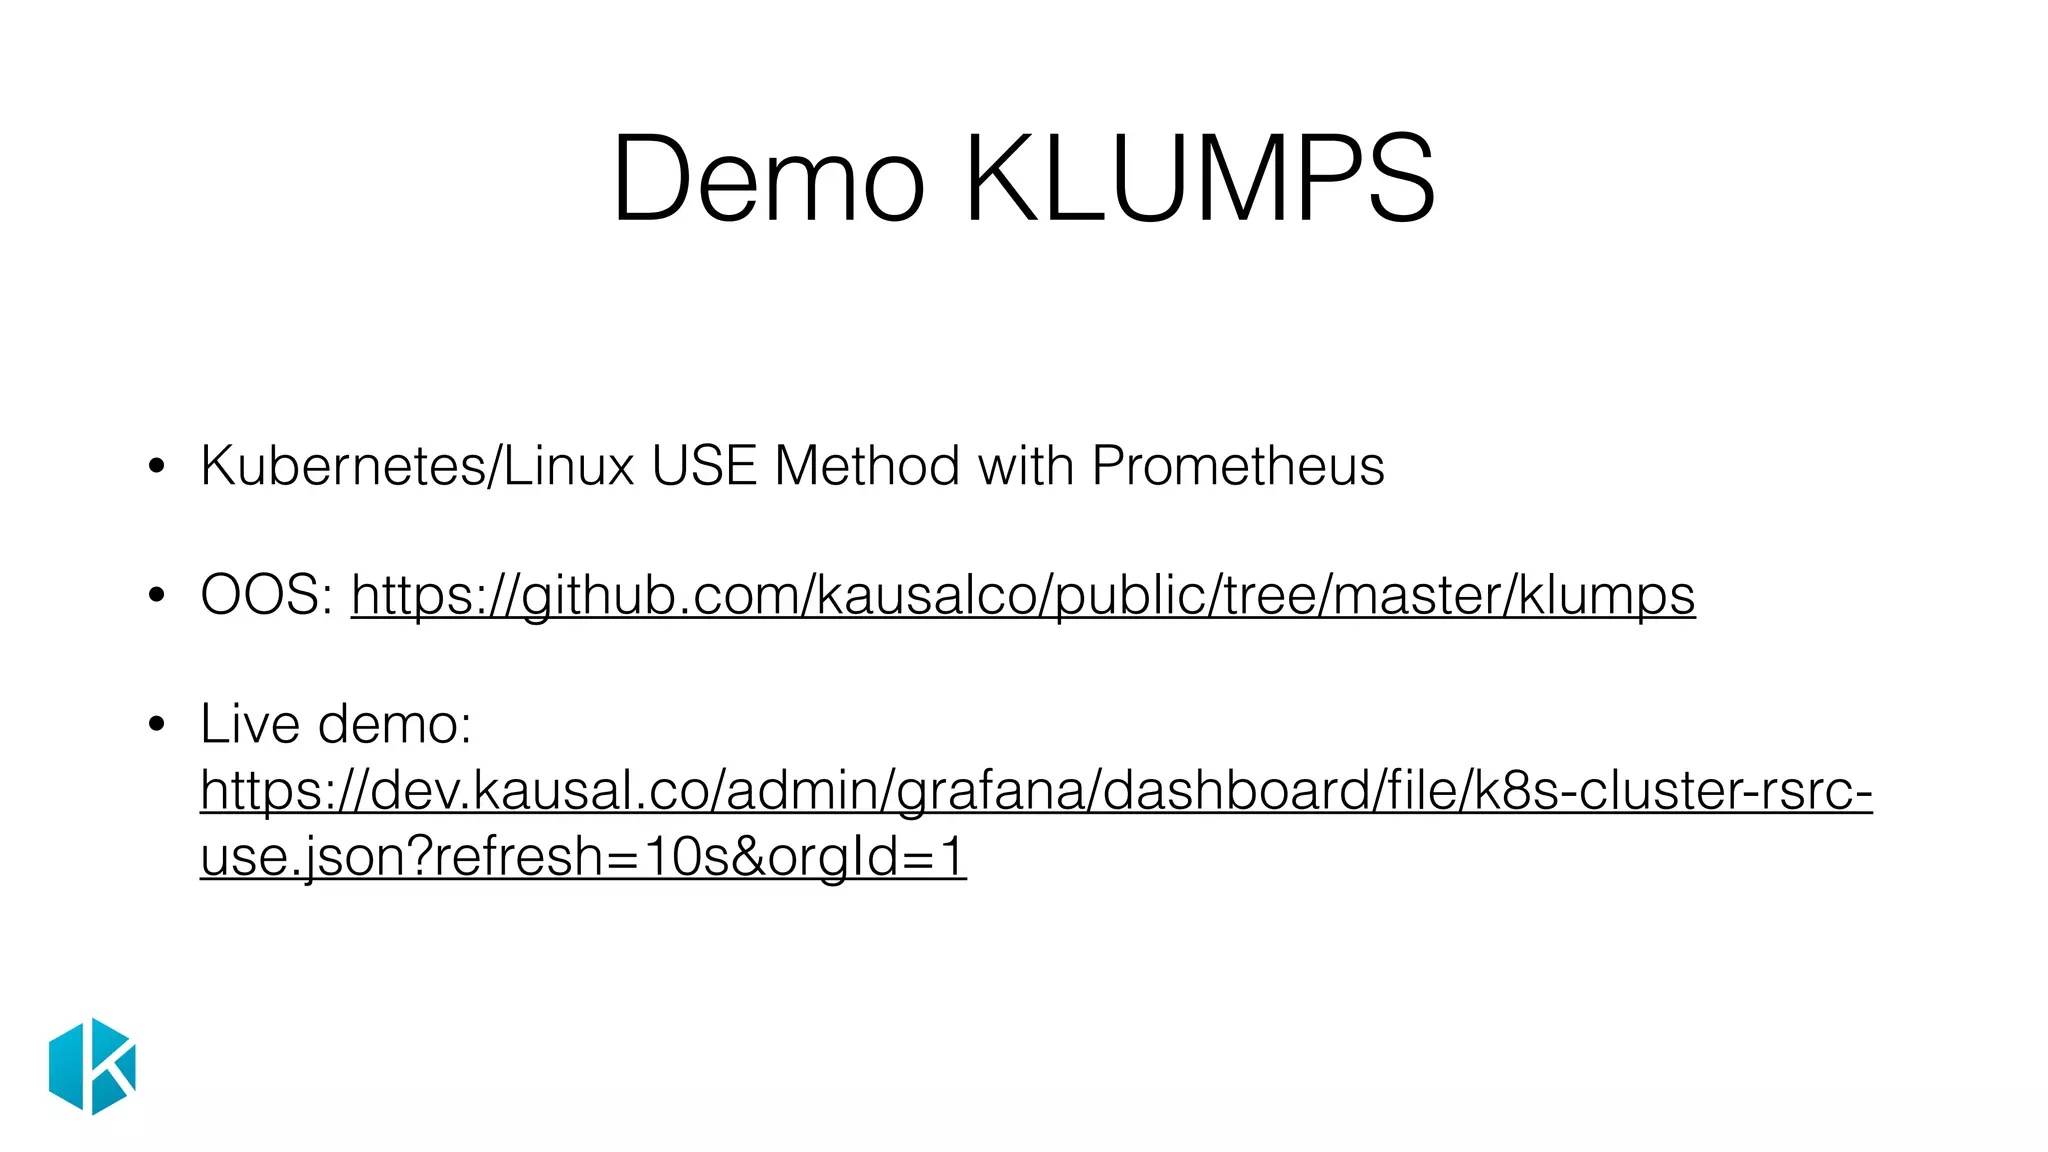
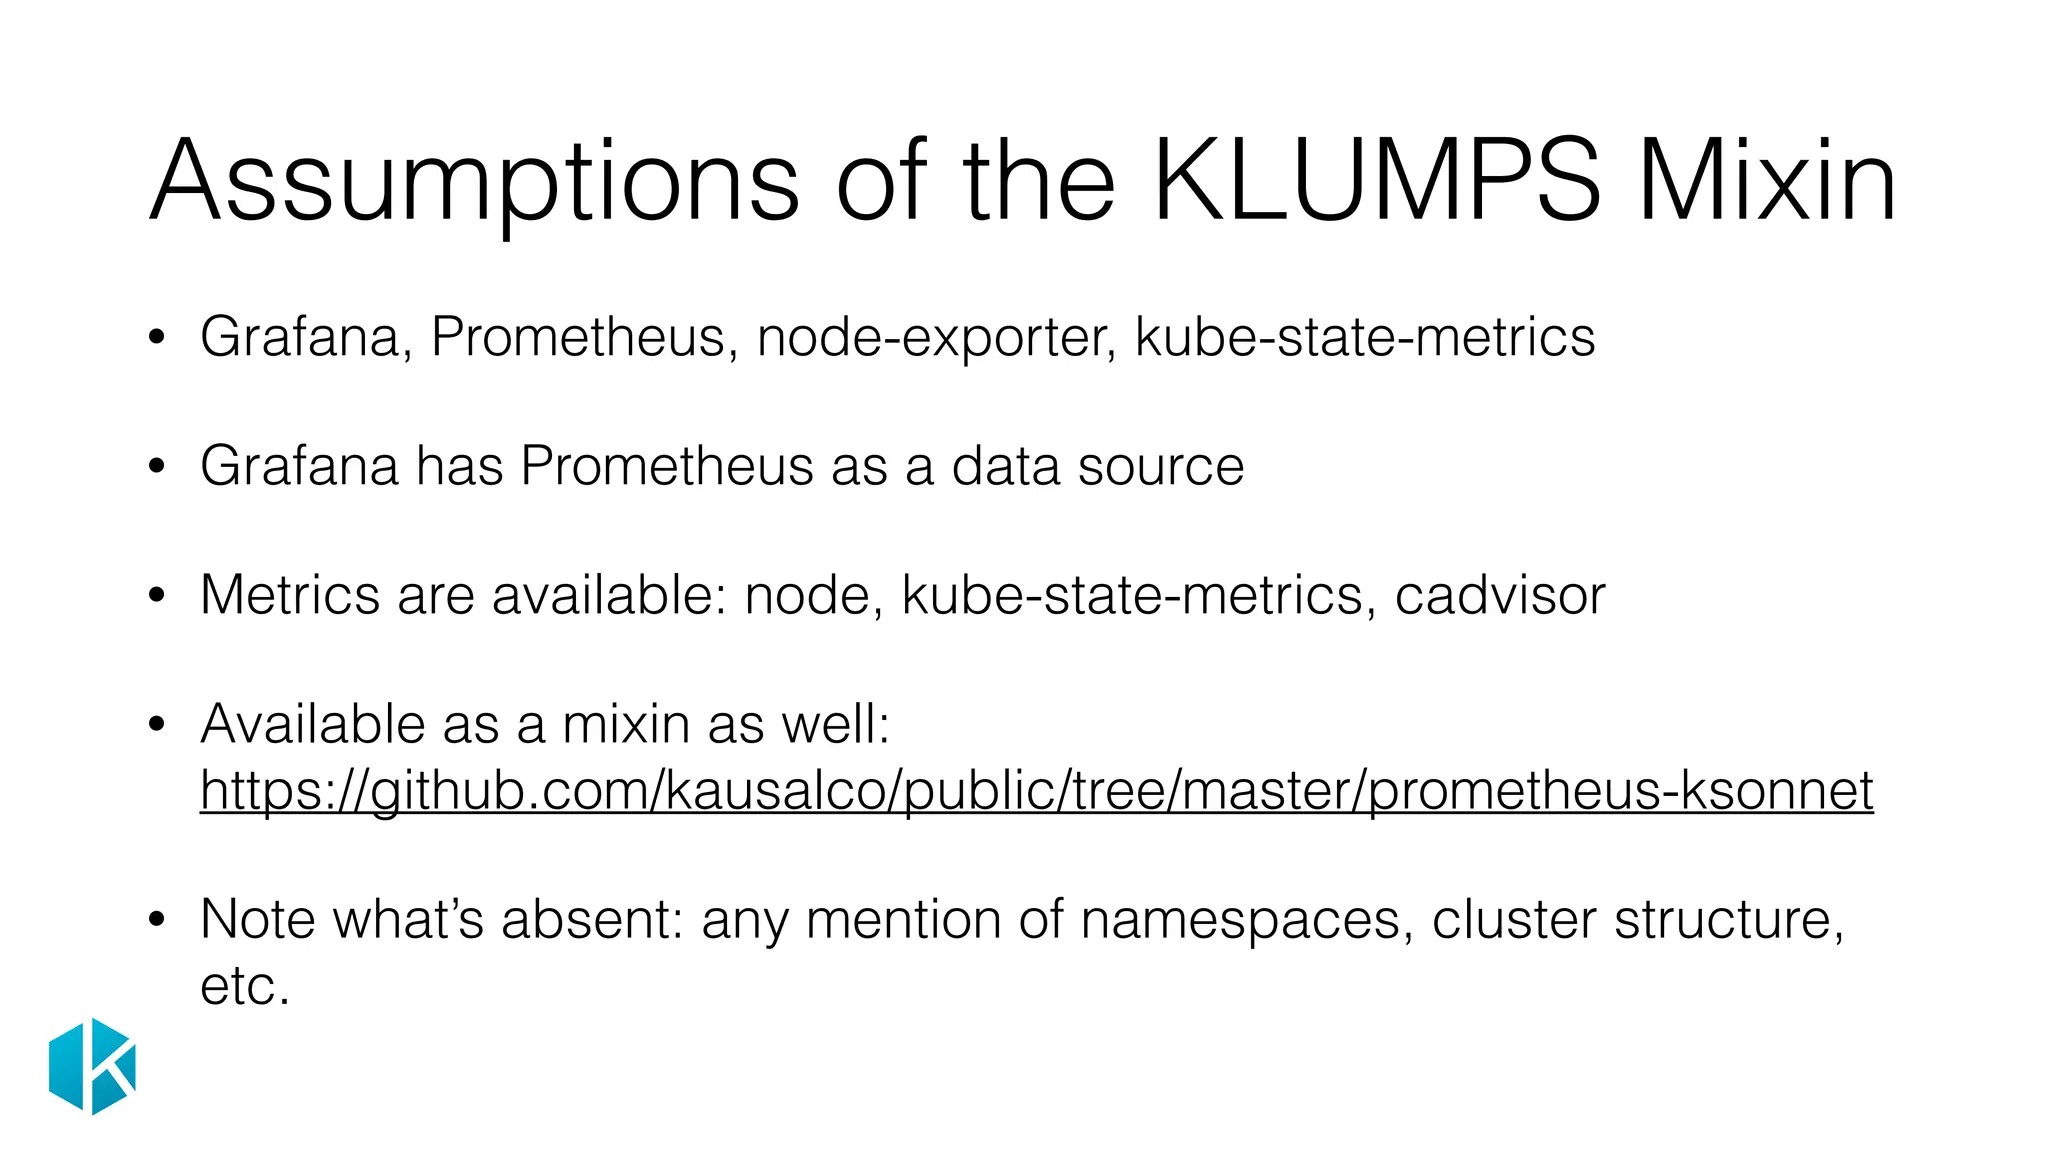
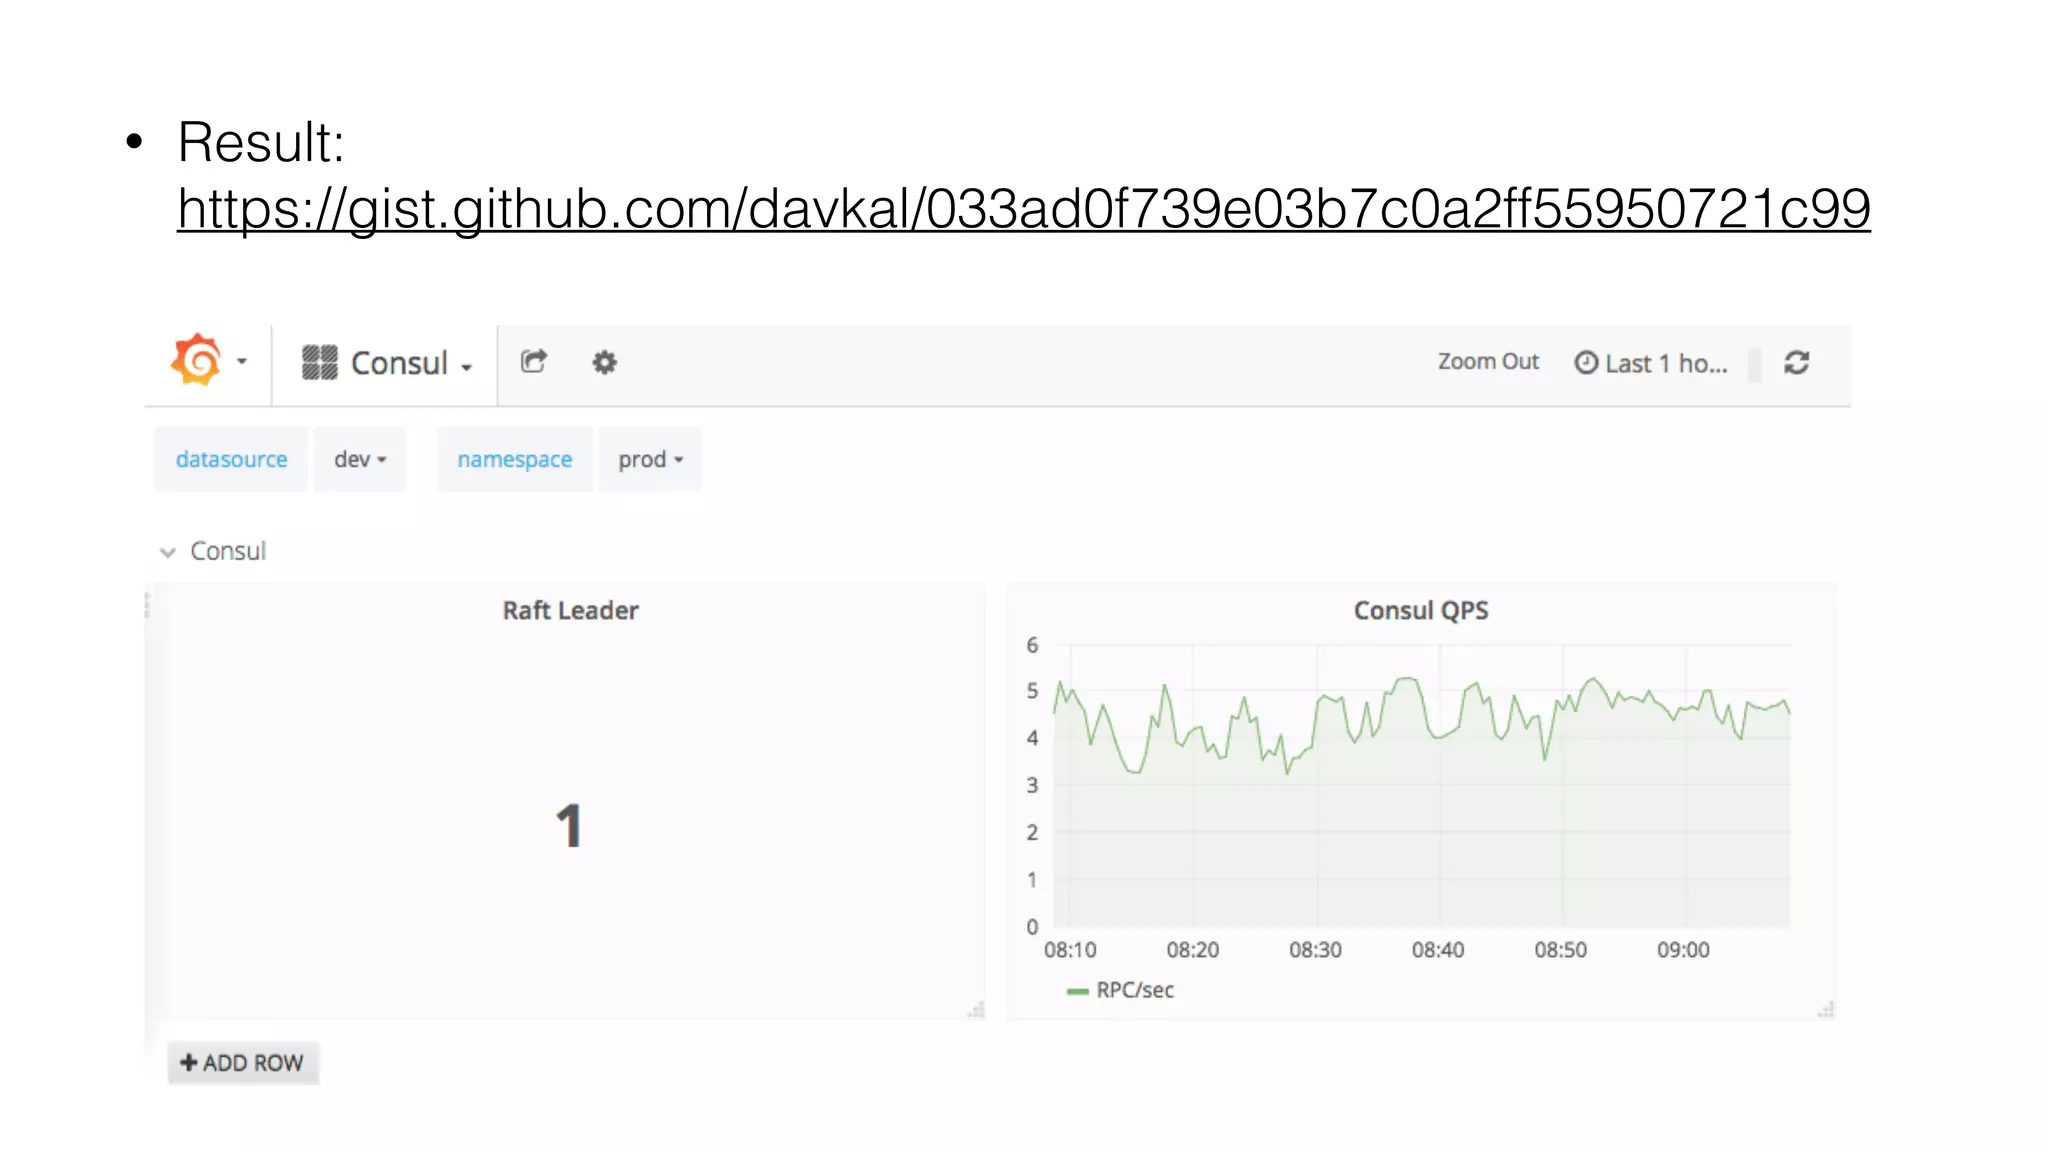


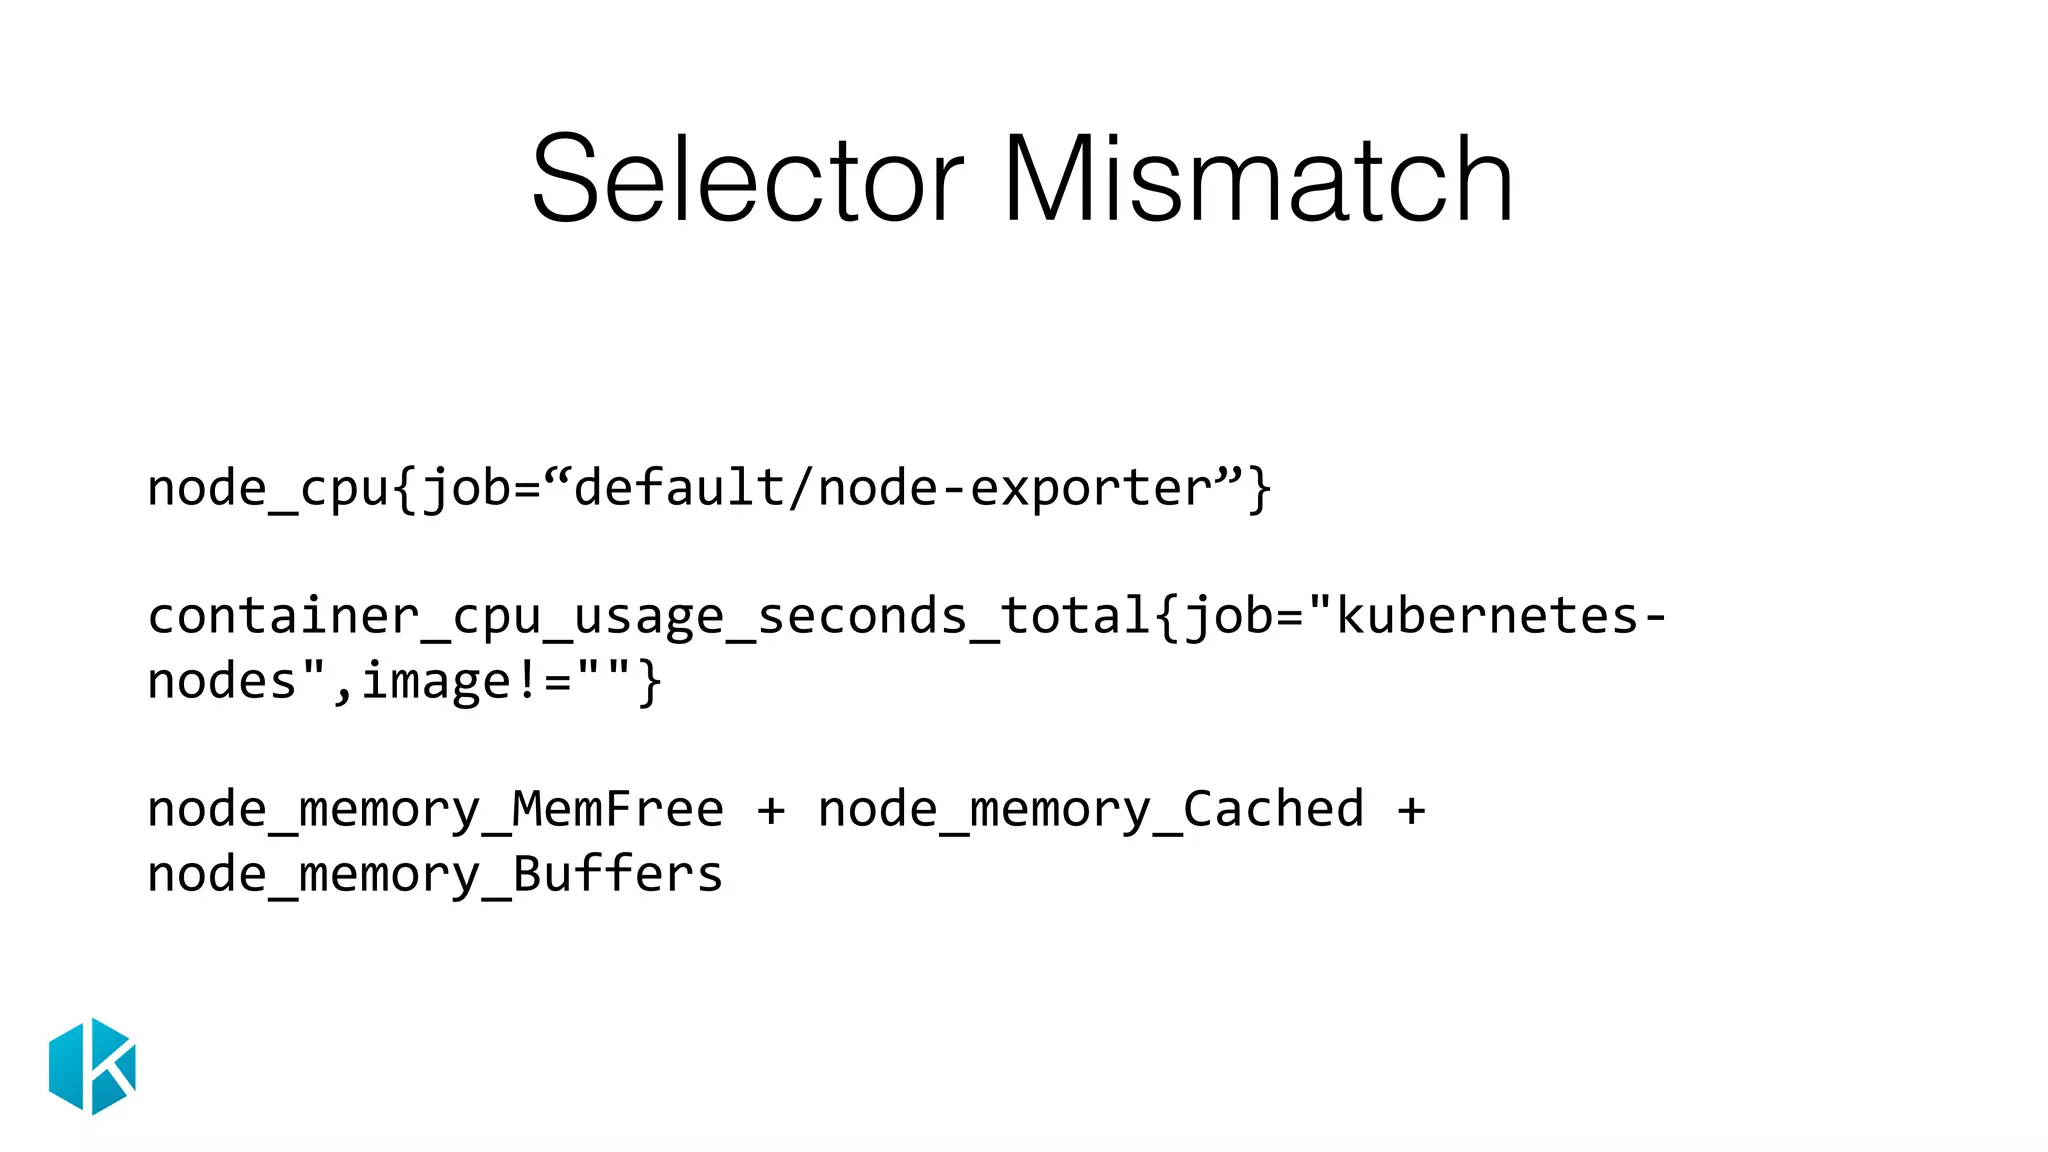
This document discusses using Jsonnet to package together Prometheus dashboards, alerts and exporters for monitoring Kubernetes clusters. It provides an example of using mixins to define reusable monitoring configurations and templates Grafana dashboards. It demonstrates building a Consul monitoring mixin interactively and emphasizes codifying best practices to share configurable monitoring components.

![[오픈소스컨설팅] EFK Stack 소개와 설치 방법](https://cdn.slidesharecdn.com/ss_thumbnails/elasticstack-210712042246-thumbnail.jpg?width=640&height=640&fit=bounds)


![[PromCon2018] Prometheus Monitoring Mixins: Using Jsonnet to Package Together...](https://cdn.slidesharecdn.com/ss_thumbnails/prometheusmonitoringmixins-180809132927-thumbnail.jpg?width=640&height=640&fit=bounds)


![Vibe Coding vs. Spec-Driven Development [Free Meetup]](https://cdn.slidesharecdn.com/ss_thumbnails/vibecodingvsspecdrivendevelopment-251209105622-43f455e7-thumbnail.jpg?width=640&height=640&fit=bounds)


