Download to read offline

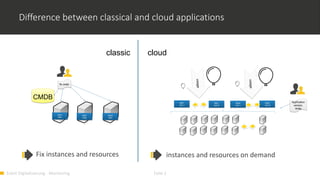
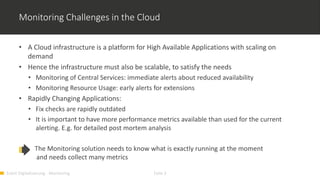


1) Monitoring cloud applications presents unique challenges compared to traditional on-premise applications due to the dynamic and scalable nature of cloud infrastructure. 2) Prometheus is an open source monitoring solution suited for containerized and cloud-native applications like Kubernetes due to its ability to dynamically discover targets and collect many metrics. 3) OMD Labs integrates tools like Prometheus and Grafana to monitor complex and dynamically changing infrastructures like OpenShift clusters, providing dashboards that visualize the health and performance of cluster components from nodes to pods and services.


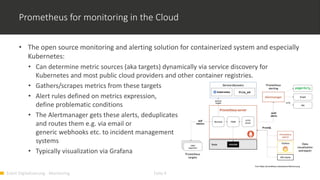
![Nicolas Steinmetz [CérénIT] | Sustain Your Observability from Bare Metal TICK...](https://cdn.slidesharecdn.com/ss_thumbnails/sustainable-observability-from-bare-metal-to-k8s-world-nicolas-steinmetz-200623205020-thumbnail.jpg?width=640&height=640&fit=bounds)


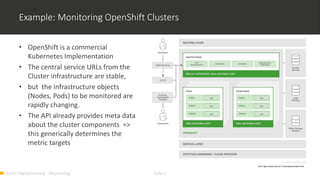
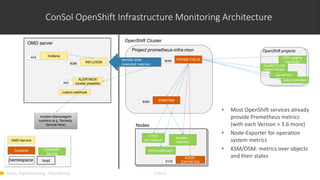
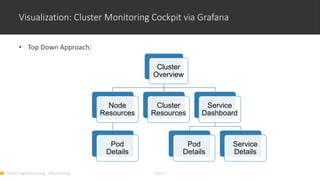
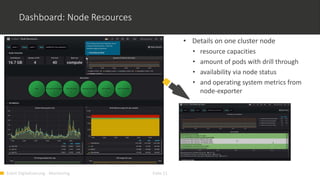
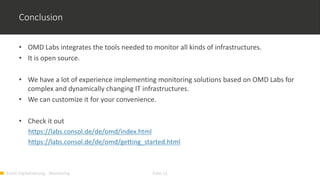
![Giacomo Tirabassi [InfluxData] | Istio at InfluxData | InfluxDays Virtual Exp...](https://cdn.slidesharecdn.com/ss_thumbnails/istio-at-influxdata-giacomo-tirabassi-200623171845-thumbnail.jpg?width=640&height=640&fit=bounds)