Download to read offline

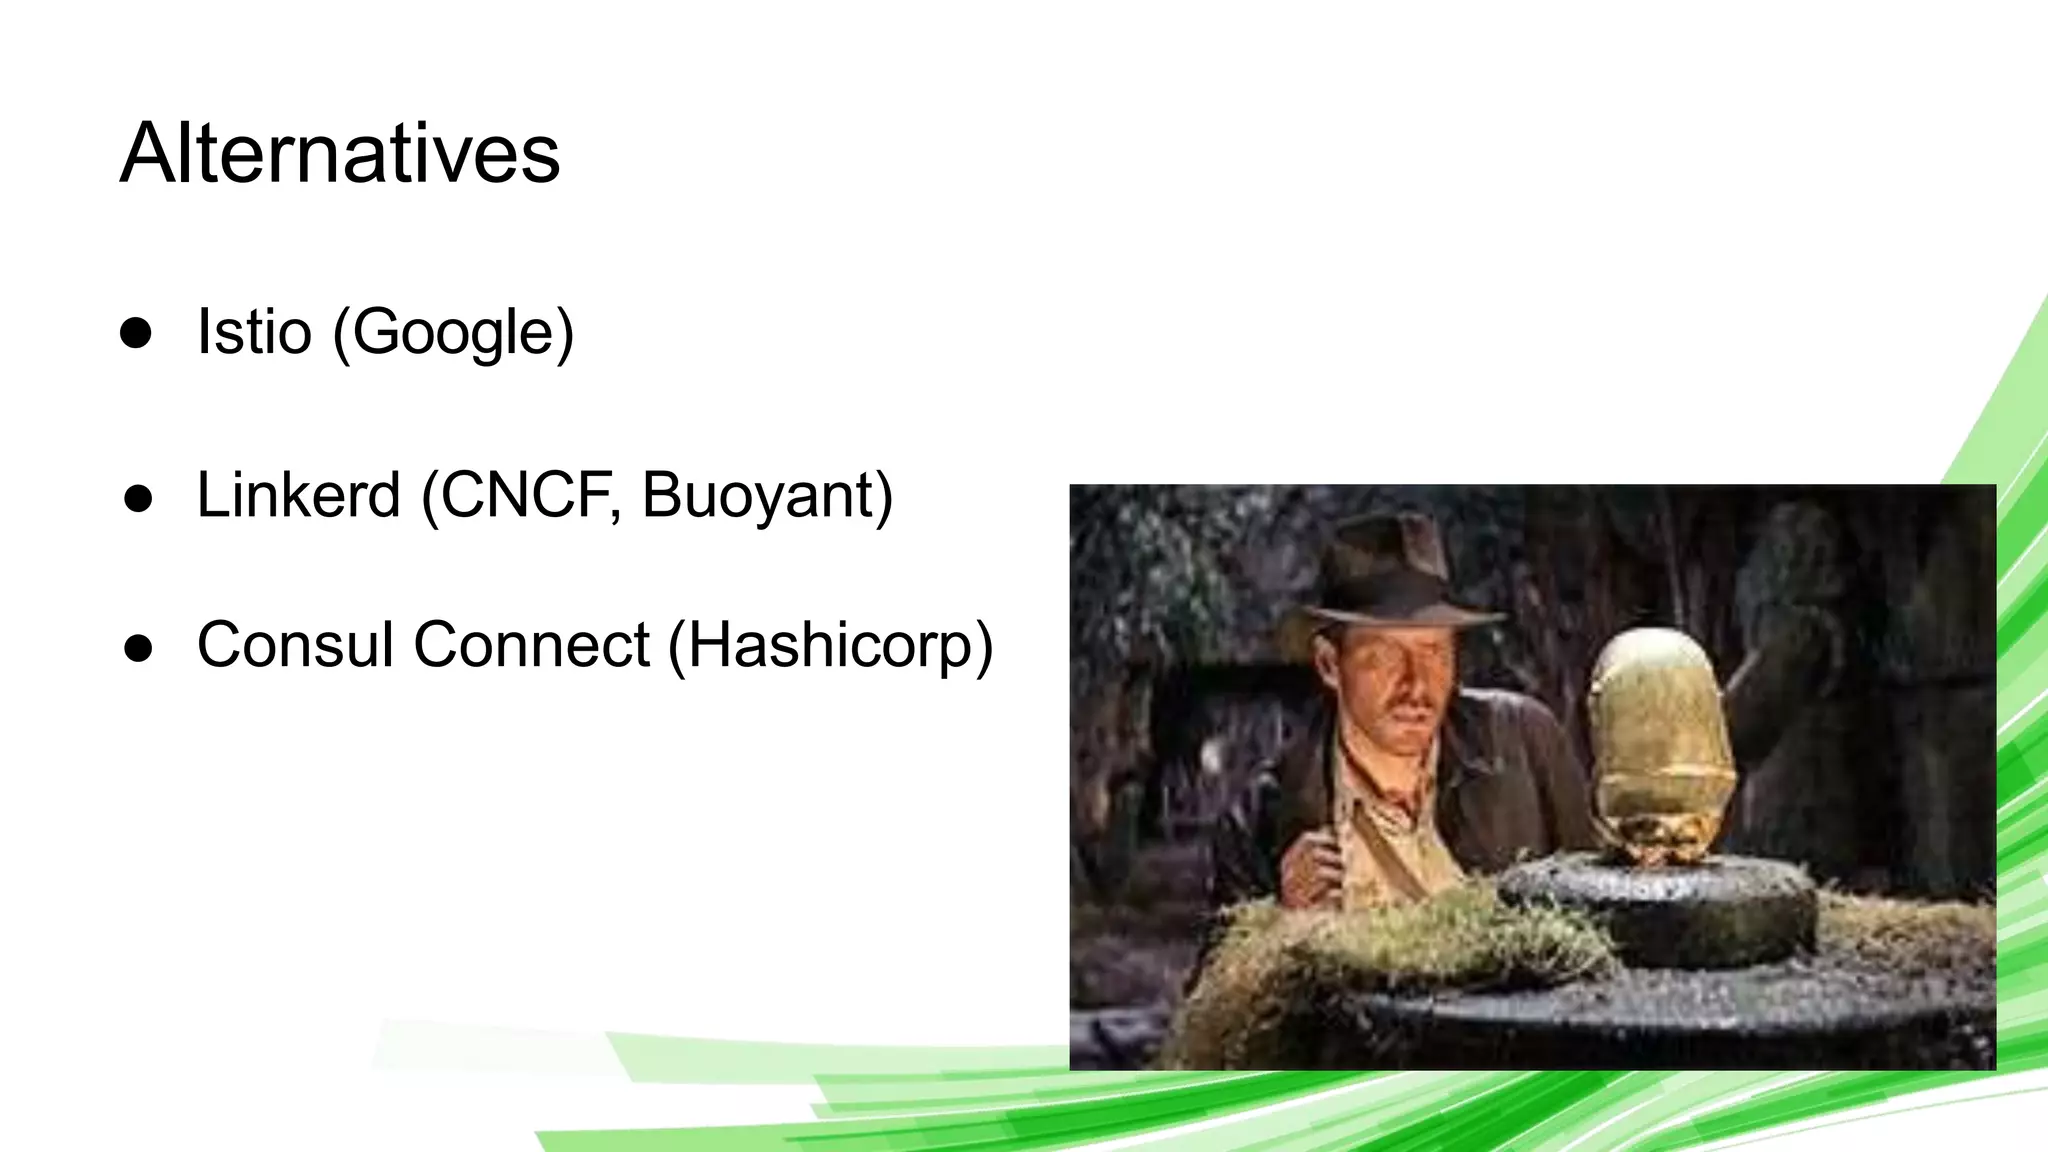
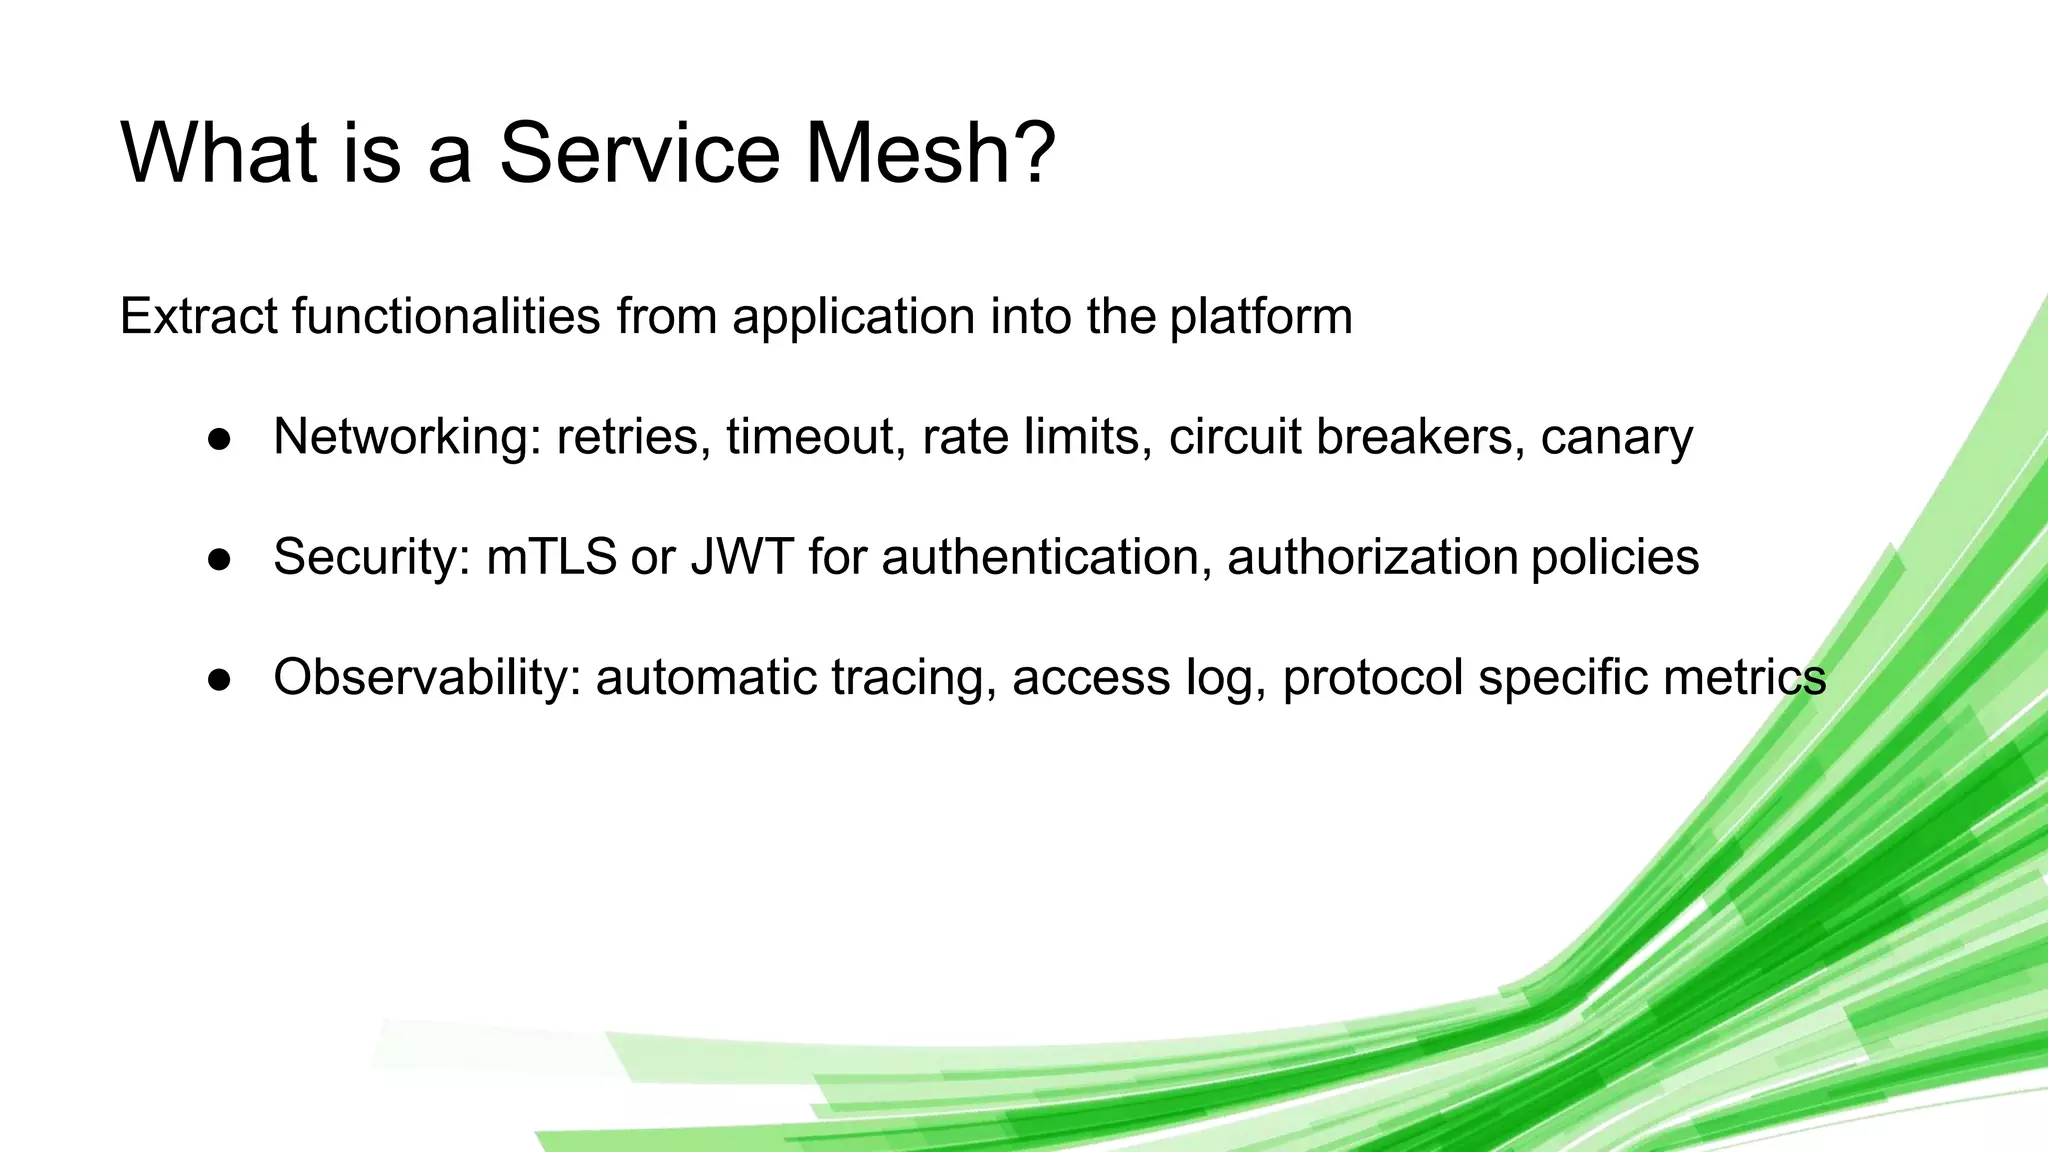
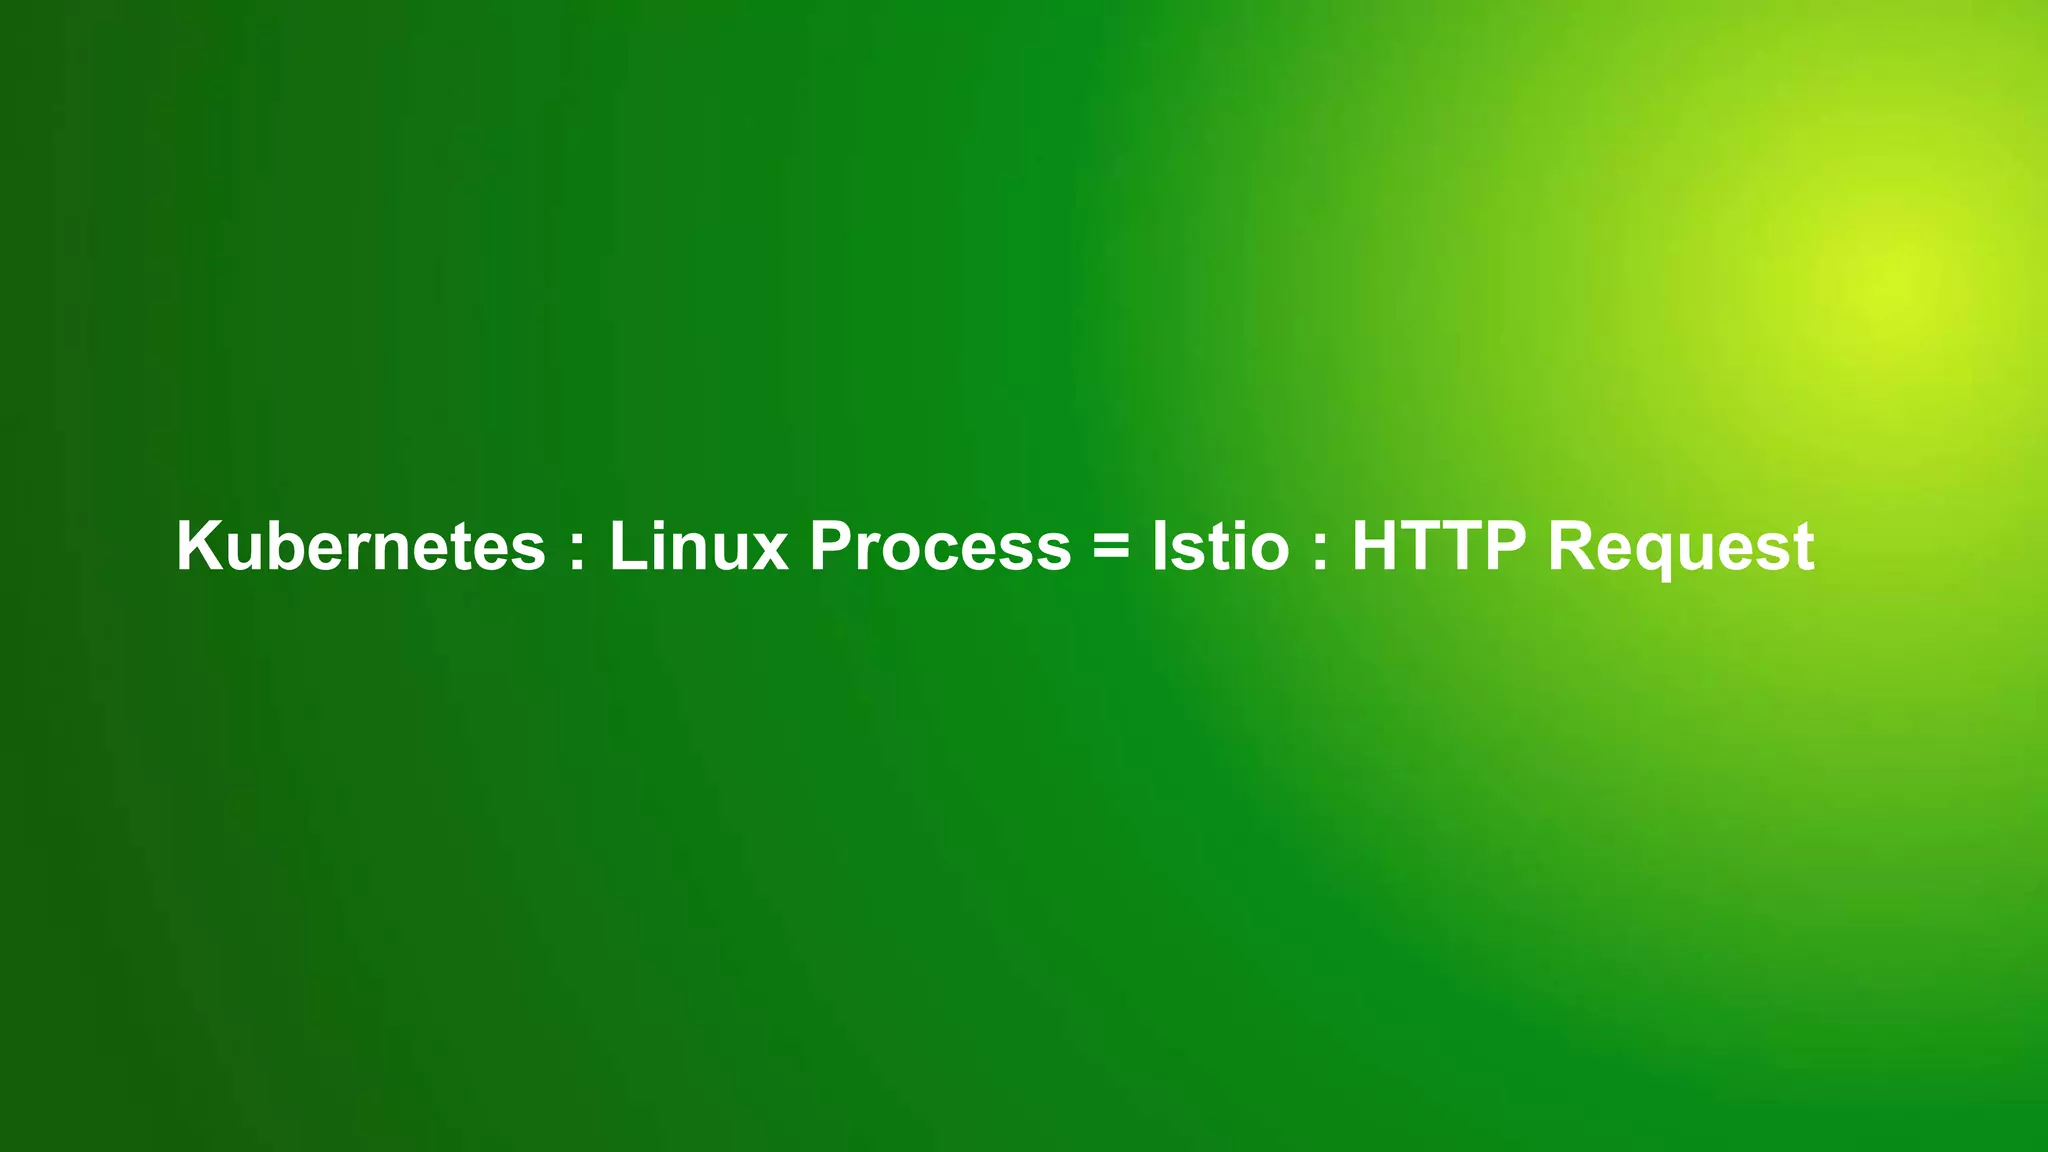
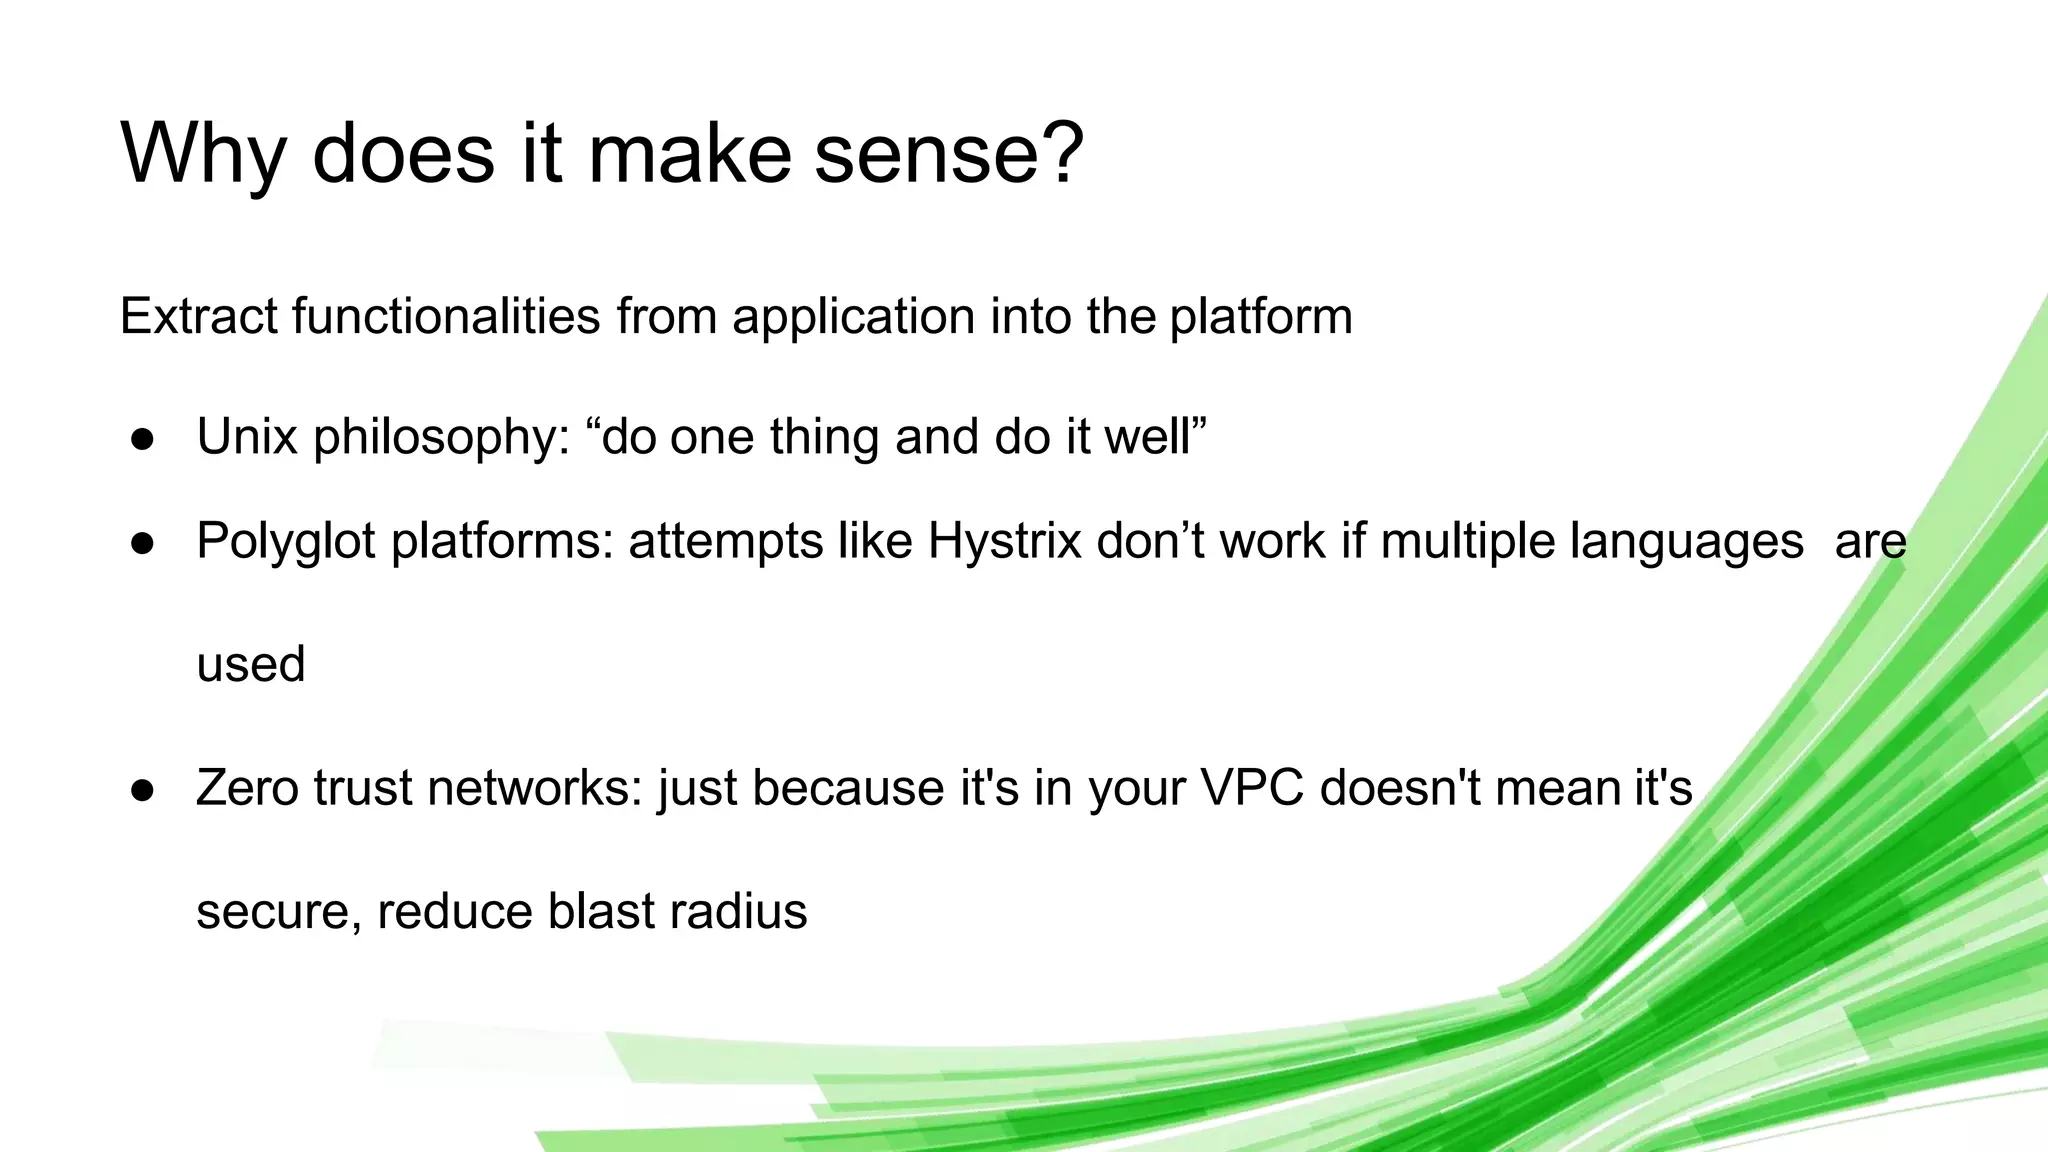


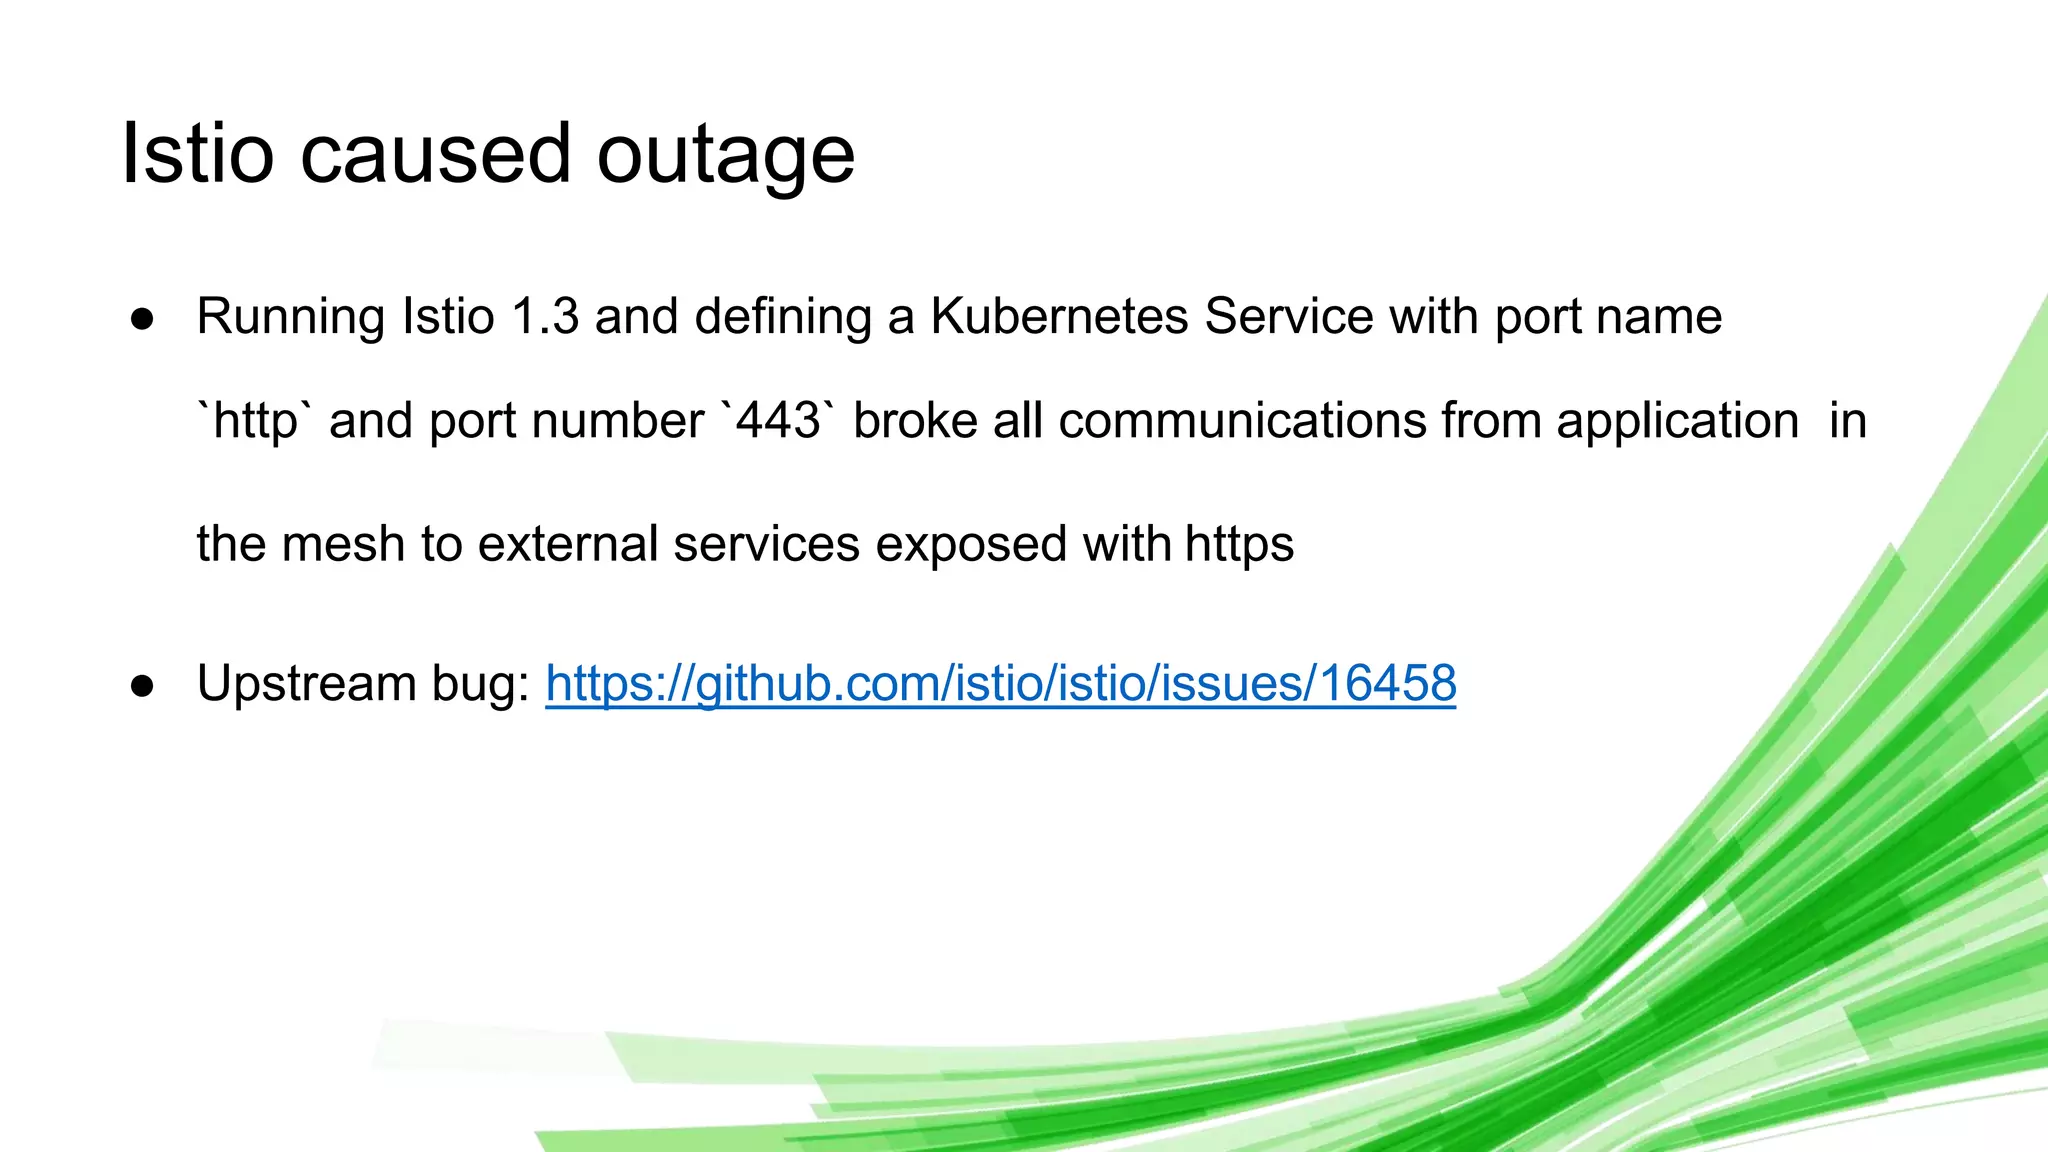
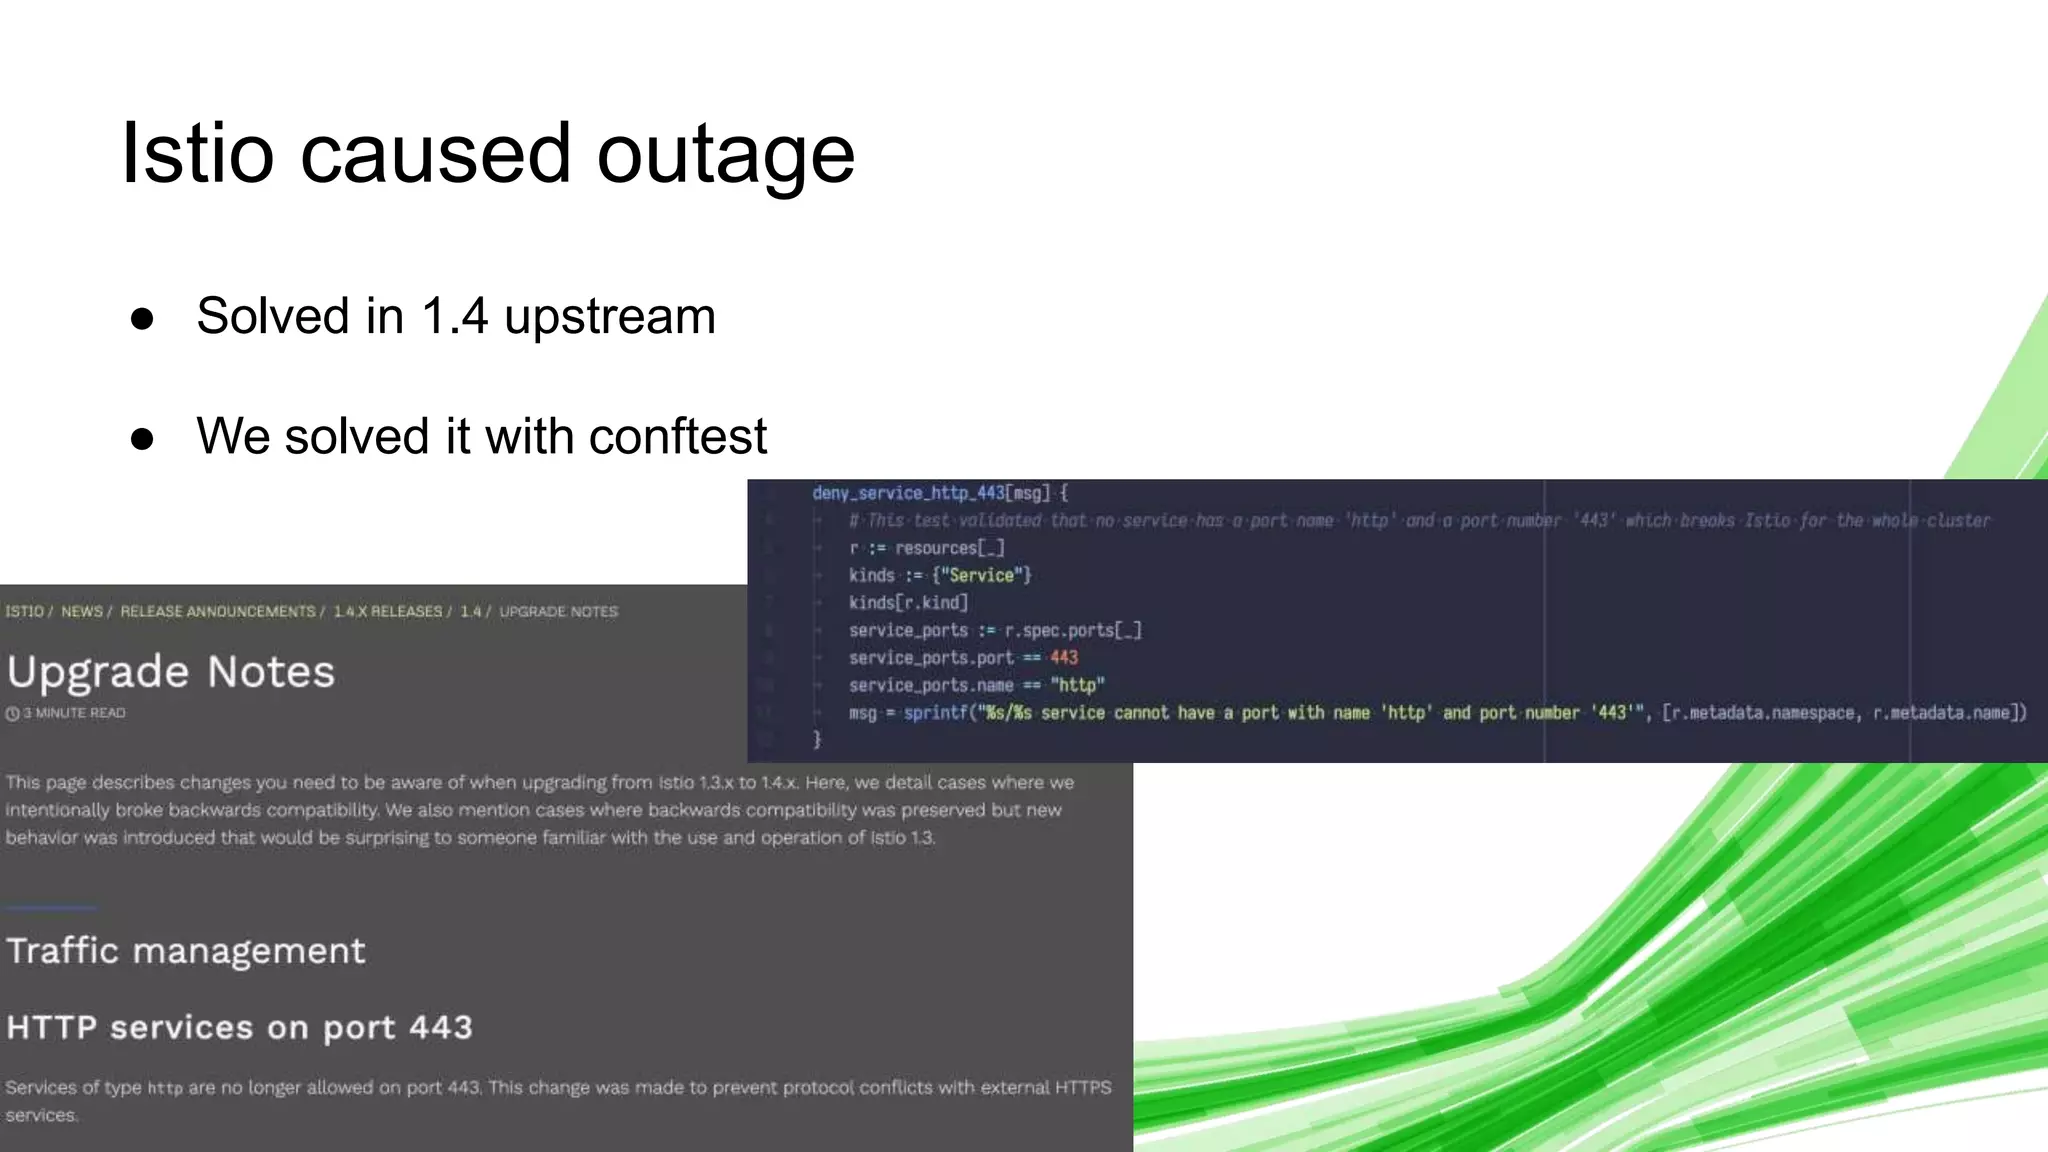

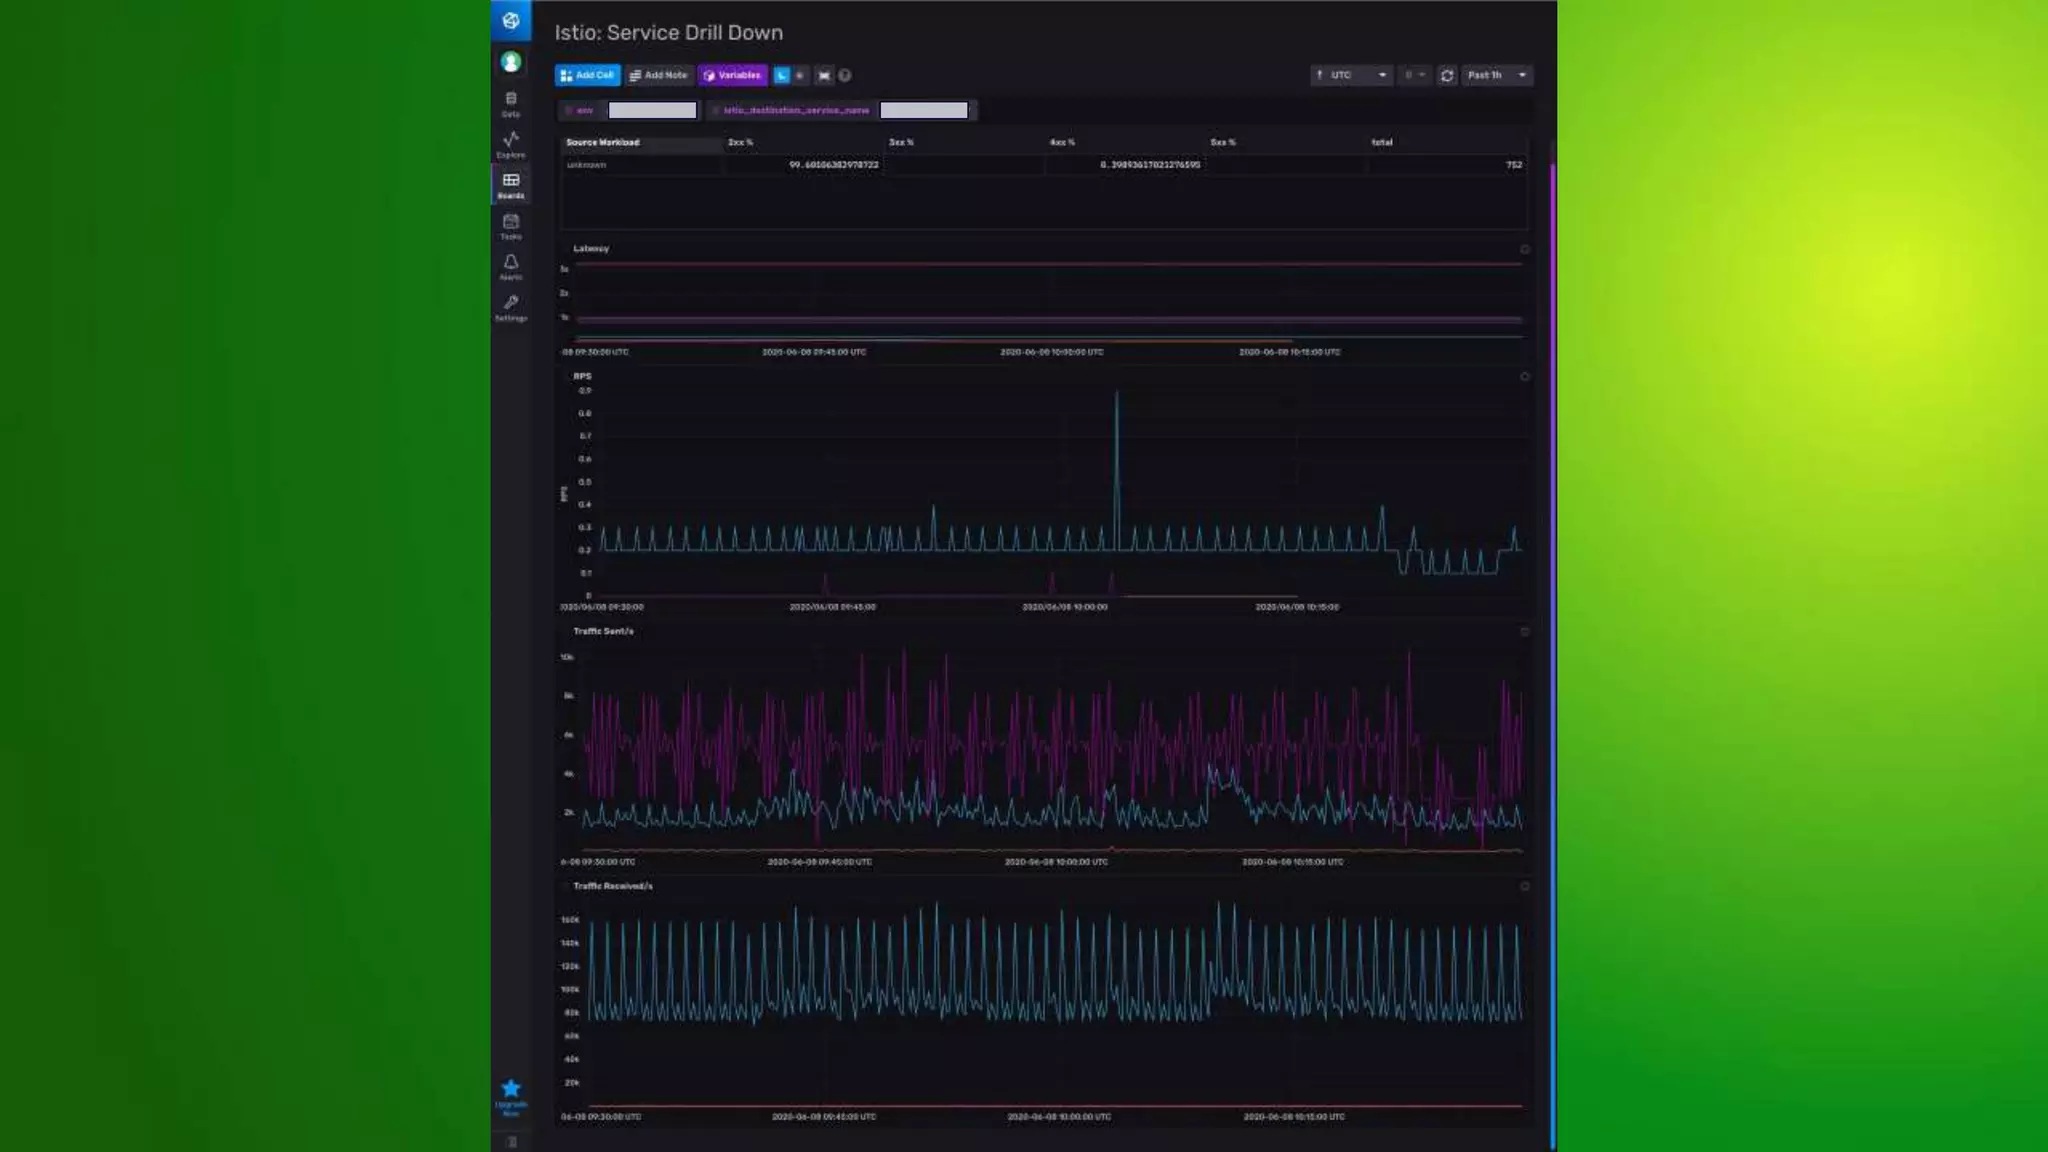
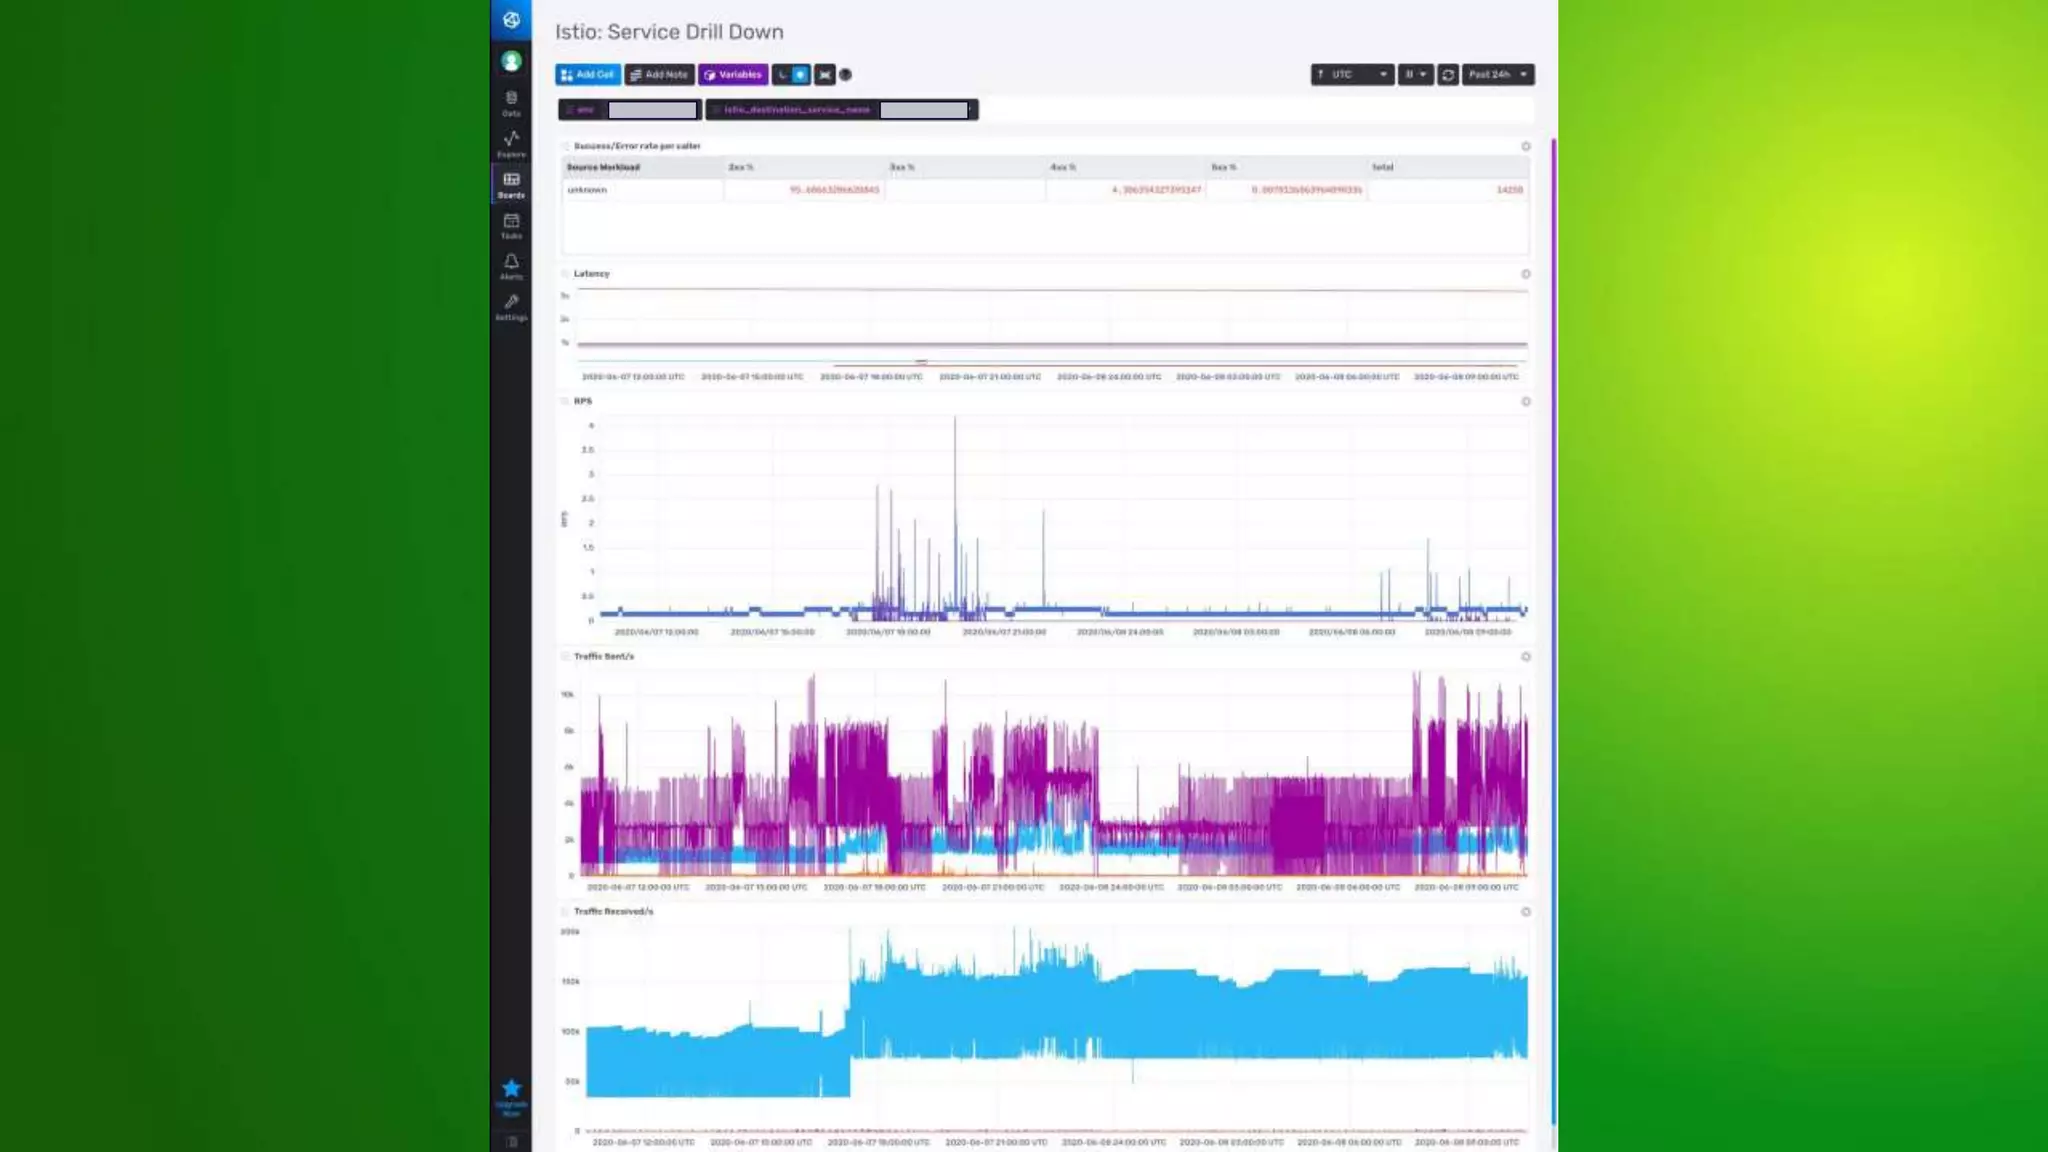


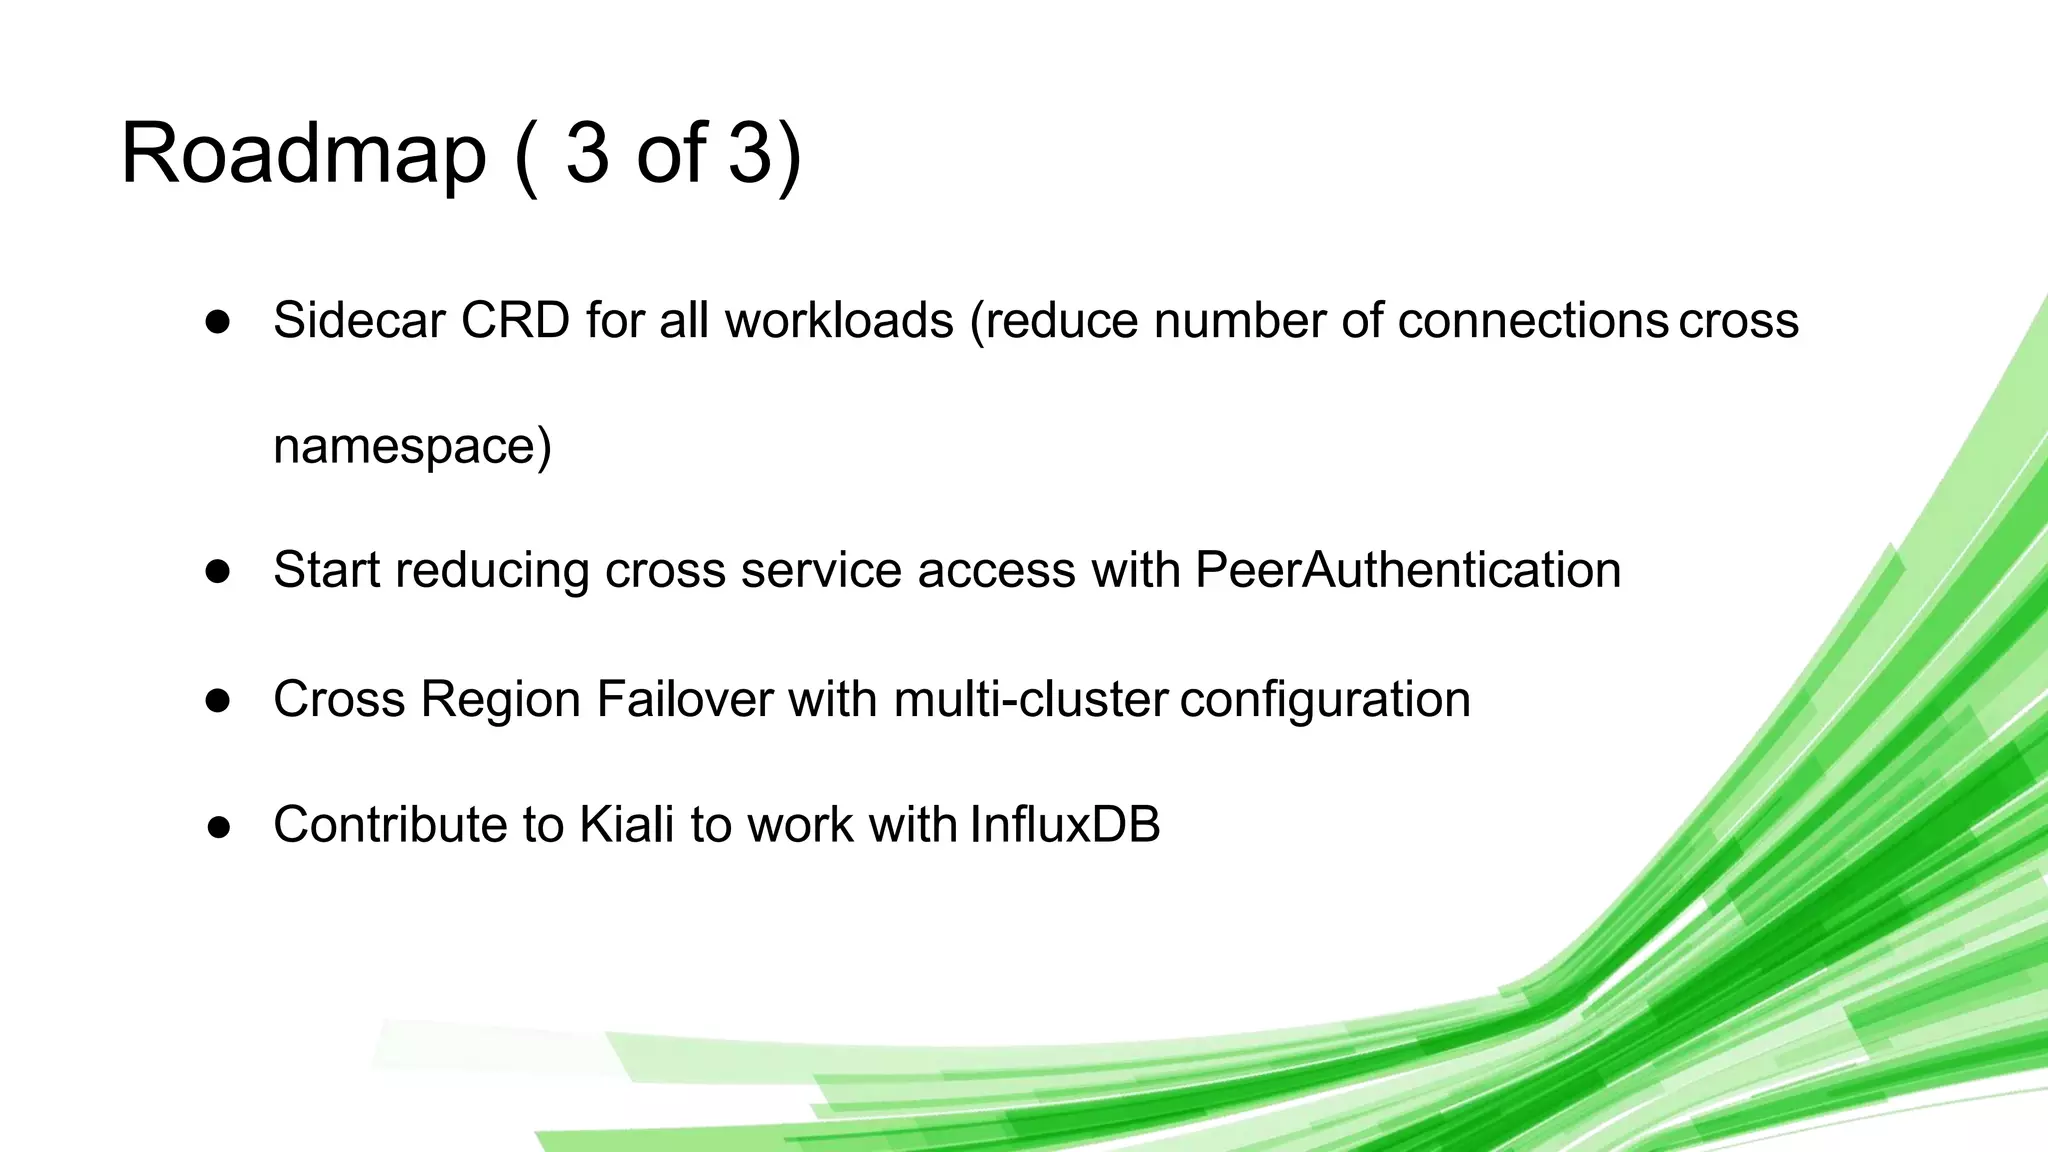


The document provides an overview of service meshes, highlighting their purpose, deployment methods, and benefits, particularly focusing on Istio as an example. It discusses the extraction of functionalities like networking and security from applications into the platform, emphasizing the need for service mesh in multi-language environments and zero trust networks. The roadmap includes plans for enhanced monitoring, stricter security policies, and cross-region failover capabilities.
![Nicolas Steinmetz [CérénIT] | Sustain Your Observability from Bare Metal TICK...](https://cdn.slidesharecdn.com/ss_thumbnails/sustainable-observability-from-bare-metal-to-k8s-world-nicolas-steinmetz-200623205020-thumbnail.jpg?width=640&height=640&fit=bounds)
![Vasilis Papavasiliou [Mist.io] | Integrating Telegraf, InfluxDB and Mist to M...](https://cdn.slidesharecdn.com/ss_thumbnails/vasilispapavasiliouslides-210511200808-thumbnail.jpg?width=640&height=640&fit=bounds)
![Dominik Obermaier and Anja Helmbrecht-Schaar [HiveMQ] | IIoT Monitoring with ...](https://cdn.slidesharecdn.com/ss_thumbnails/dominikobermaieranjahelmbrecht-schaarslides-210511200918-thumbnail.jpg?width=640&height=640&fit=bounds)
![Jess Ingrassellino [InfluxData] | How to Get Data Into InfluxDB | InfluxDays ...](https://cdn.slidesharecdn.com/ss_thumbnails/jessingrassellinoslides-210511200652-thumbnail.jpg?width=640&height=640&fit=bounds)
![Brandon Farmer [InfluxData] | Tools for Working with Flux Now and in the Futu...](https://cdn.slidesharecdn.com/ss_thumbnails/influxdaysbfarmer-200630193014-thumbnail.jpg?width=640&height=640&fit=bounds)
![Sebastian Spaink [InfluxData] | Layer by Layer: Printing Your Own External In...](https://cdn.slidesharecdn.com/ss_thumbnails/influxdaysemea20211-210419194123-thumbnail.jpg?width=640&height=640&fit=bounds)
![Andy Charlton [InfluxData] | Managing Your Dashboards, Tasks and Alerts Made ...](https://cdn.slidesharecdn.com/ss_thumbnails/andycharltonslides-210507162942-thumbnail.jpg?width=640&height=640&fit=bounds)
![Paul Dix [InfluxData] | InfluxDays Opening Keynote | InfluxDays Virtual Exper...](https://cdn.slidesharecdn.com/ss_thumbnails/influxdays-opening-keynote-paul-dix-200623175743-thumbnail.jpg?width=640&height=640&fit=bounds)
![Jacob Marble [InfluxData] | Observability with InfluxDB IOx and OpenTelemetry...](https://cdn.slidesharecdn.com/ss_thumbnails/influxdbioxandopentelemetry-27-oct-2021jmarble-211022195239-thumbnail.jpg?width=640&height=640&fit=bounds)


![Bernard Paques & Kevin Polossat [AWS] | Combining the Power of InfluxDB and A...](https://cdn.slidesharecdn.com/ss_thumbnails/bernardpaqueskevinpolossatawscombiningthepowerofinfluxdbandawsforiotusecasesinfluxdaysemea2021-210517184442-thumbnail.jpg?width=640&height=640&fit=bounds)
![Brian Gilmore [InfluxData] | InfluxDB in an IoT Application Architecture | In...](https://cdn.slidesharecdn.com/ss_thumbnails/brian-gilmoreinfluxdays-2021iot1-211022195133-thumbnail.jpg?width=640&height=640&fit=bounds)
![Ryan Betts [InfluxData] | InfluxDB Platform Performance | InfluxDays Virtual ...](https://cdn.slidesharecdn.com/ss_thumbnails/influxdaysna-ryan-201110022532-thumbnail.jpg?width=640&height=640&fit=bounds)
![Ana-Maria Calin [InfluxData] | Migrating from OSS to InfluxDB Cloud | InfluxD...](https://cdn.slidesharecdn.com/ss_thumbnails/influxdays2021-migratingfromosstoinfluxdbcloudanacalin-211022195114-thumbnail.jpg?width=640&height=640&fit=bounds)

![Michael DeSa [InfluxData] | Monitoring Methodologies | InfluxDays Virtual Exp...](https://cdn.slidesharecdn.com/ss_thumbnails/monitoring-methodologies-michael-desa-200623172150-thumbnail.jpg?width=640&height=640&fit=bounds)

![Kristina Robinson [InfluxData] | Understand and Visualize Your Data with Infl...](https://cdn.slidesharecdn.com/ss_thumbnails/kristinarobinsonsildes1-210519102649-thumbnail.jpg?width=640&height=640&fit=bounds)

![Evan Kaplan [InfluxData] | InfluxDays Opening Remarks | InfluxDays EMEA 2021](https://cdn.slidesharecdn.com/ss_thumbnails/evankaplanslides-210519180533-thumbnail.jpg?width=640&height=640&fit=bounds)


![Ward Bowman [PTC] | ThingWorx Long-Term Data Storage with InfluxDB | InfluxDa...](https://cdn.slidesharecdn.com/ss_thumbnails/influxdays-221027185325-5d2f430b-thumbnail.jpg?width=640&height=640&fit=bounds)

![Steinkamp, Clifford [InfluxData] | Welcome to InfluxDays 2022 - Day 2 | Influ...](https://cdn.slidesharecdn.com/ss_thumbnails/influxdays2022welcometoday2-221020215815-c8463942-thumbnail.jpg?width=640&height=640&fit=bounds)
![Steinkamp, Clifford [InfluxData] | Closing Thoughts | InfluxDays 2022](https://cdn.slidesharecdn.com/ss_thumbnails/influxdays2022closingthoughtsday2-221020220104-abde55ea-thumbnail.jpg?width=640&height=640&fit=bounds)
![Steinkamp, Clifford [InfluxData] | Closing Thoughts Day 1 | InfluxDays 2022](https://cdn.slidesharecdn.com/ss_thumbnails/influxdays2022closingthoughtsday1-221020215301-f8040e1f-thumbnail.jpg?width=640&height=640&fit=bounds)

![Scott Anderson [InfluxData] | New & Upcoming Flux Features | InfluxDays 2022](https://cdn.slidesharecdn.com/ss_thumbnails/influxdays2022-fluxupdates-scott-221021210238-9d323cba-thumbnail.jpg?width=640&height=640&fit=bounds)
![Coded Agents – with UiPath SDK + LangGraph [Virtual Hands-on Workshop]](https://cdn.slidesharecdn.com/ss_thumbnails/codedagentsdeck-251215155422-5497c599-thumbnail.jpg?width=640&height=640&fit=bounds)


