Download as PDF, PPTX

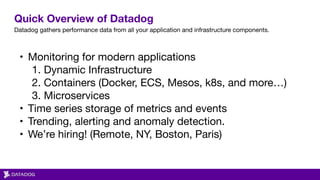


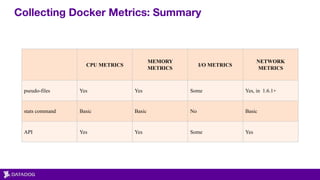

This document discusses monitoring Docker containers. It provides an overview of Datadog and how it can be used to monitor dynamic infrastructure like Docker. It then discusses the challenges in monitoring Docker environments due to their dynamic and distributed nature. Finally, it outlines different methods for collecting key metrics on Docker containers like CPU, memory, I/O and network metrics using Docker's pseudo-files, stats command and API.