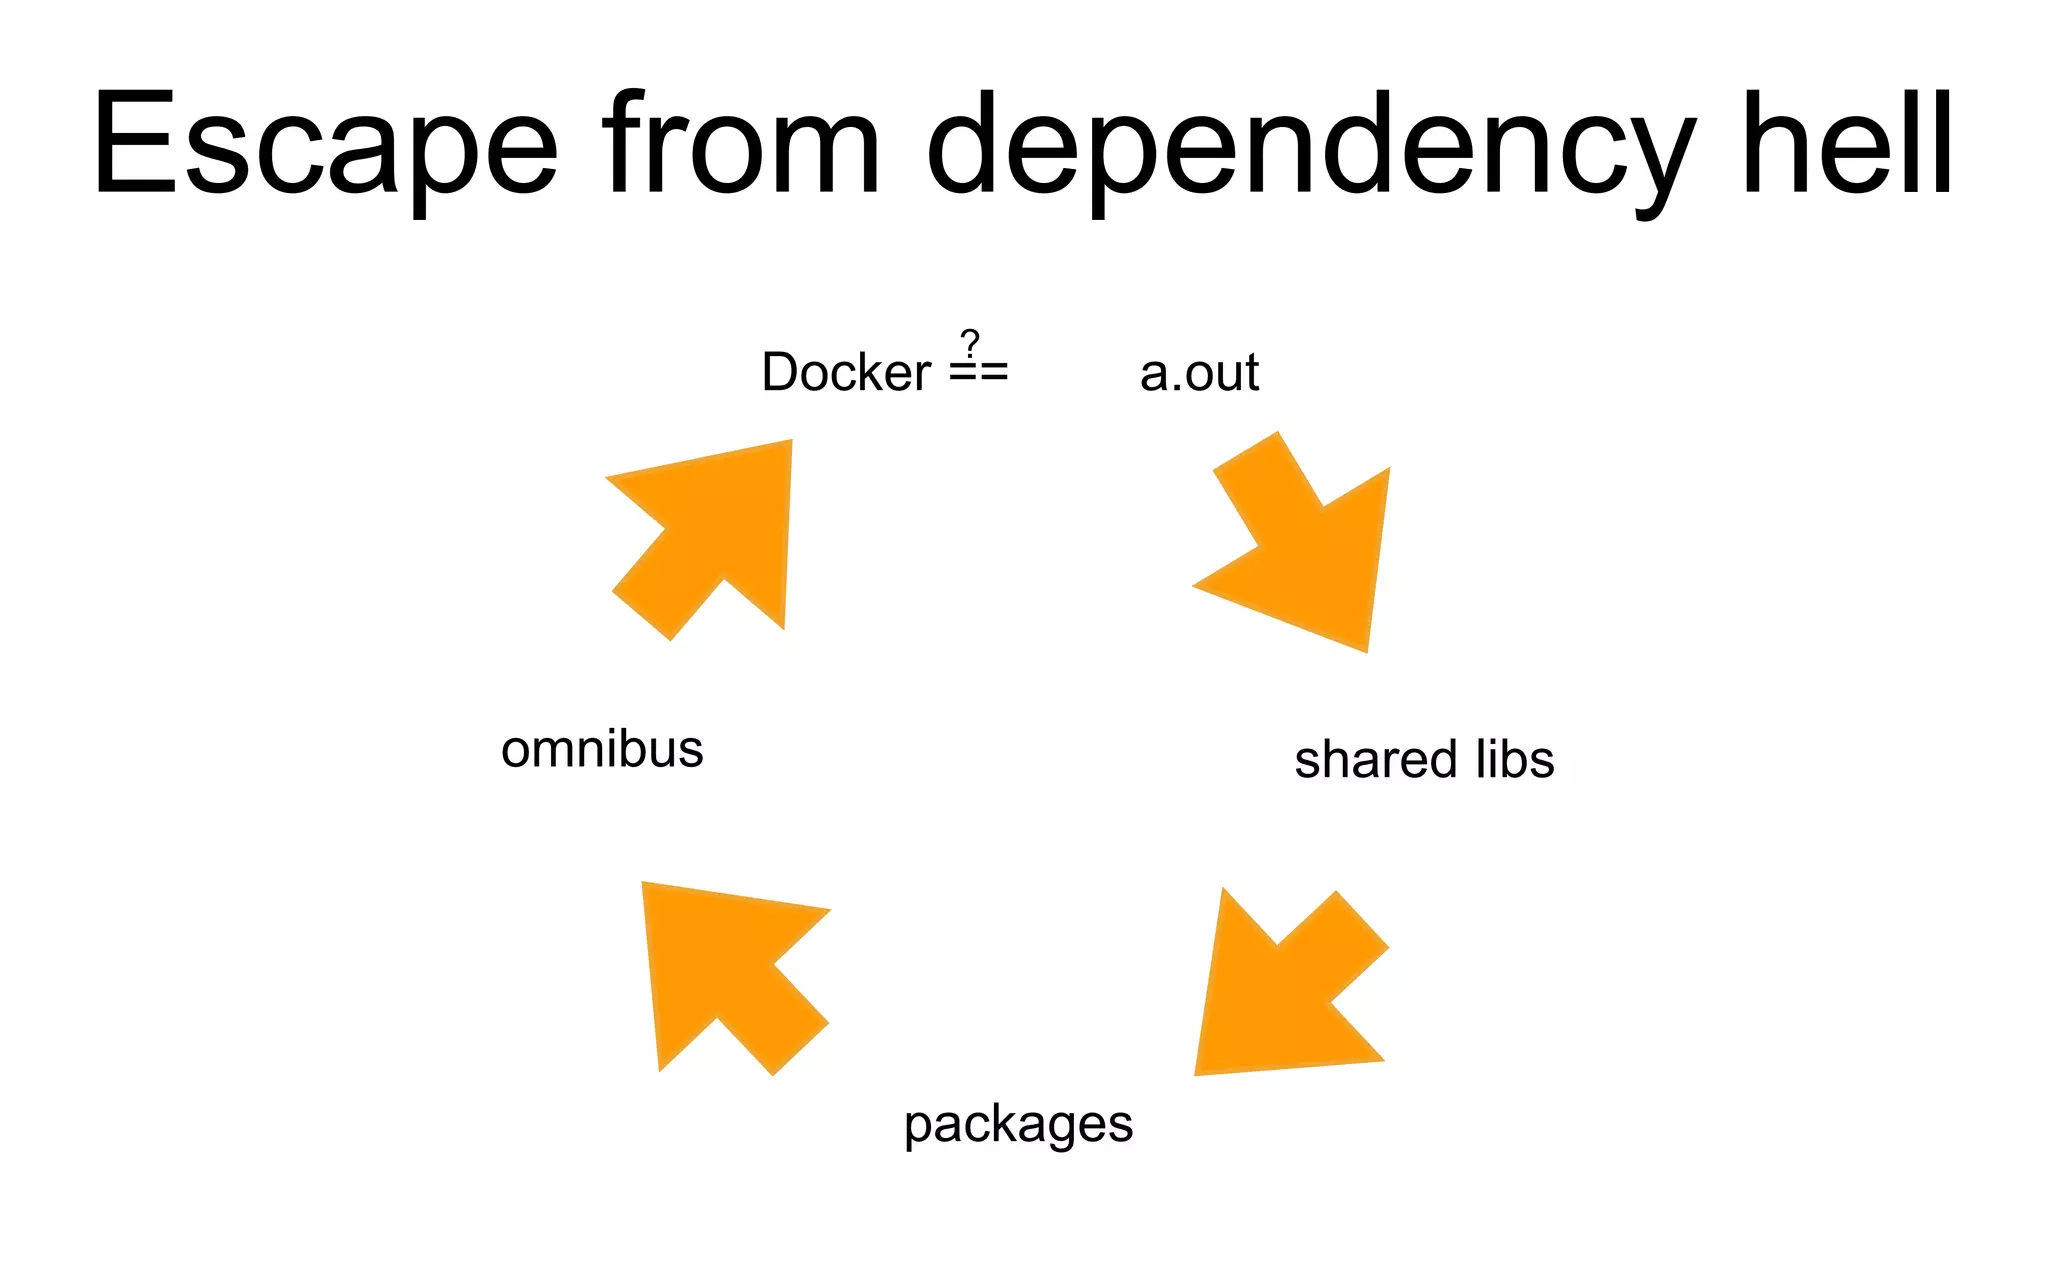
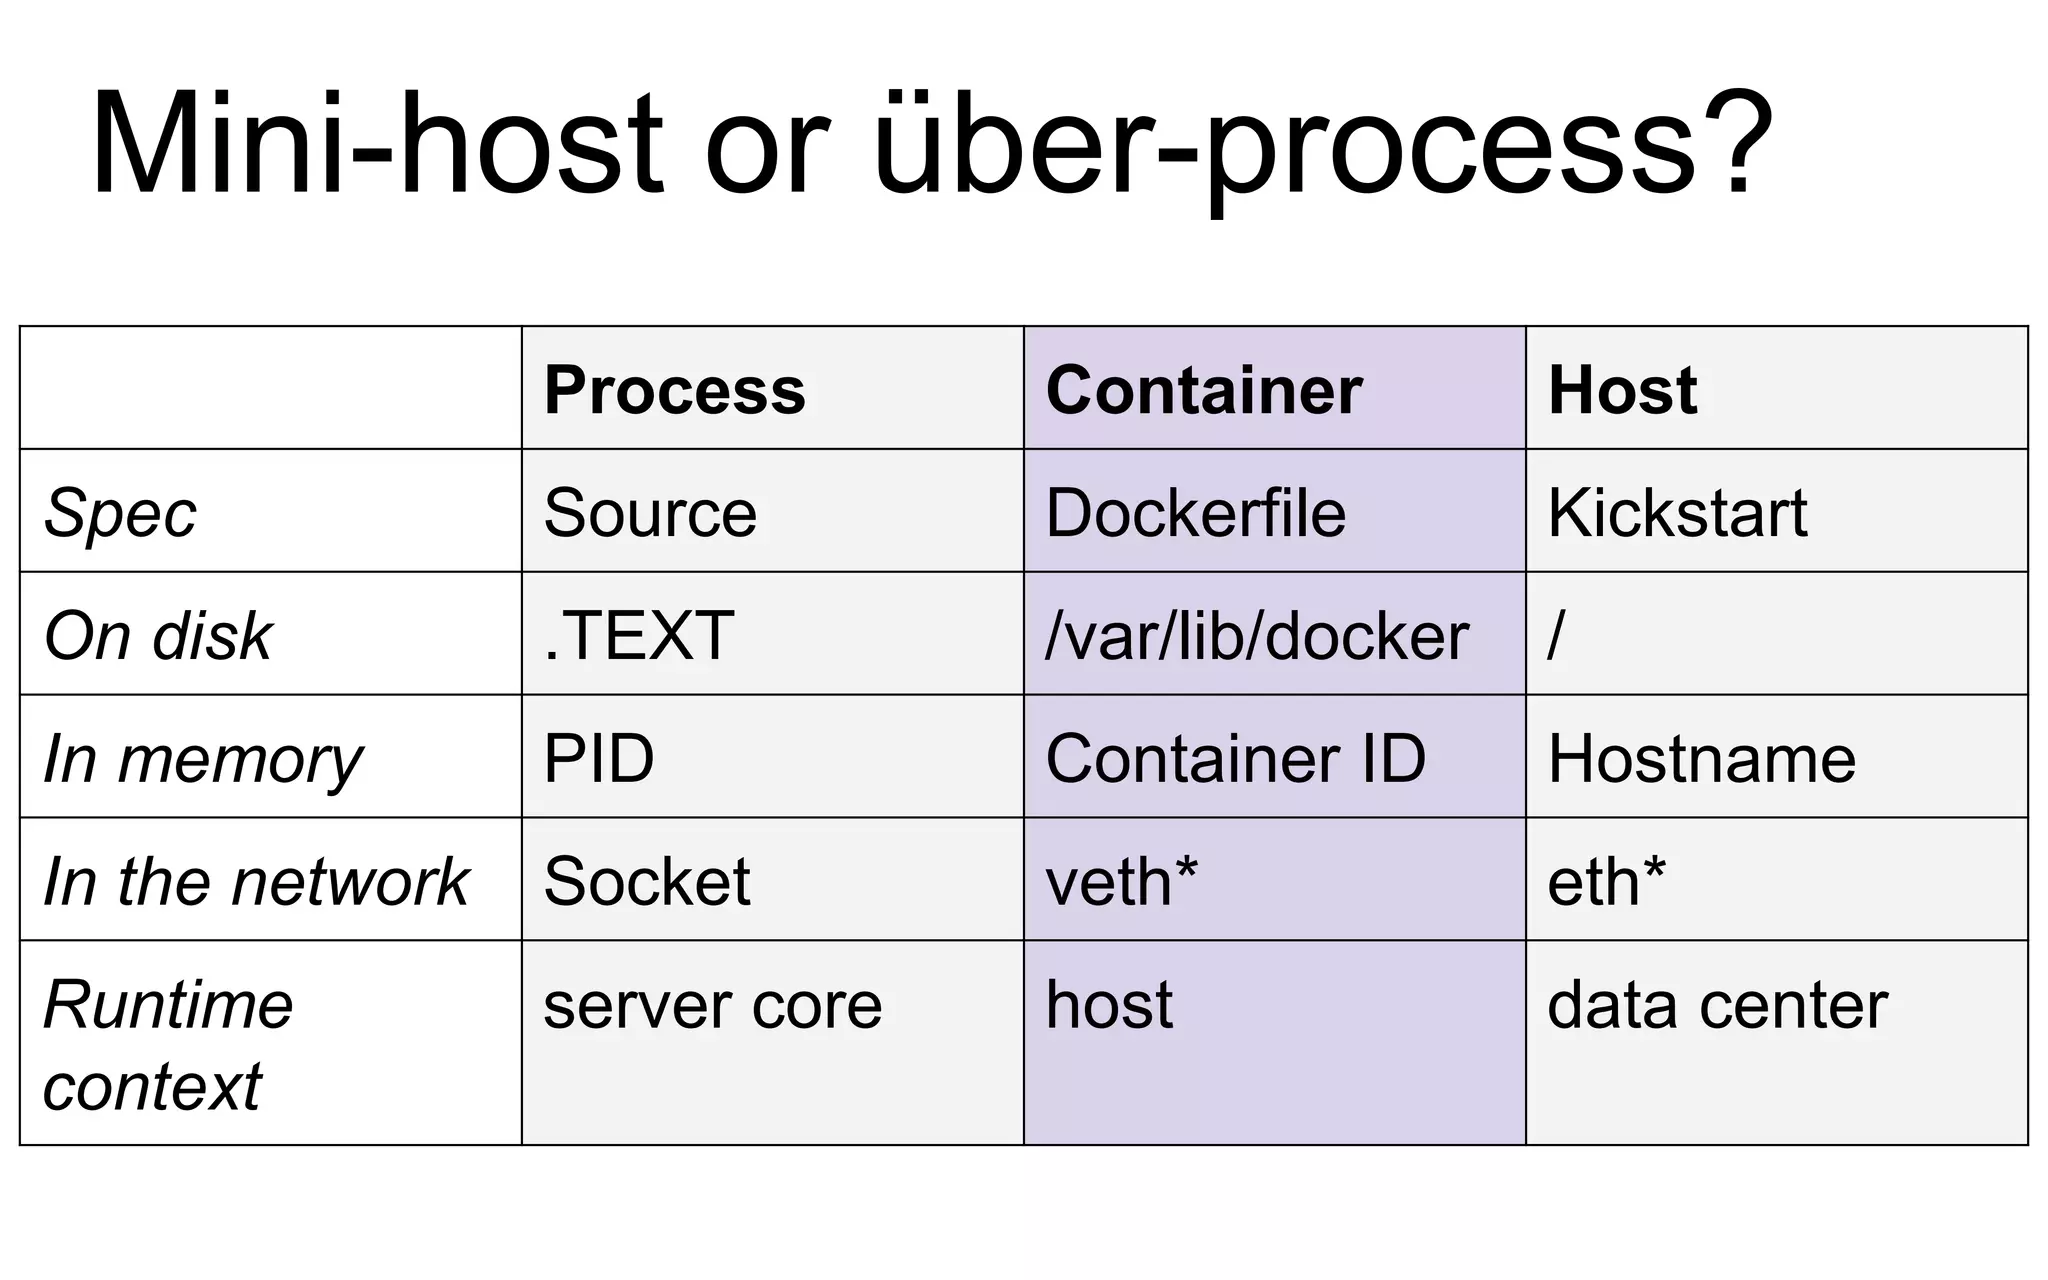
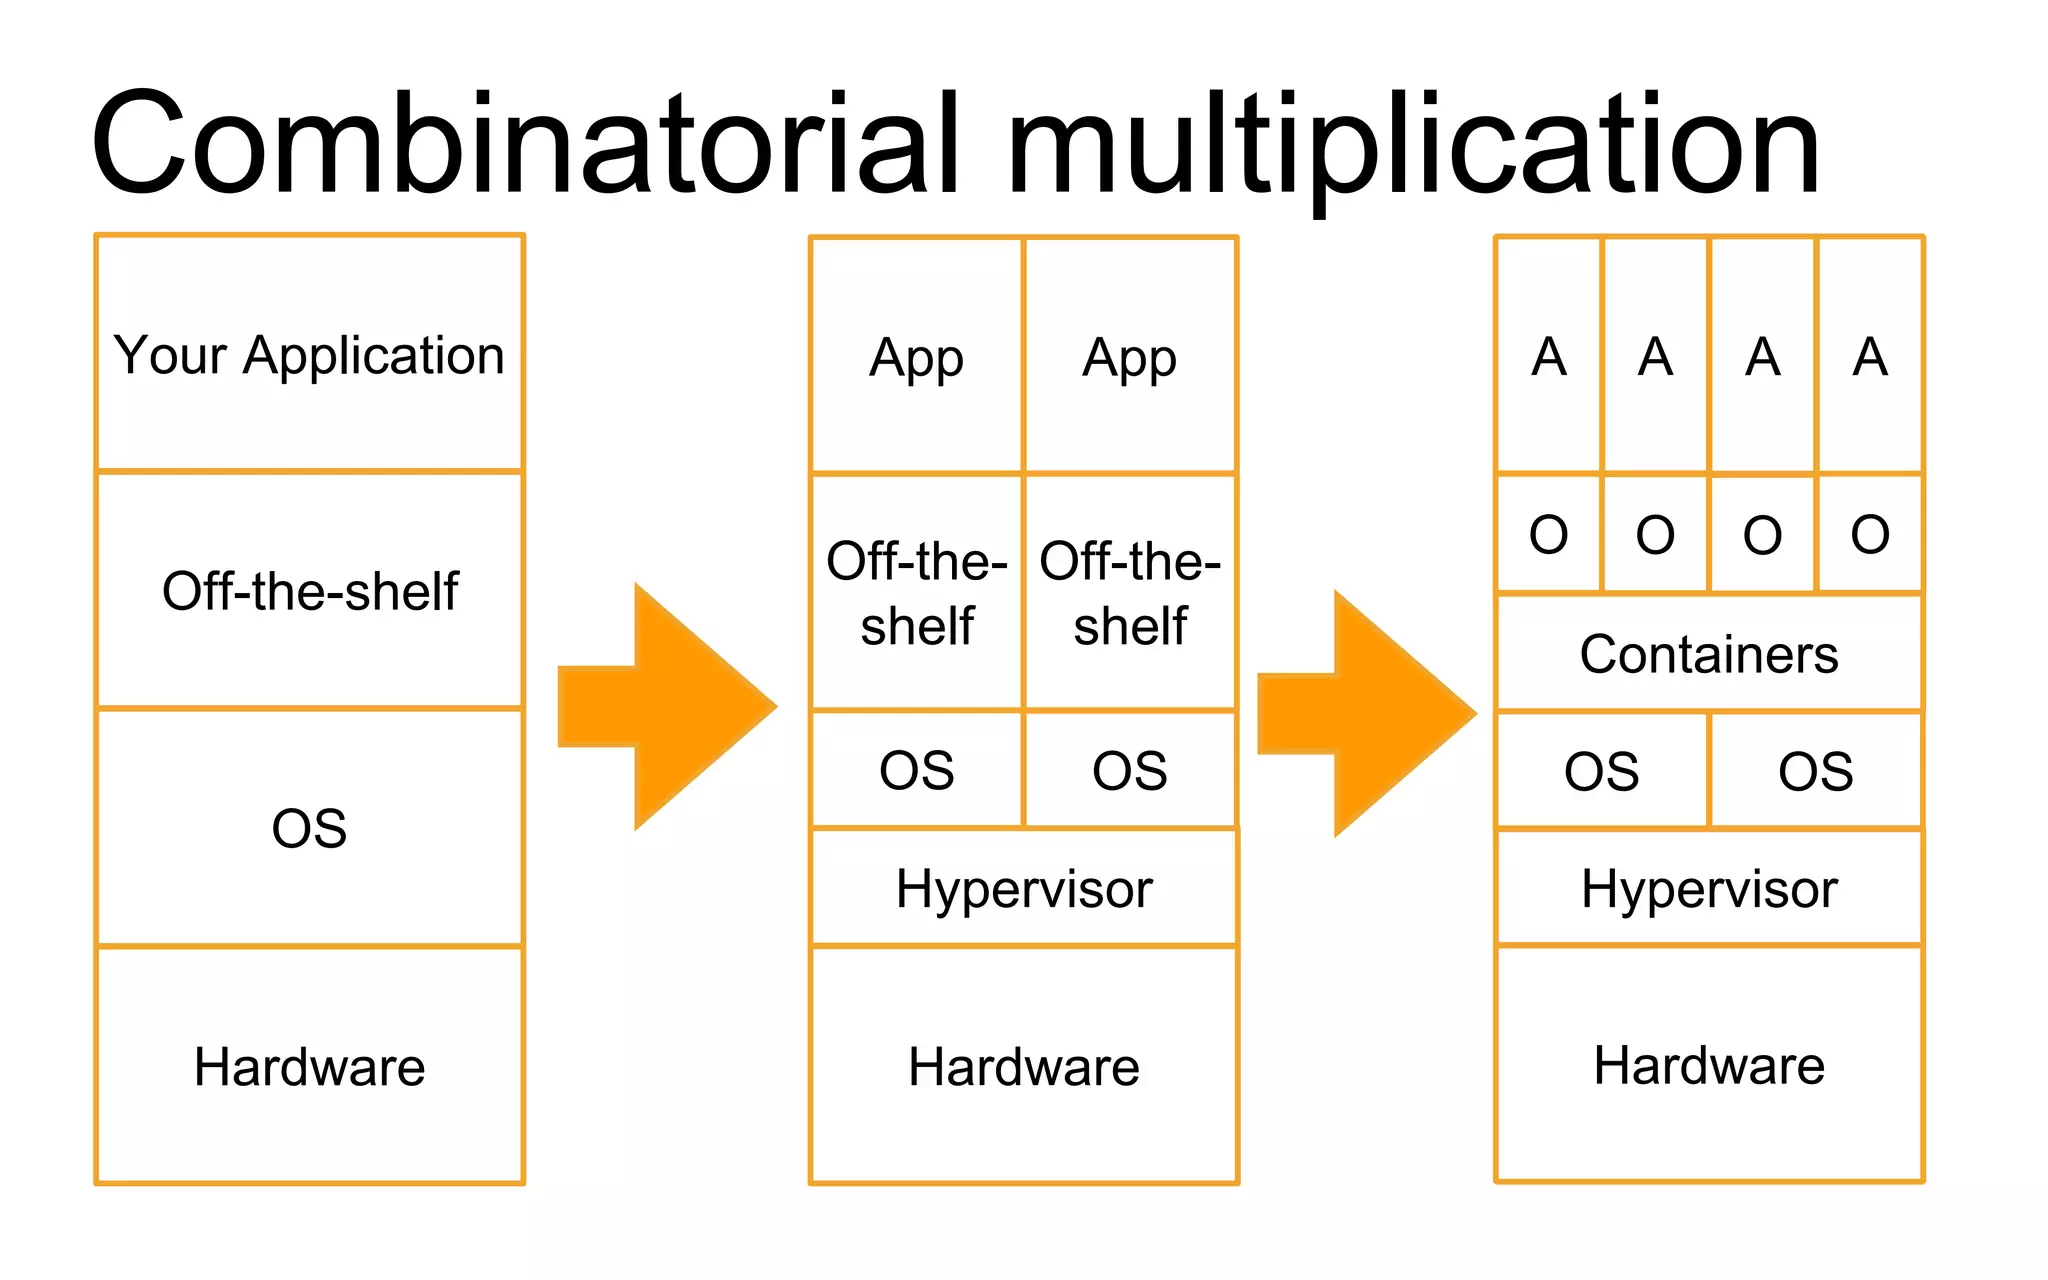
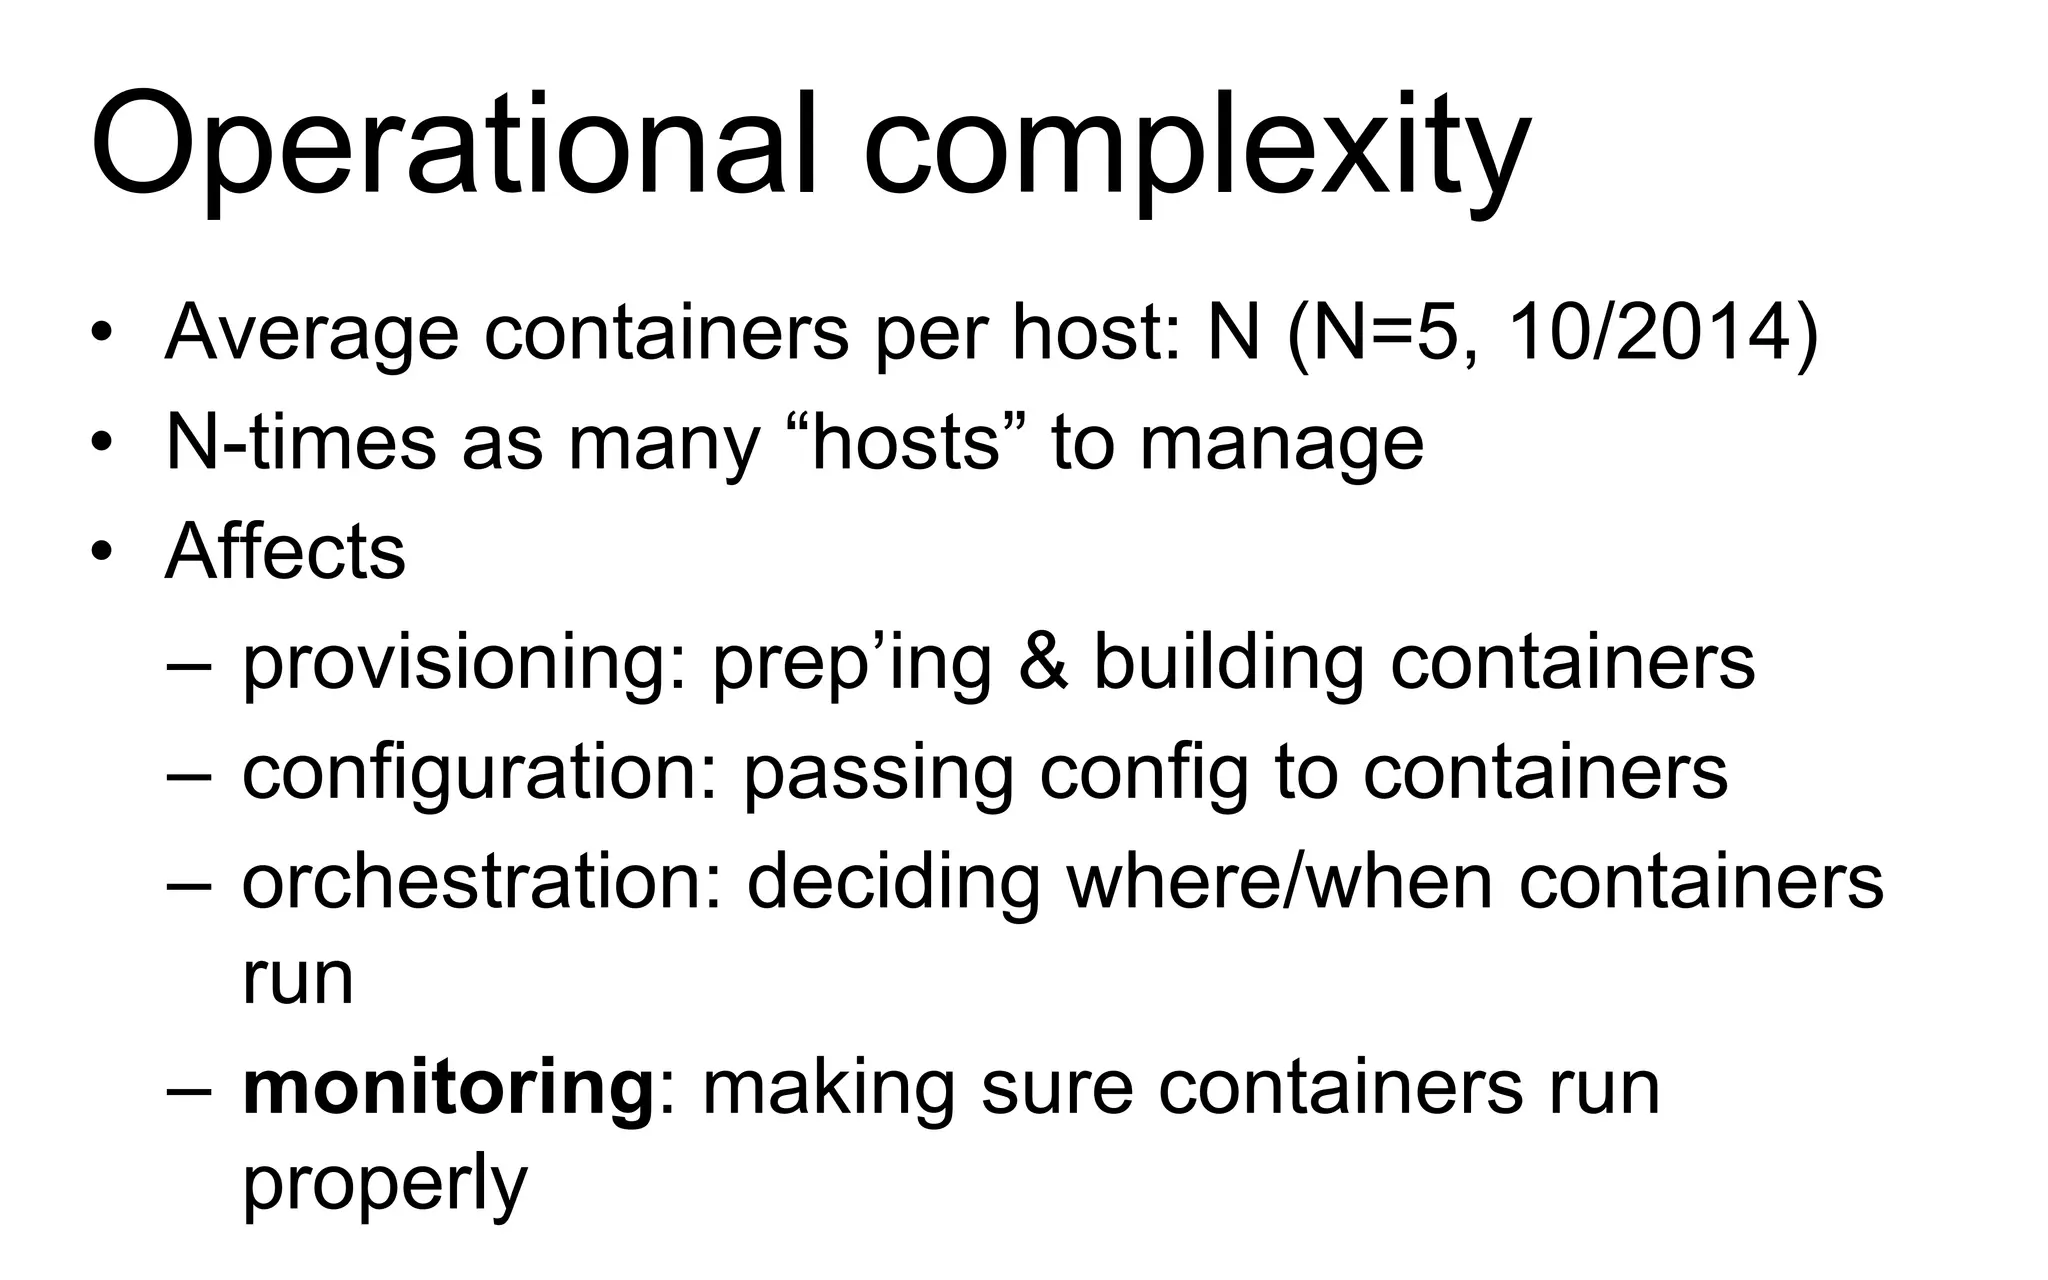
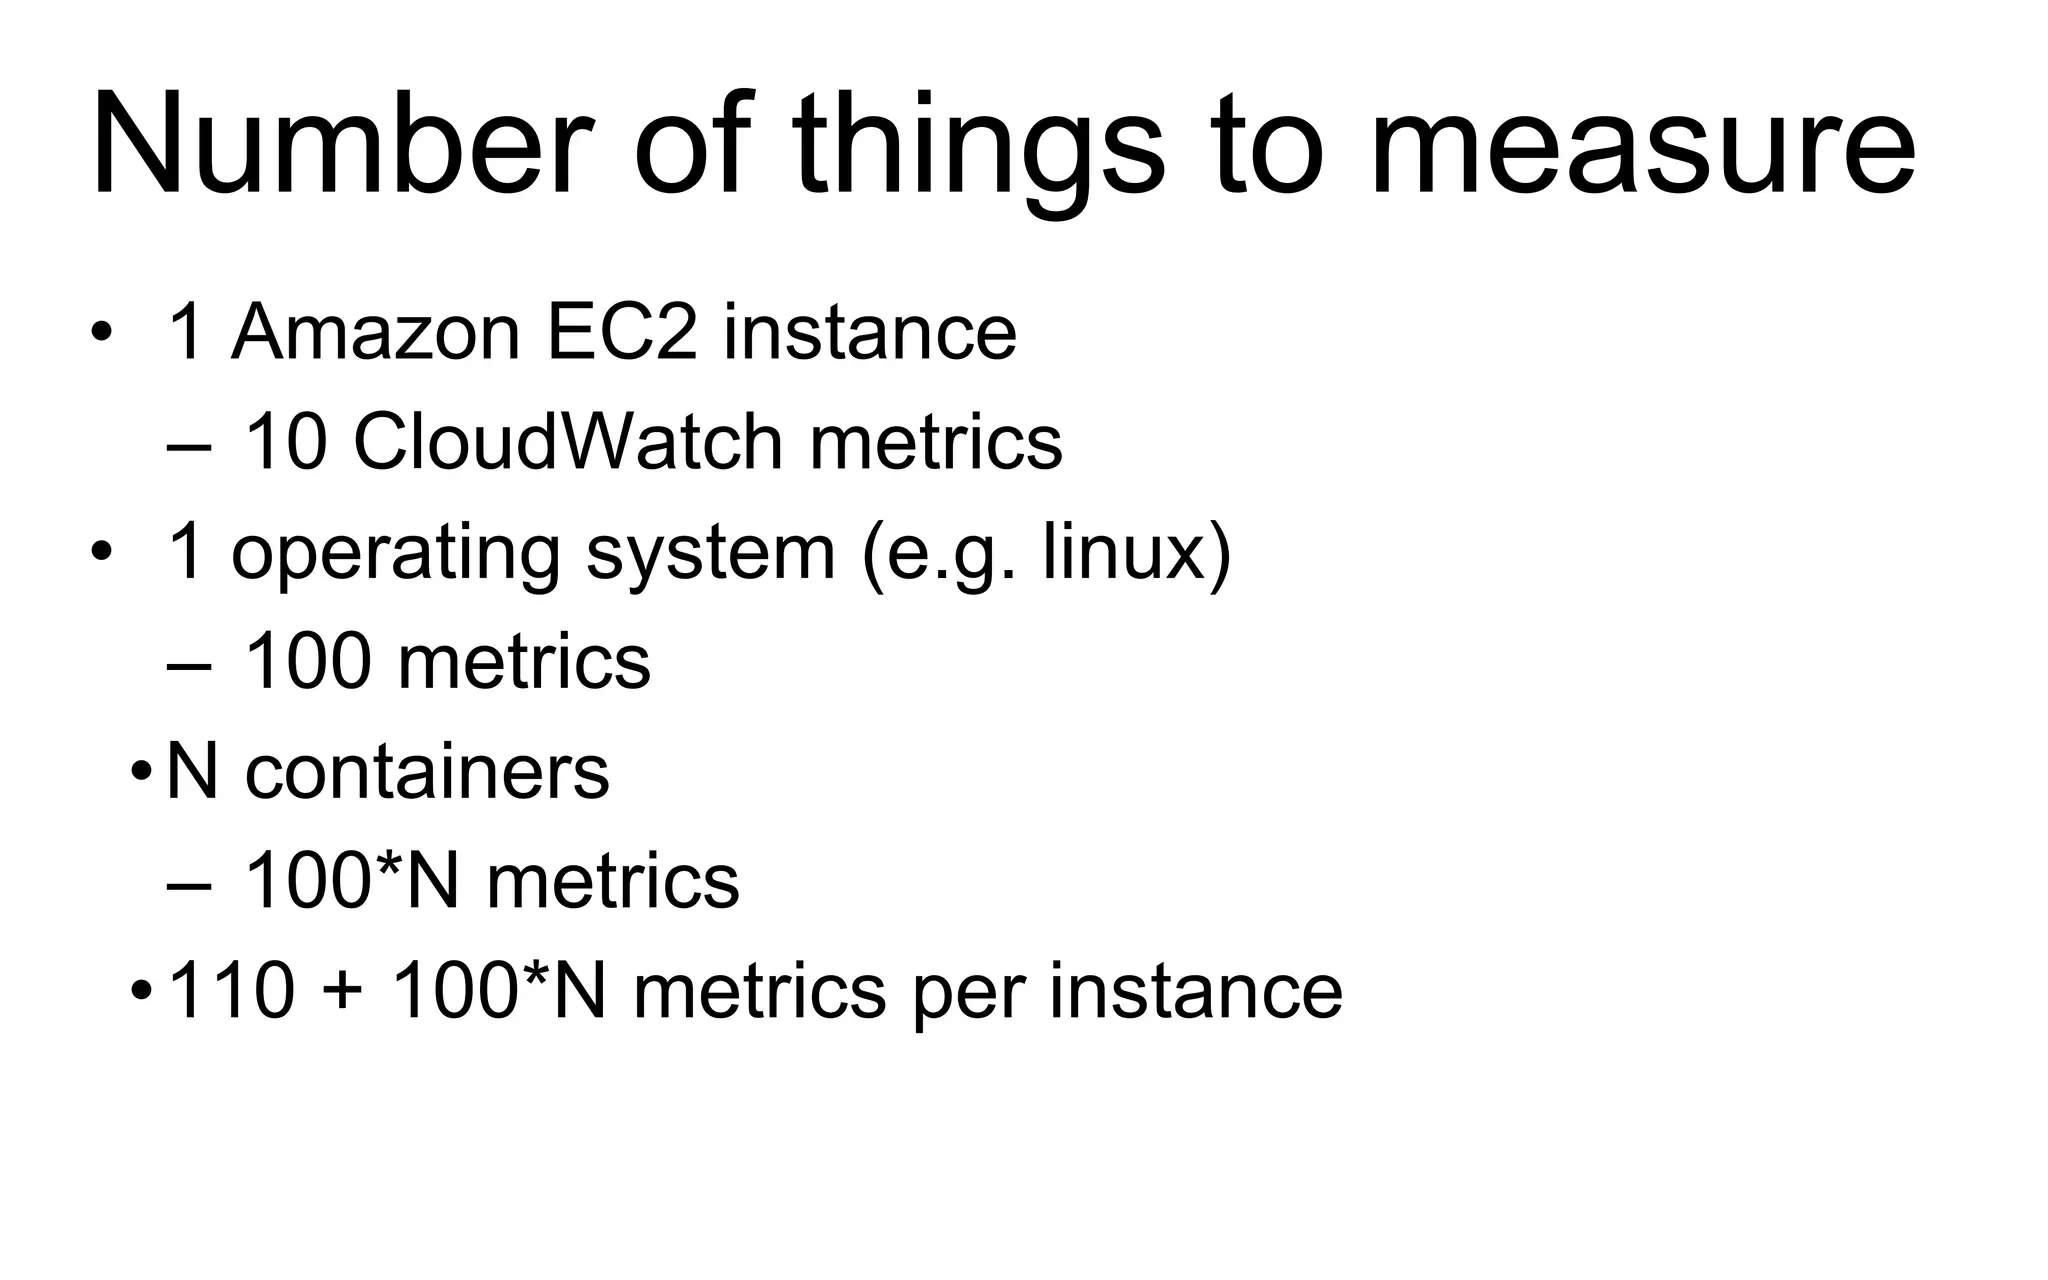
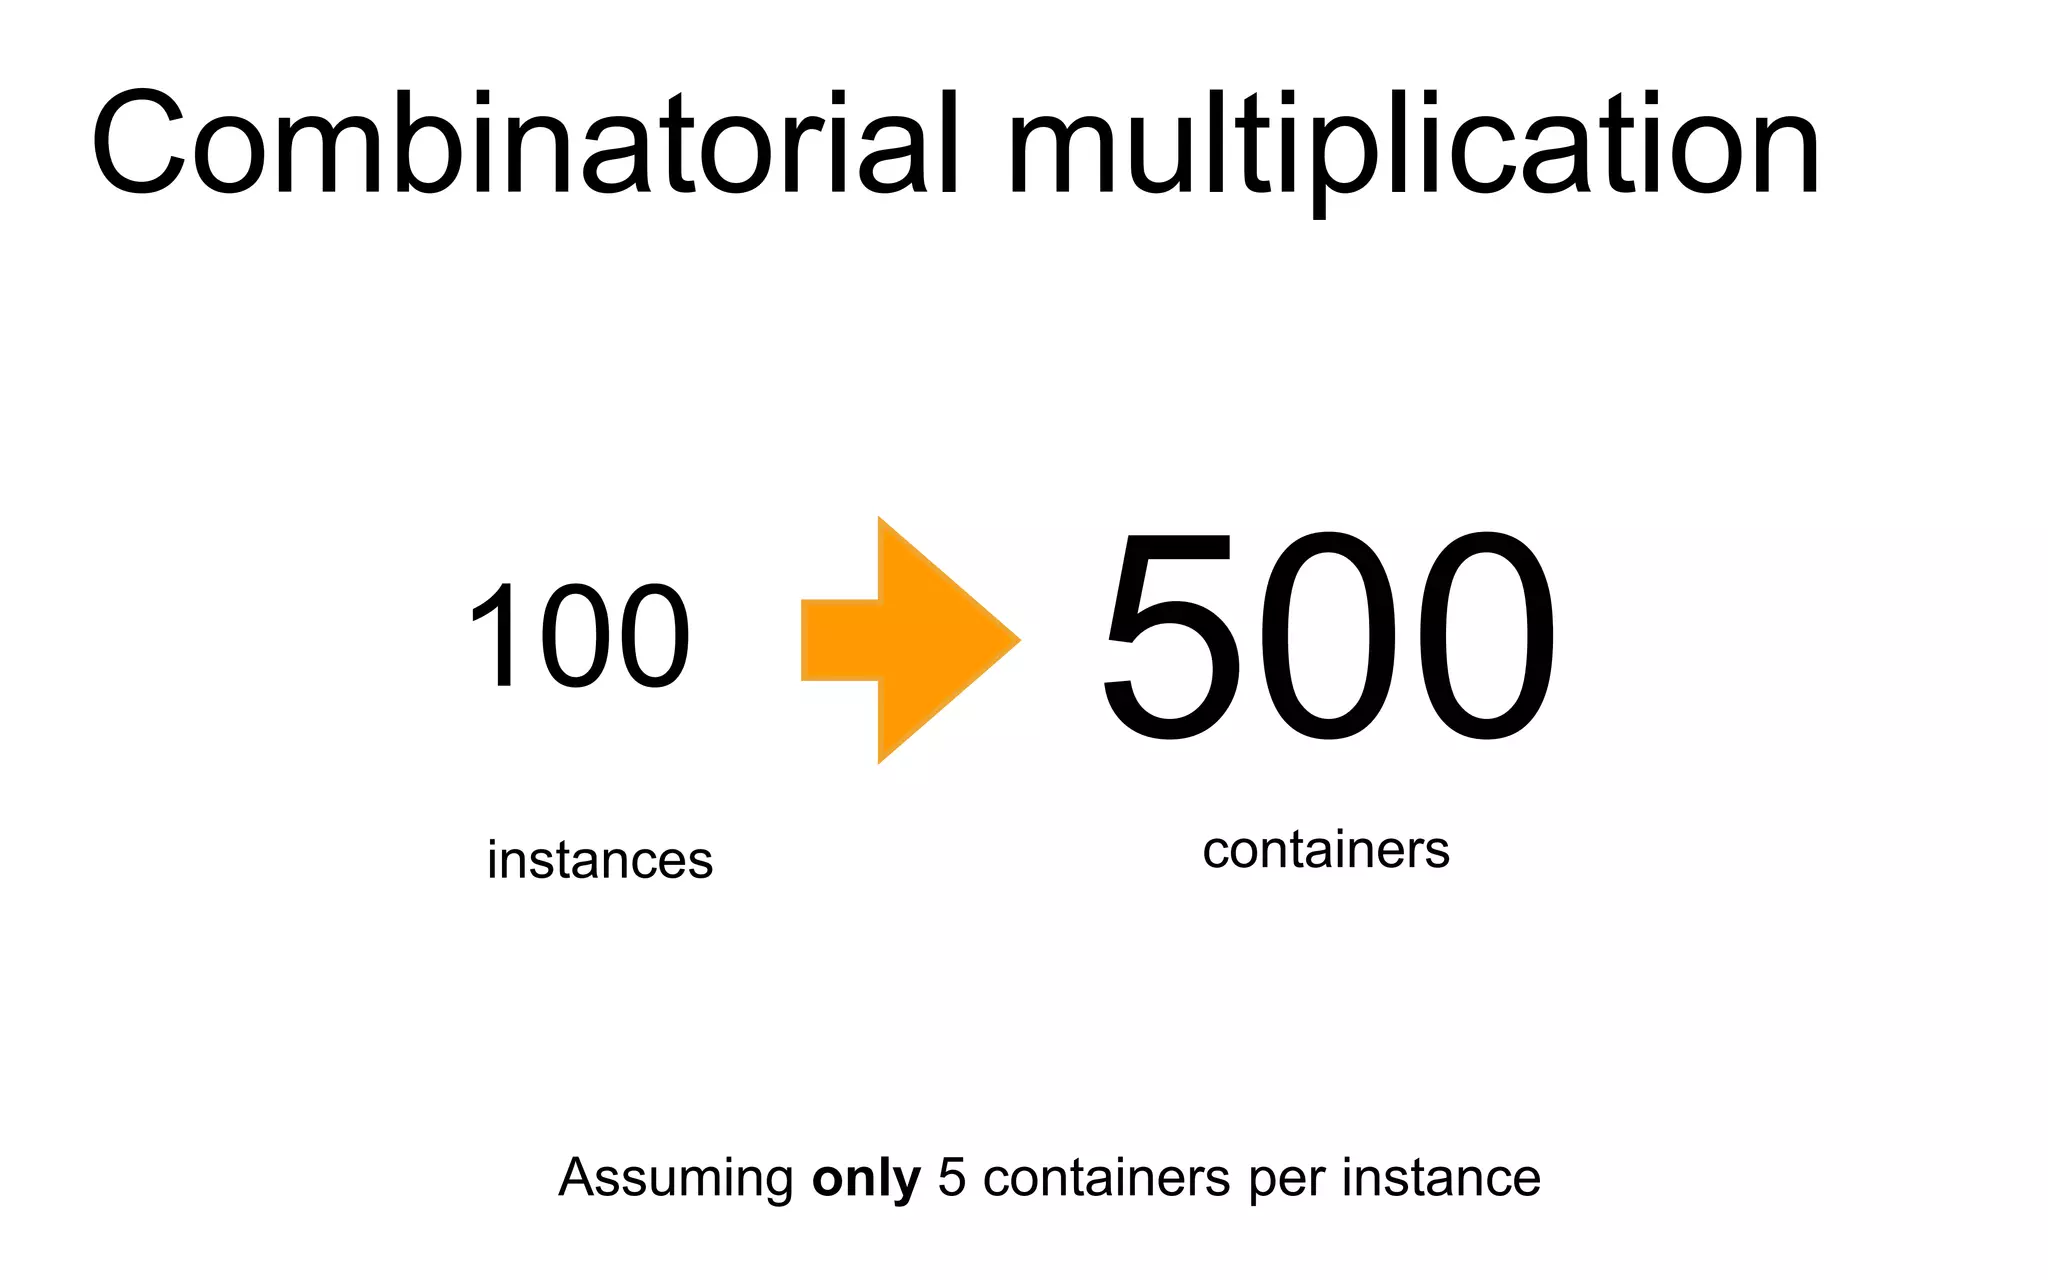
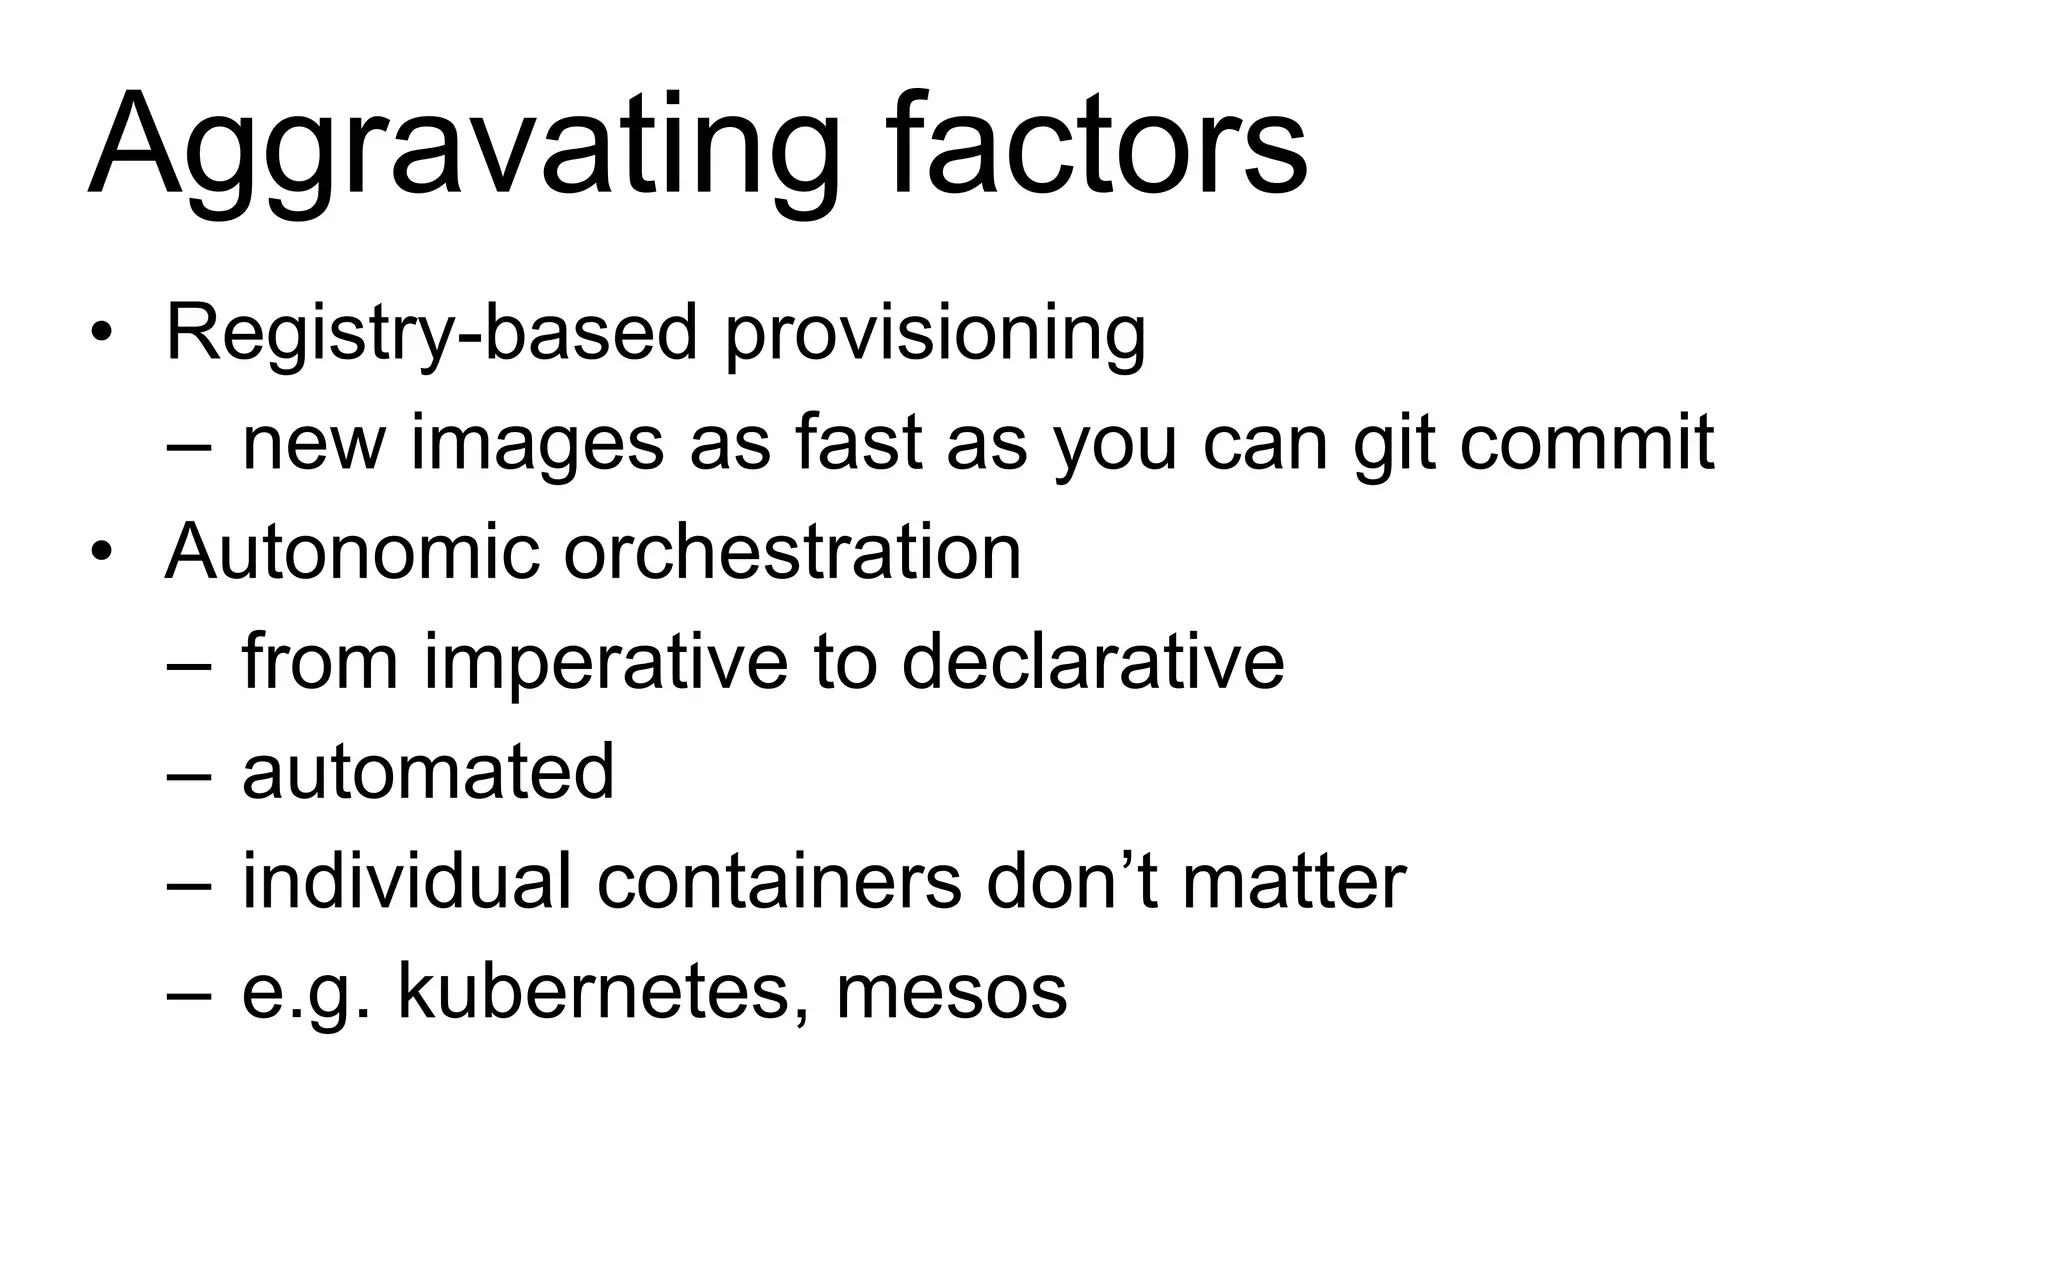
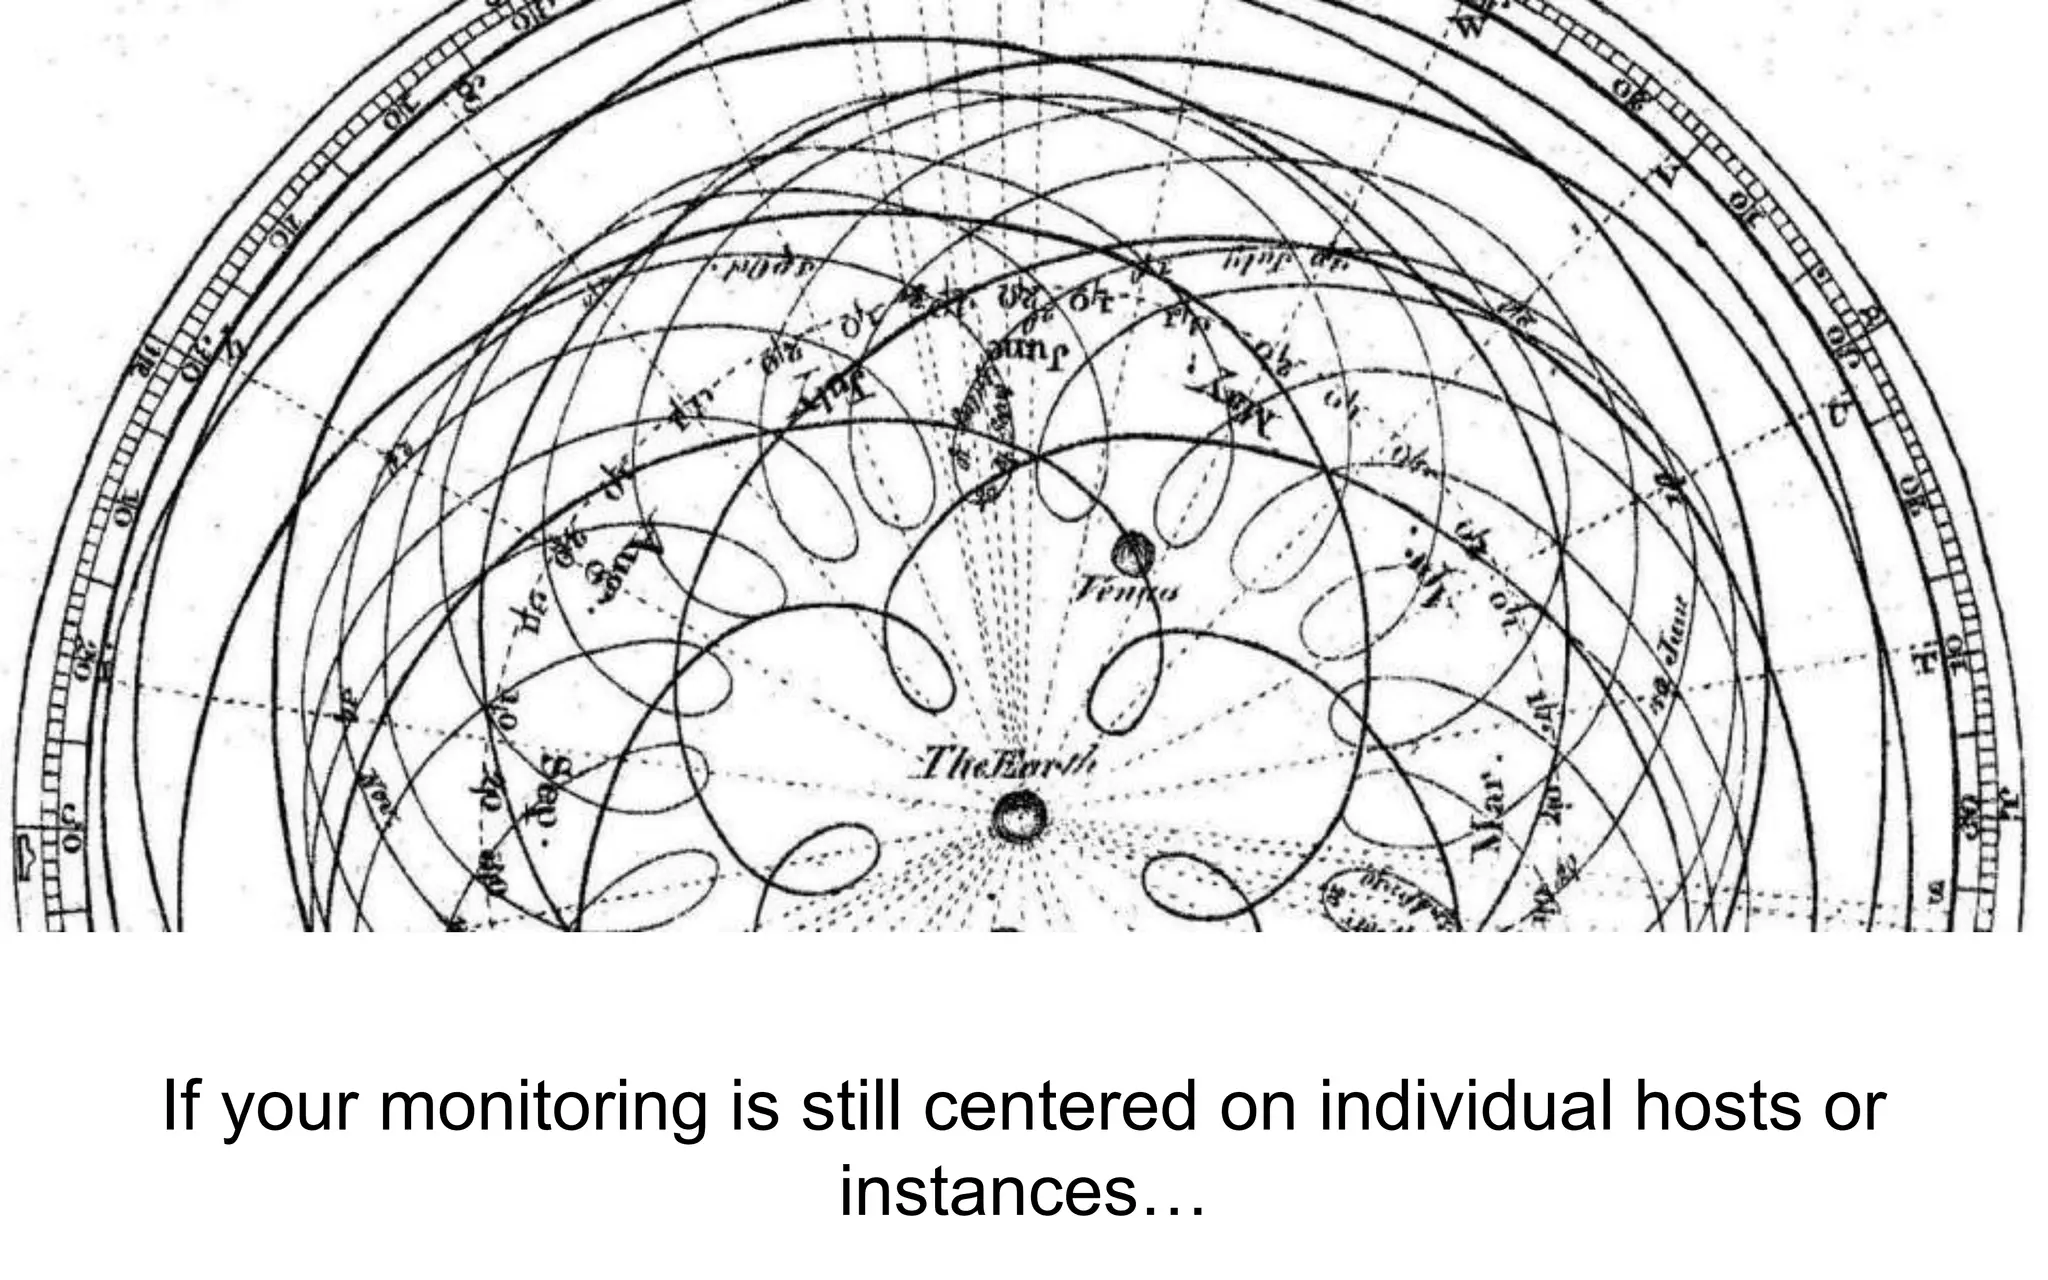
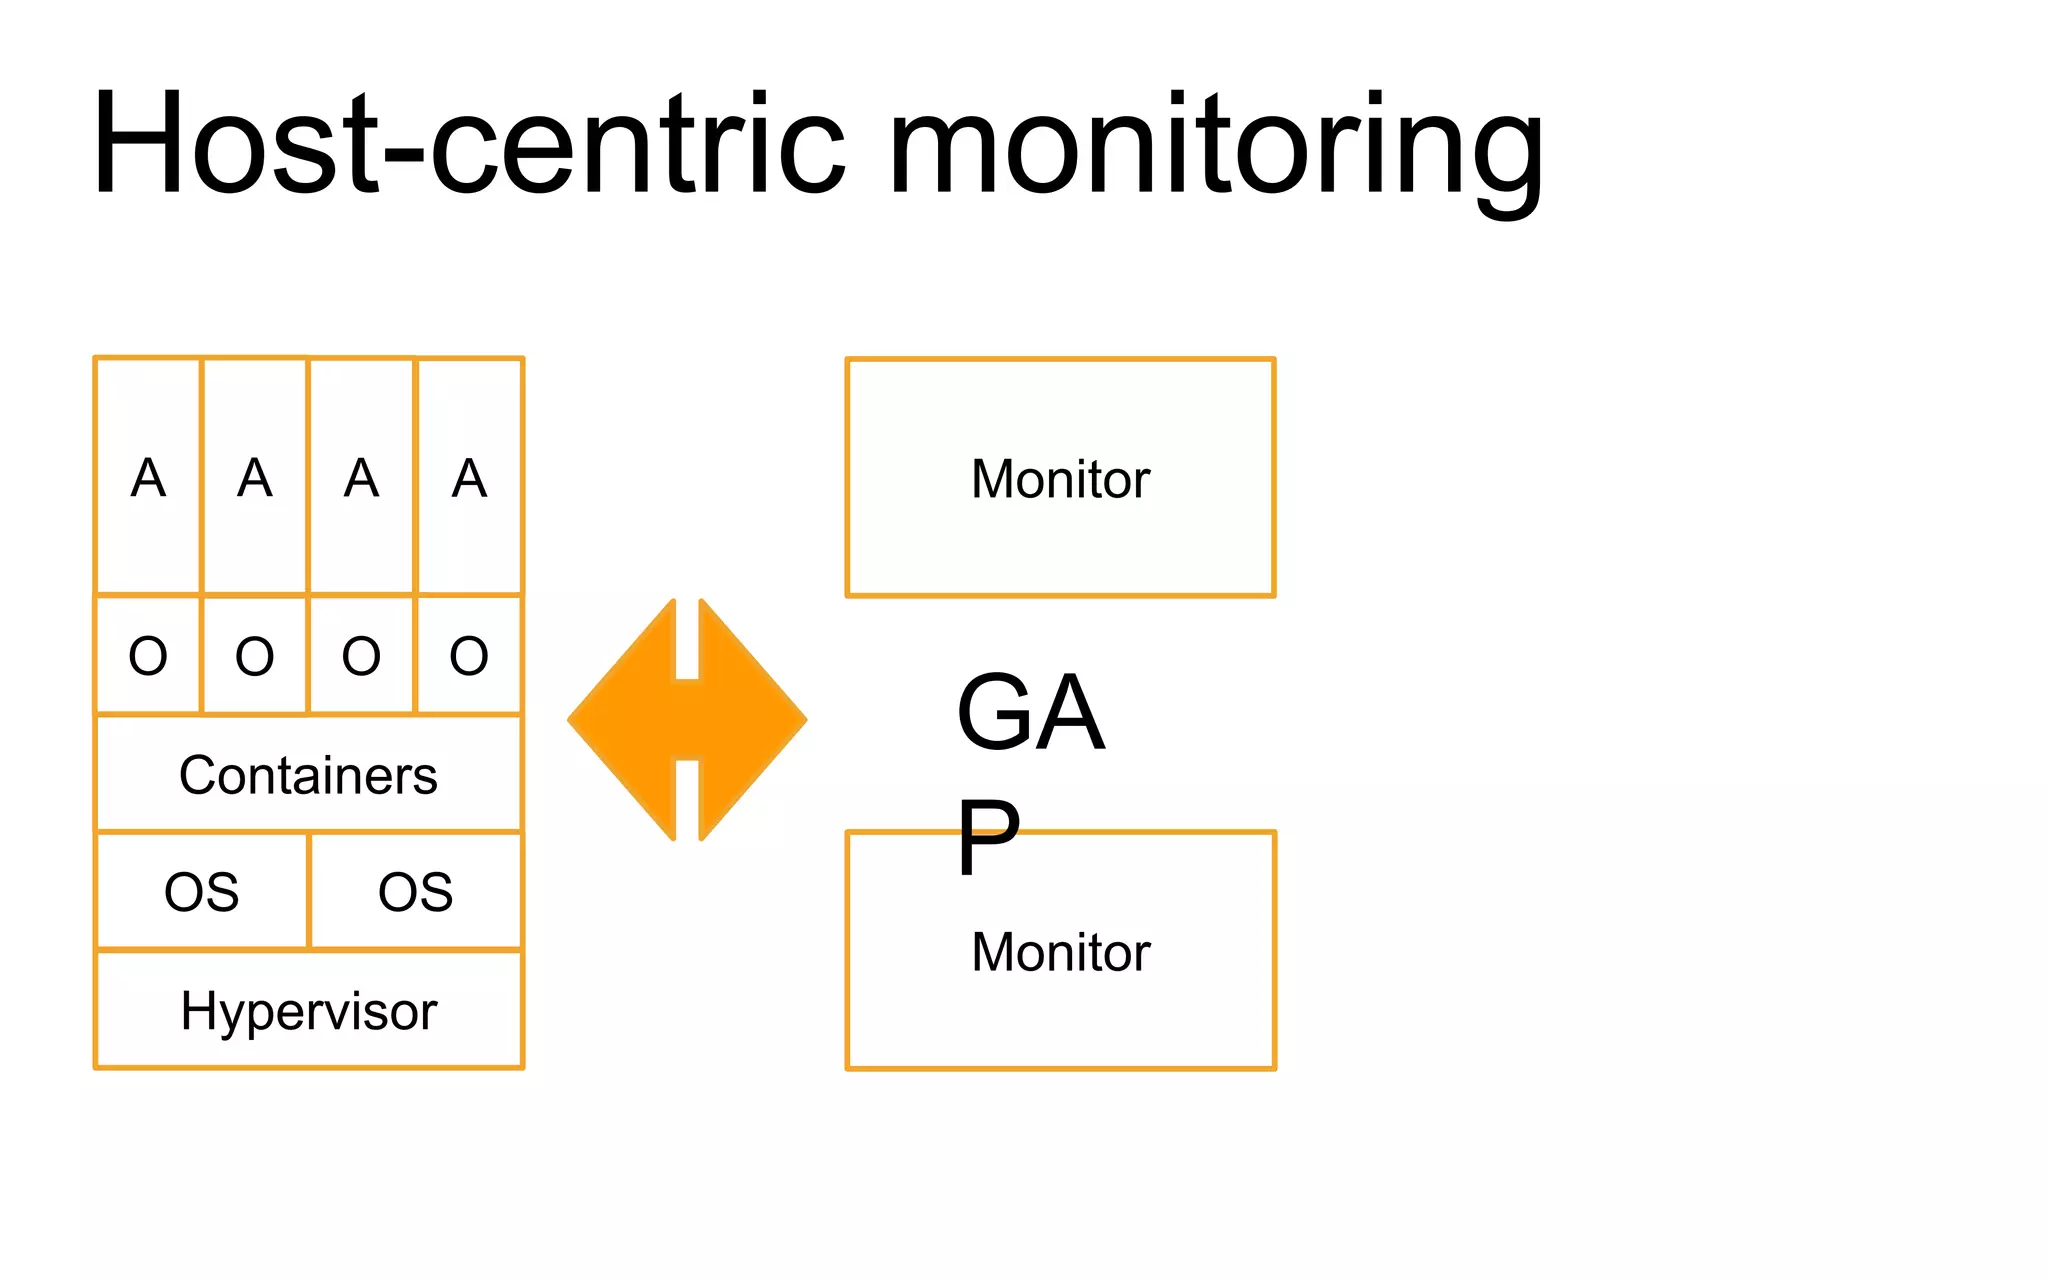
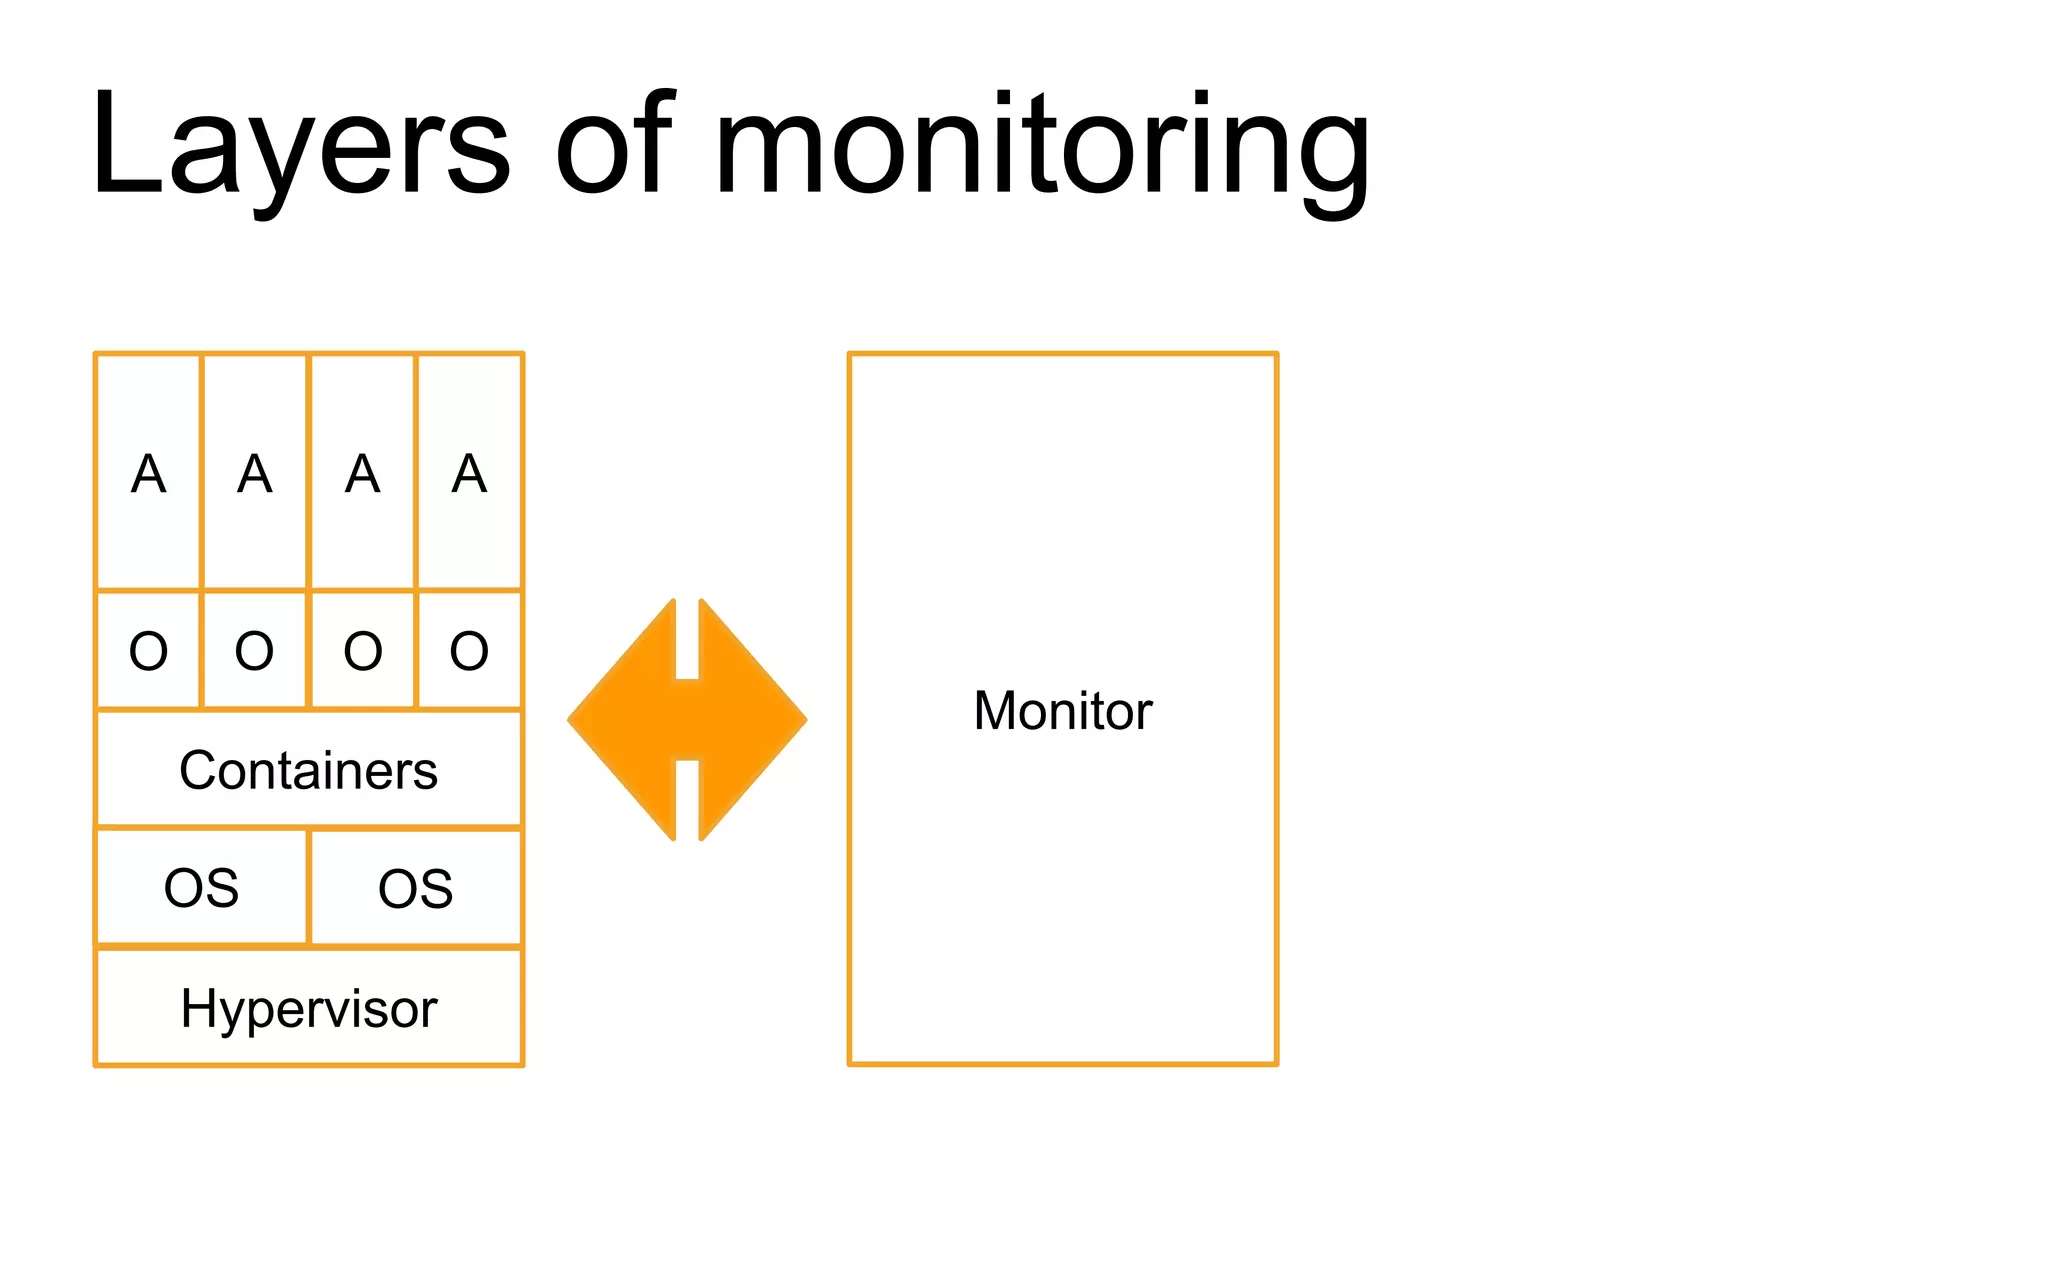
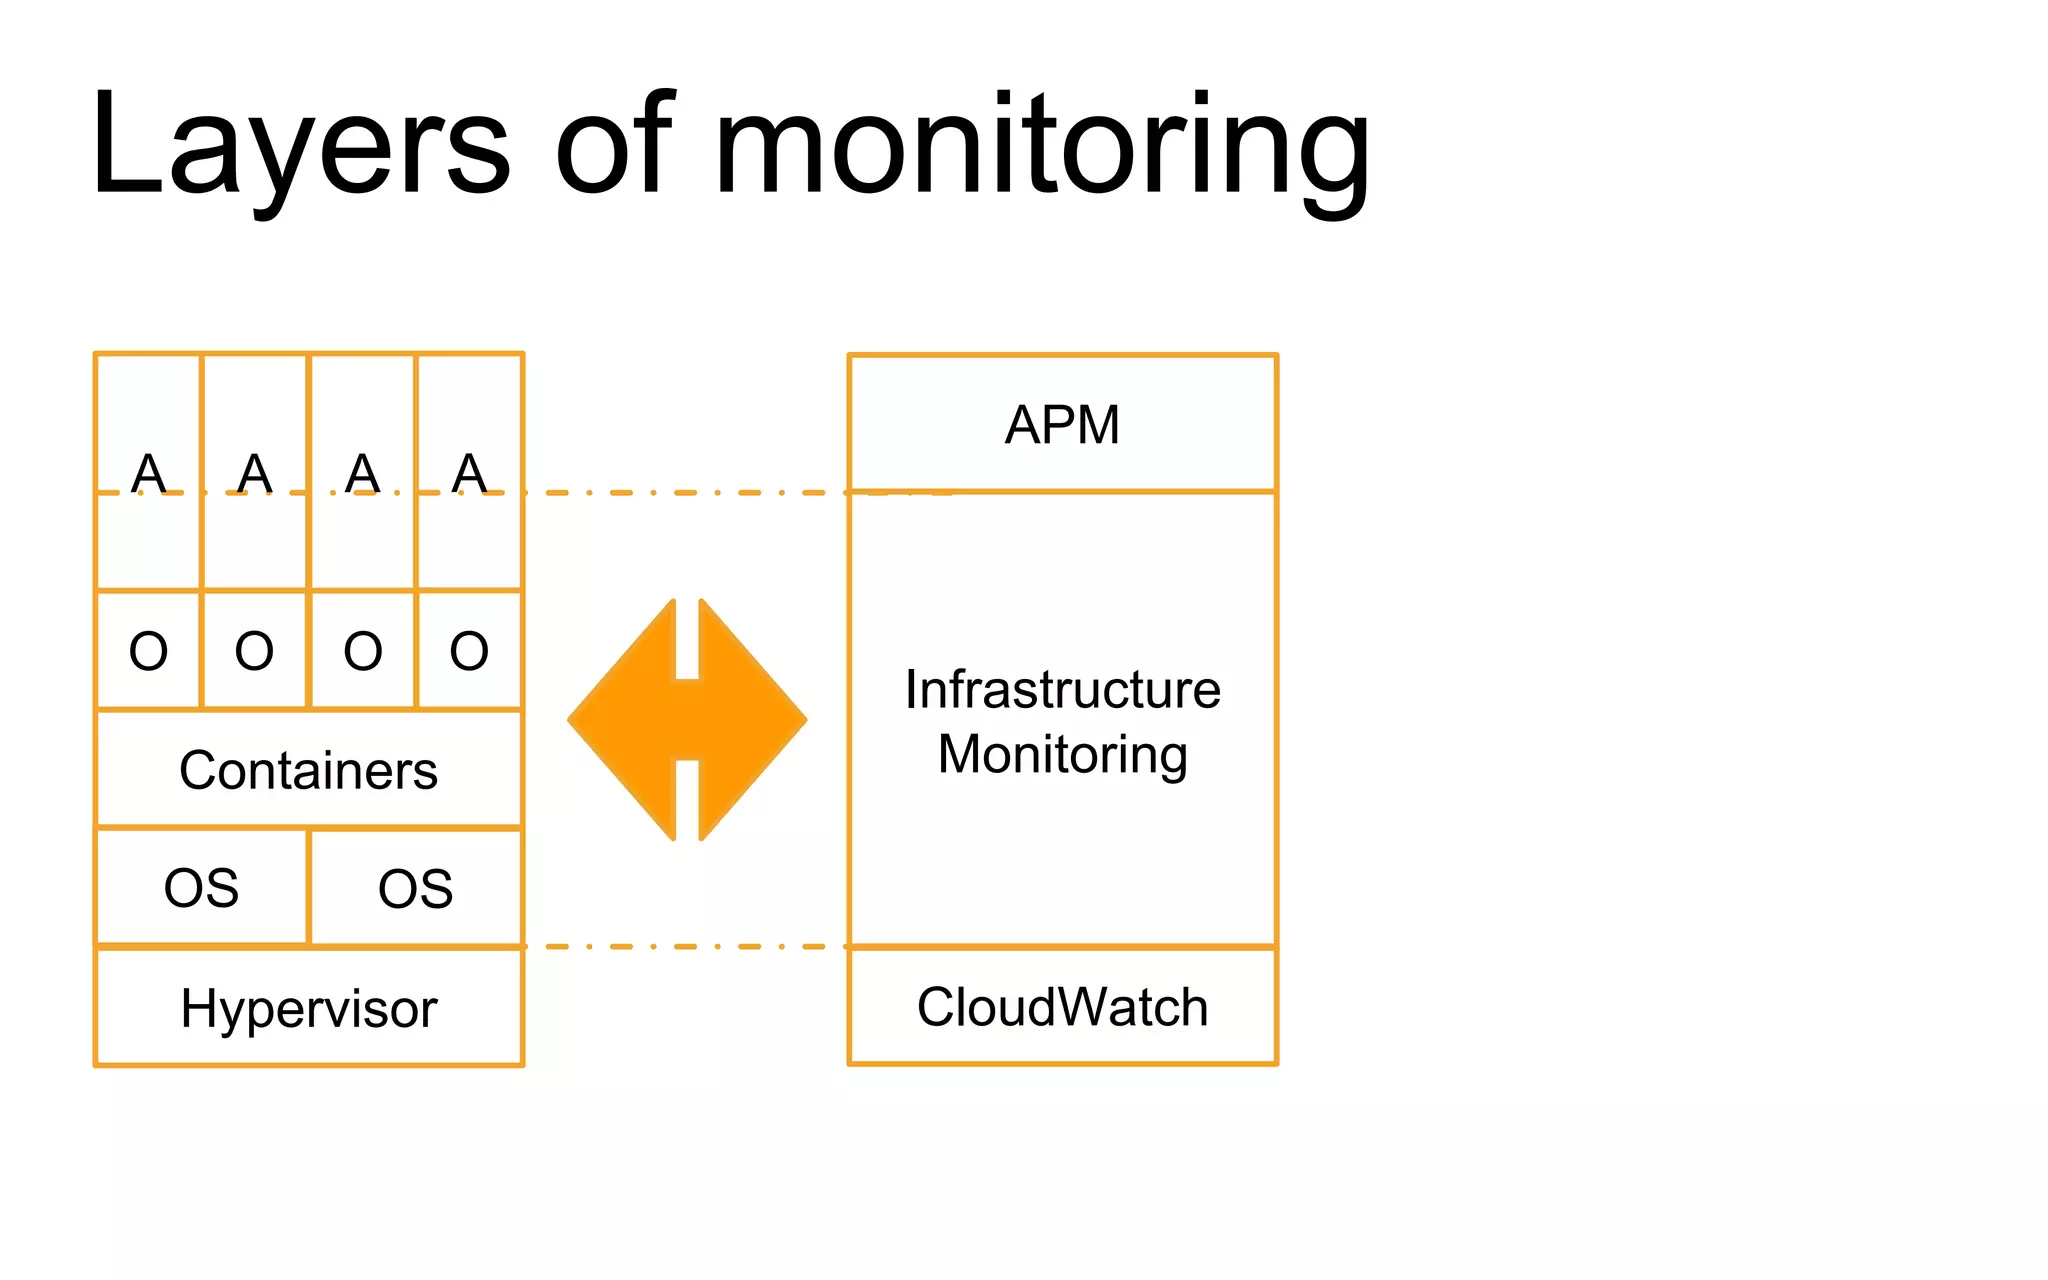
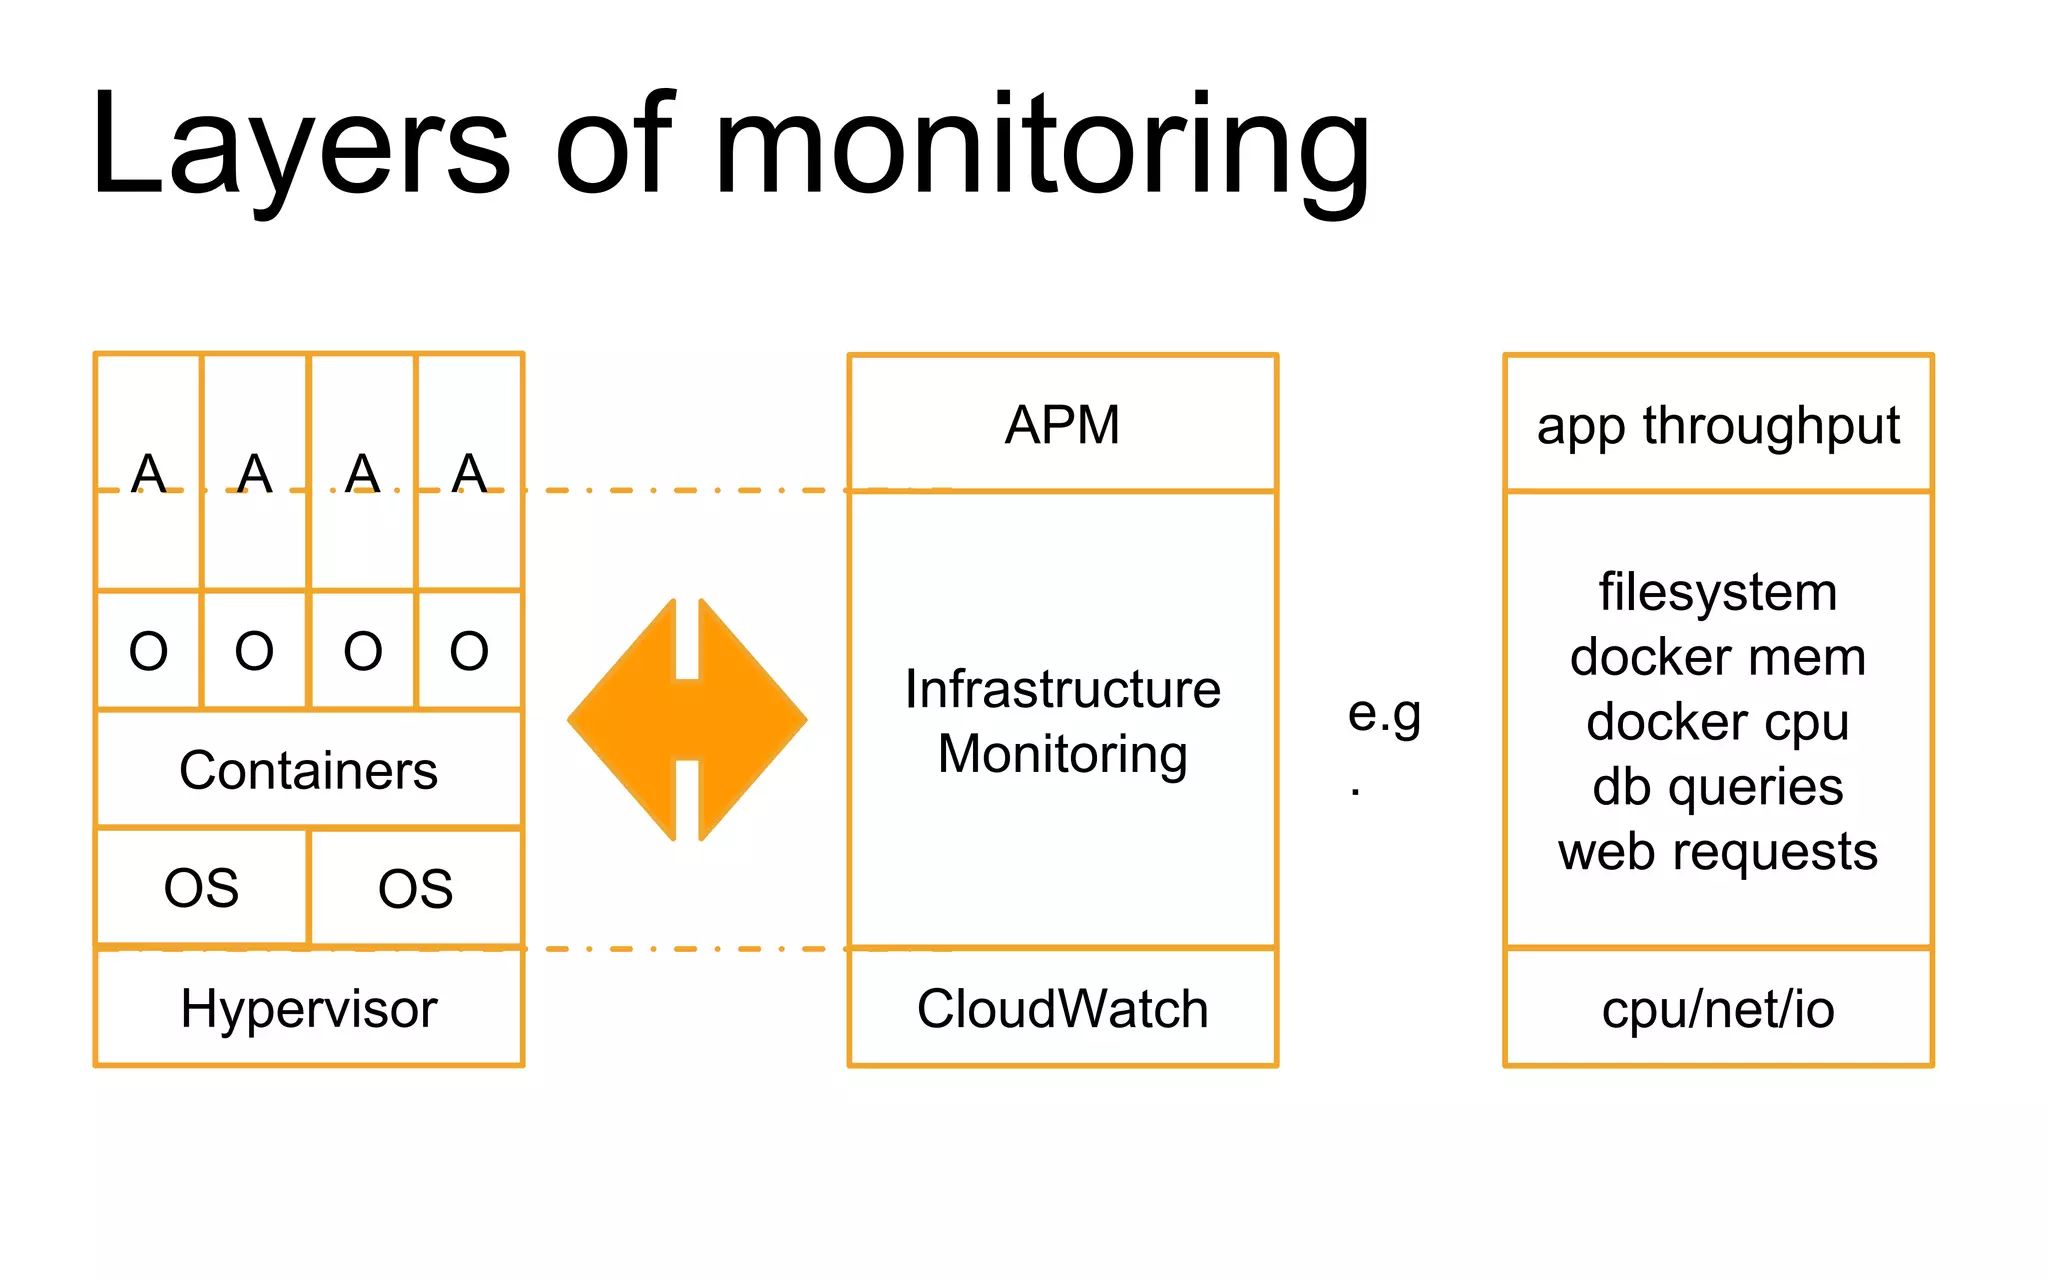
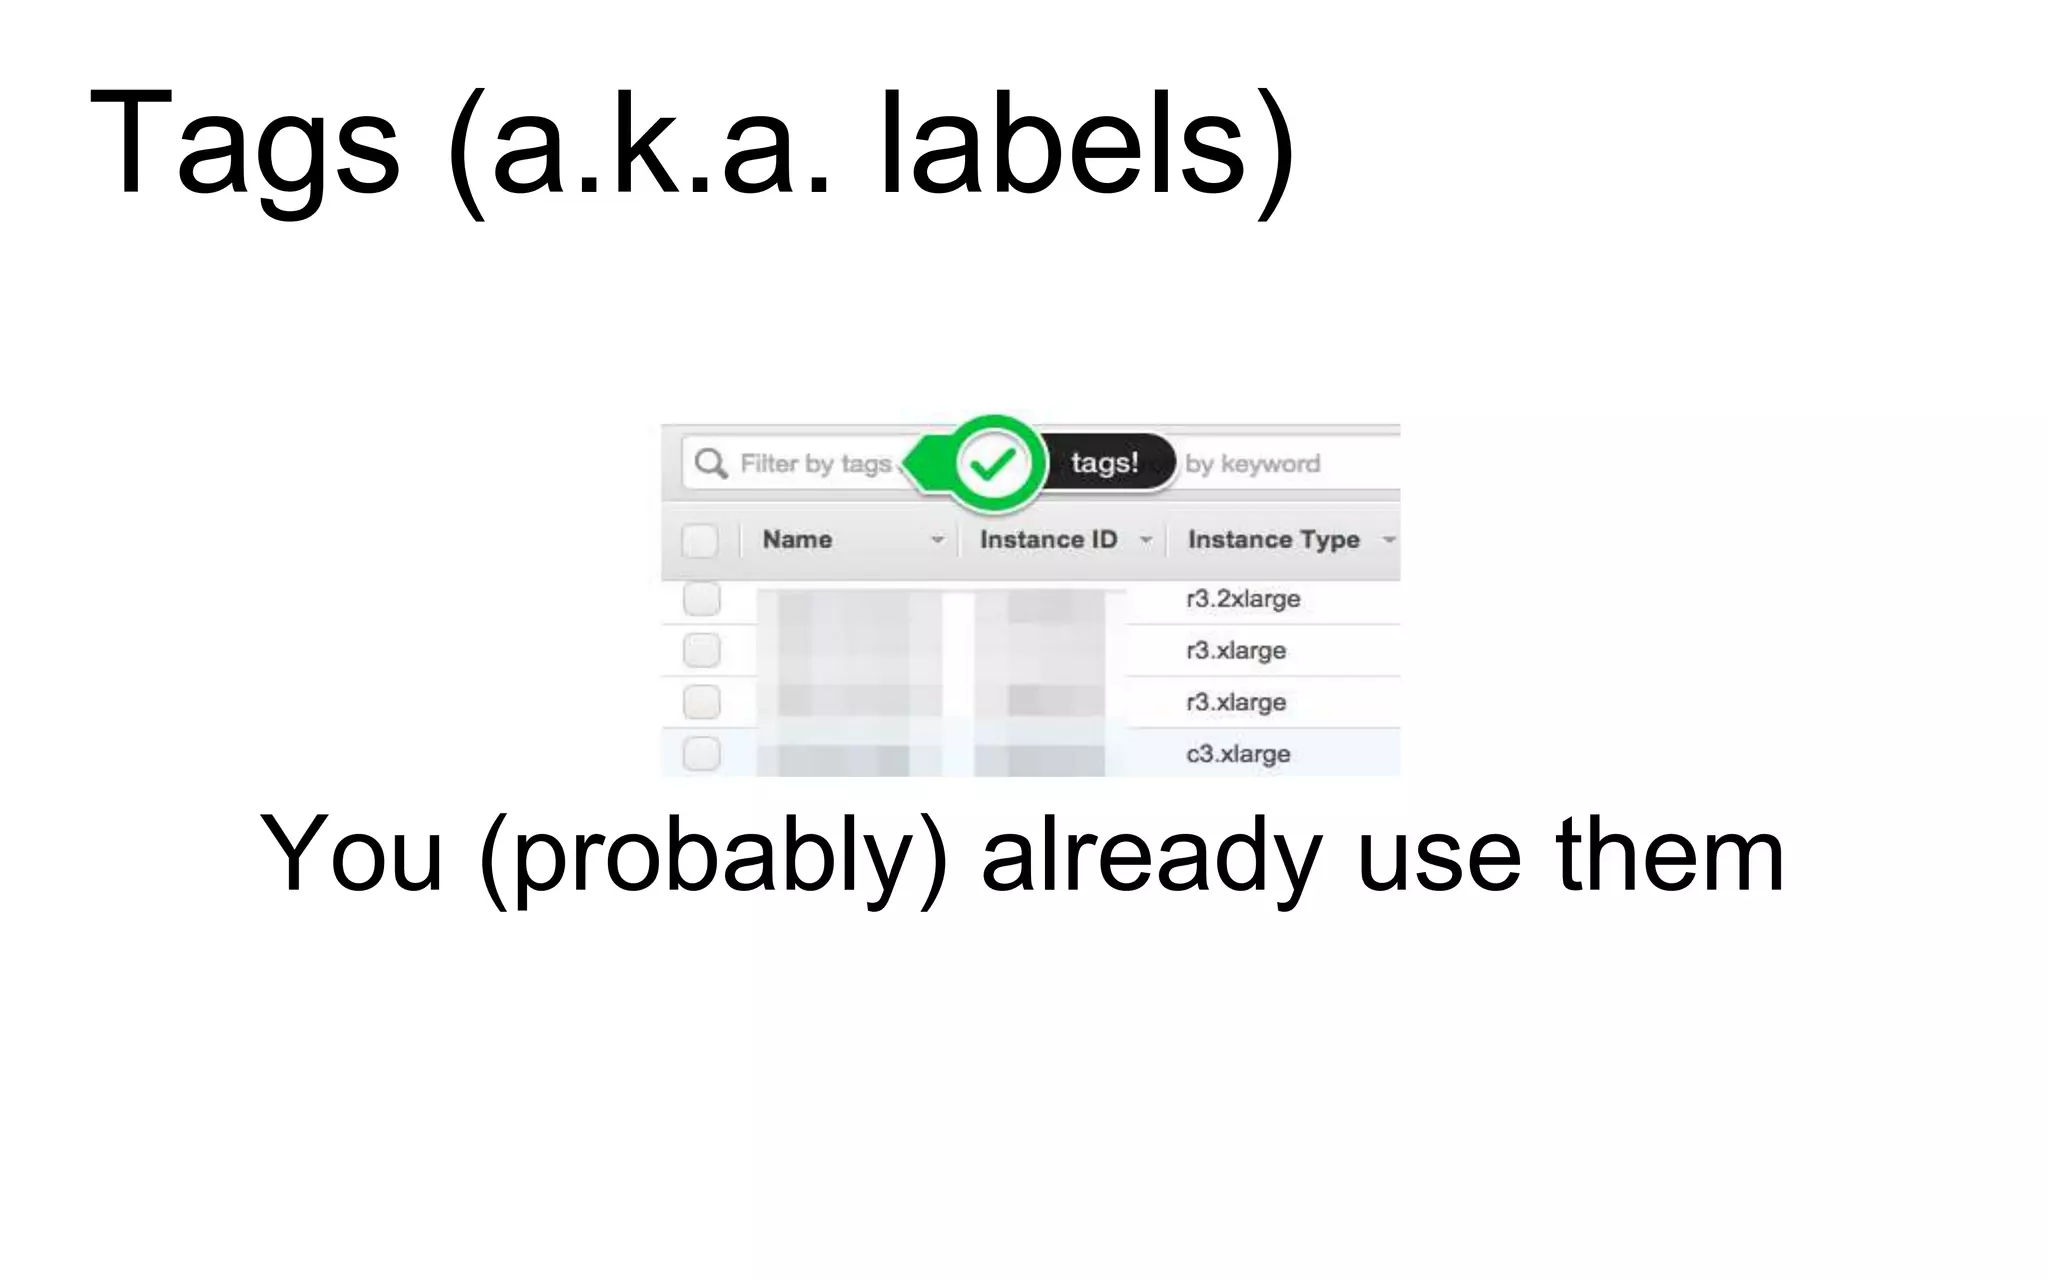
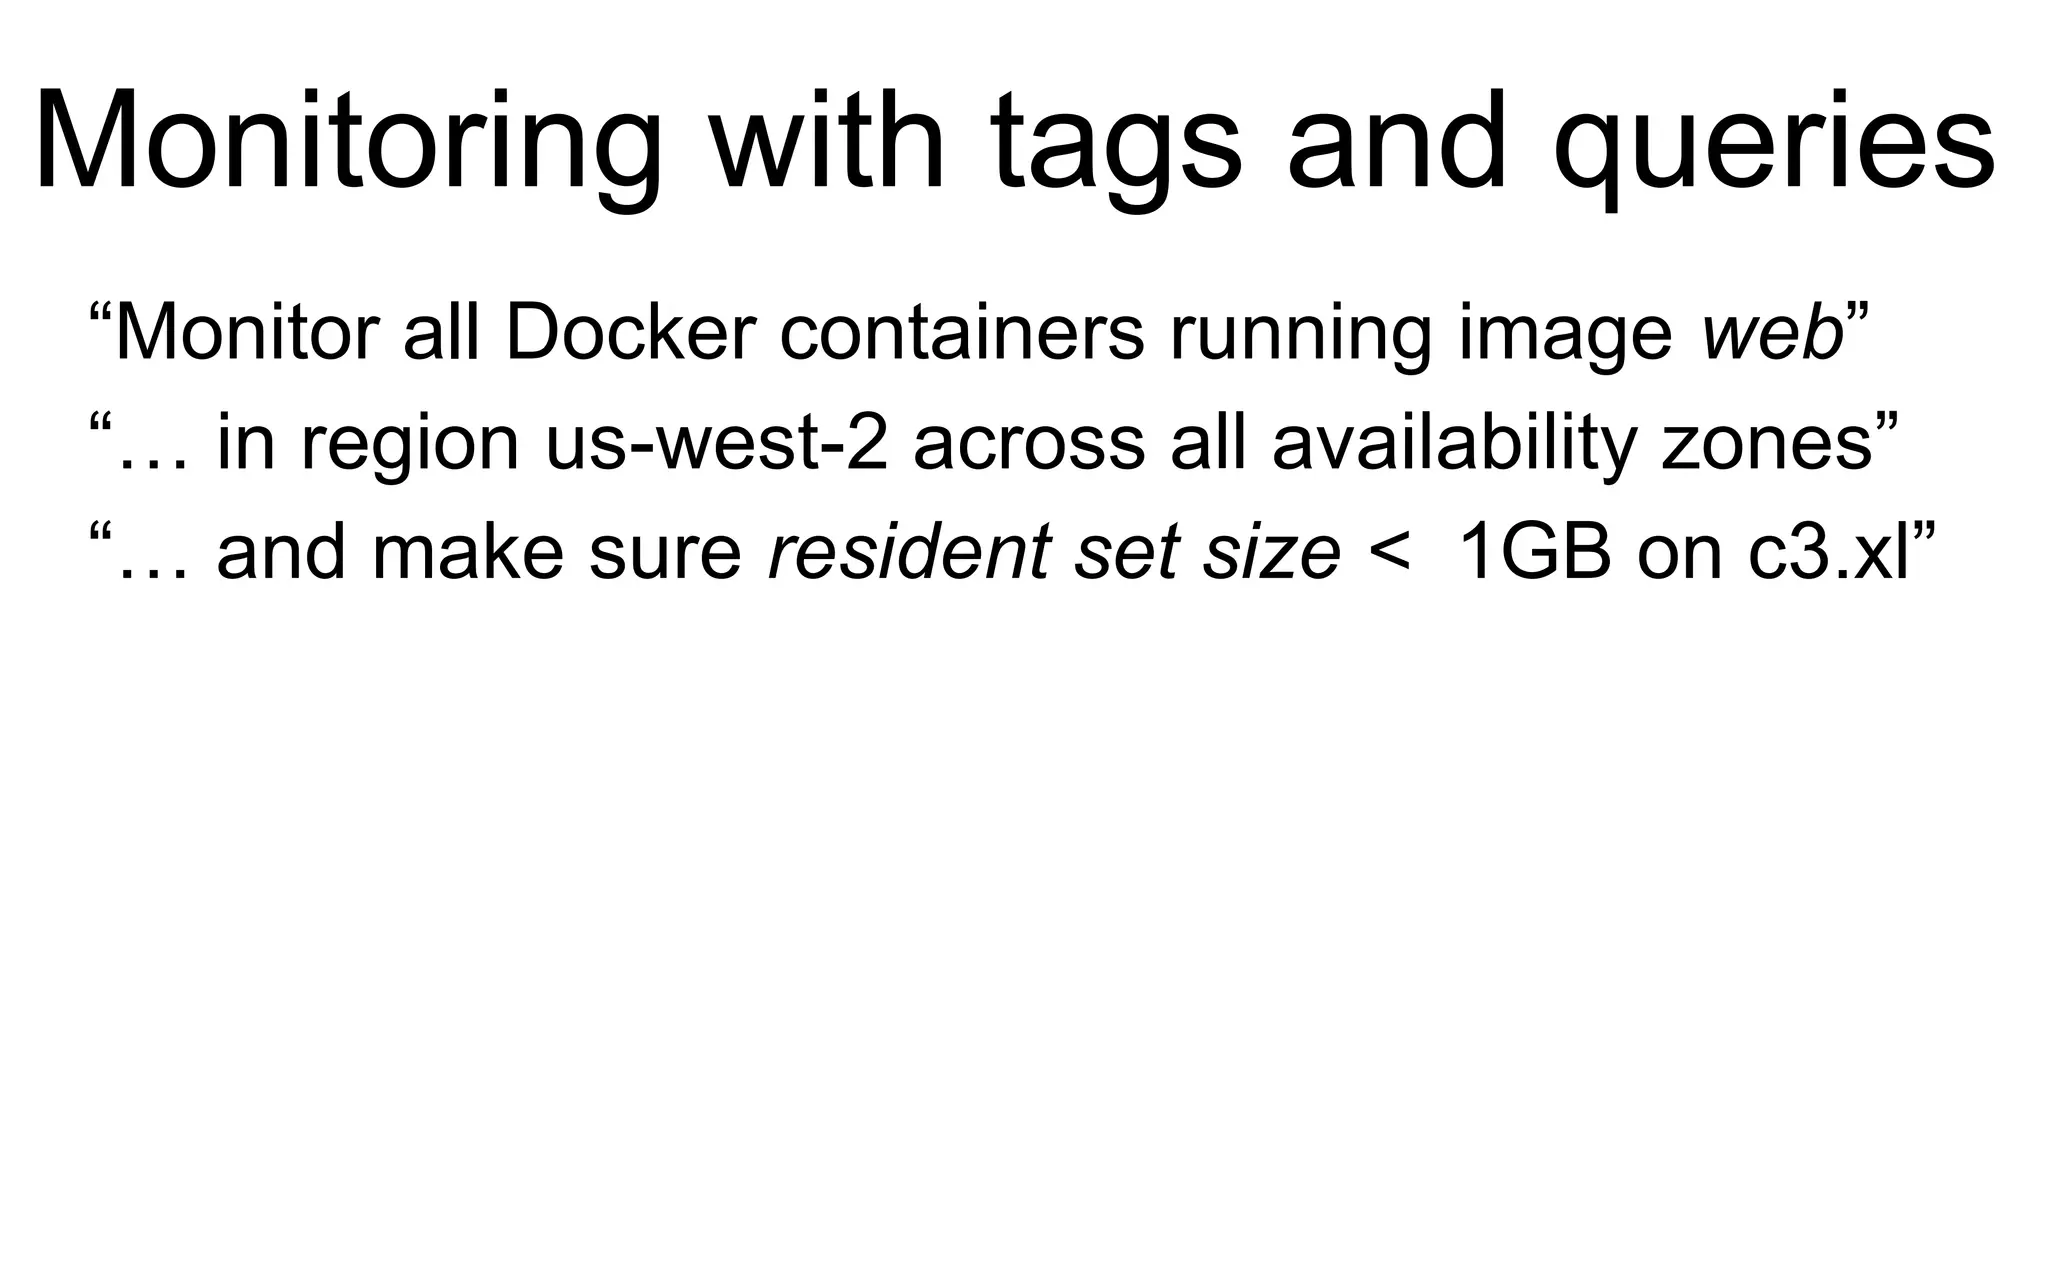
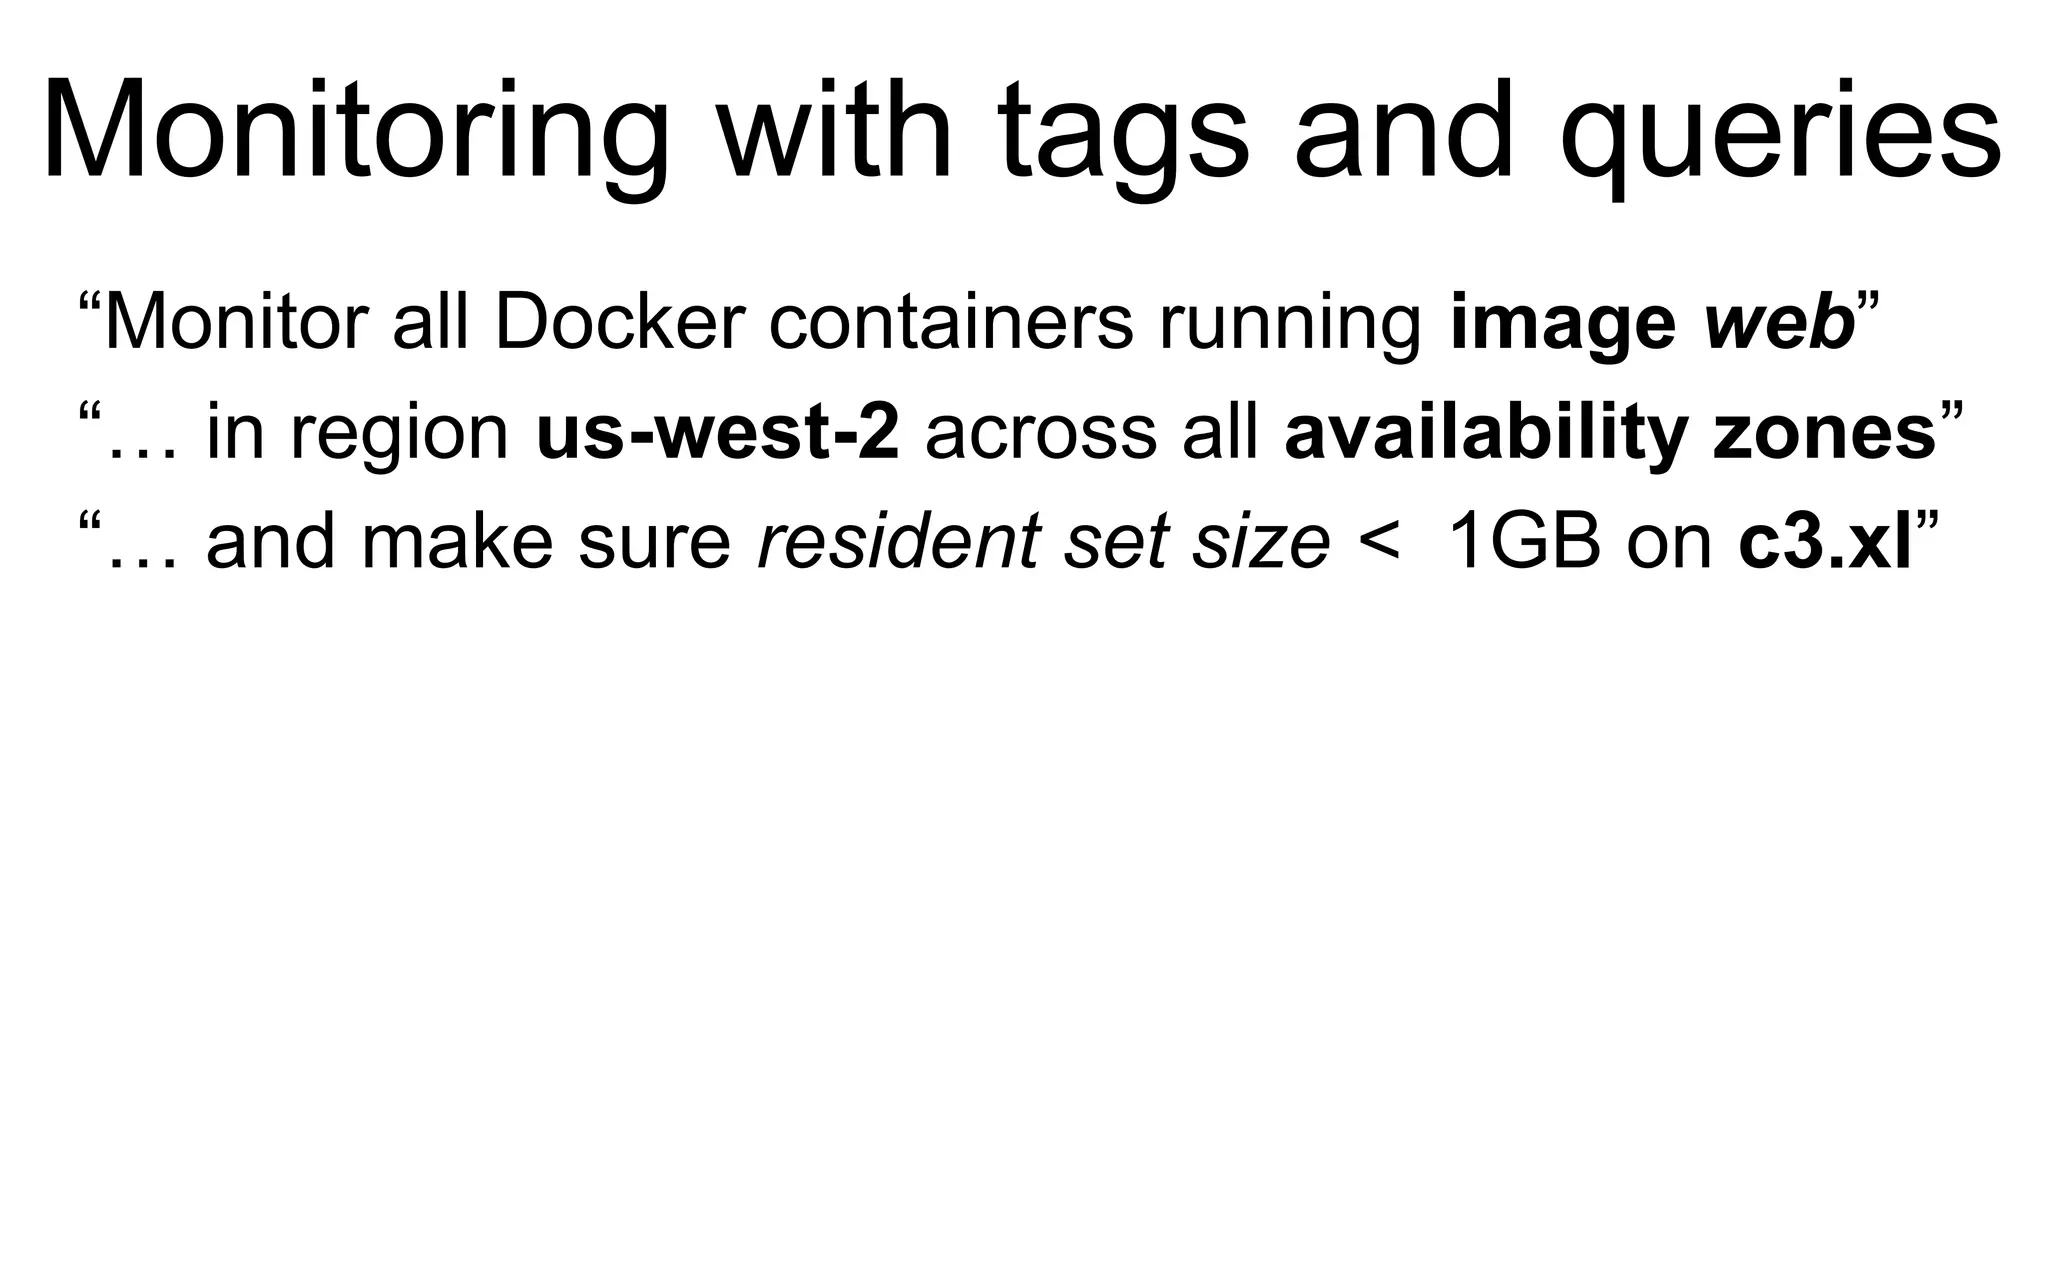
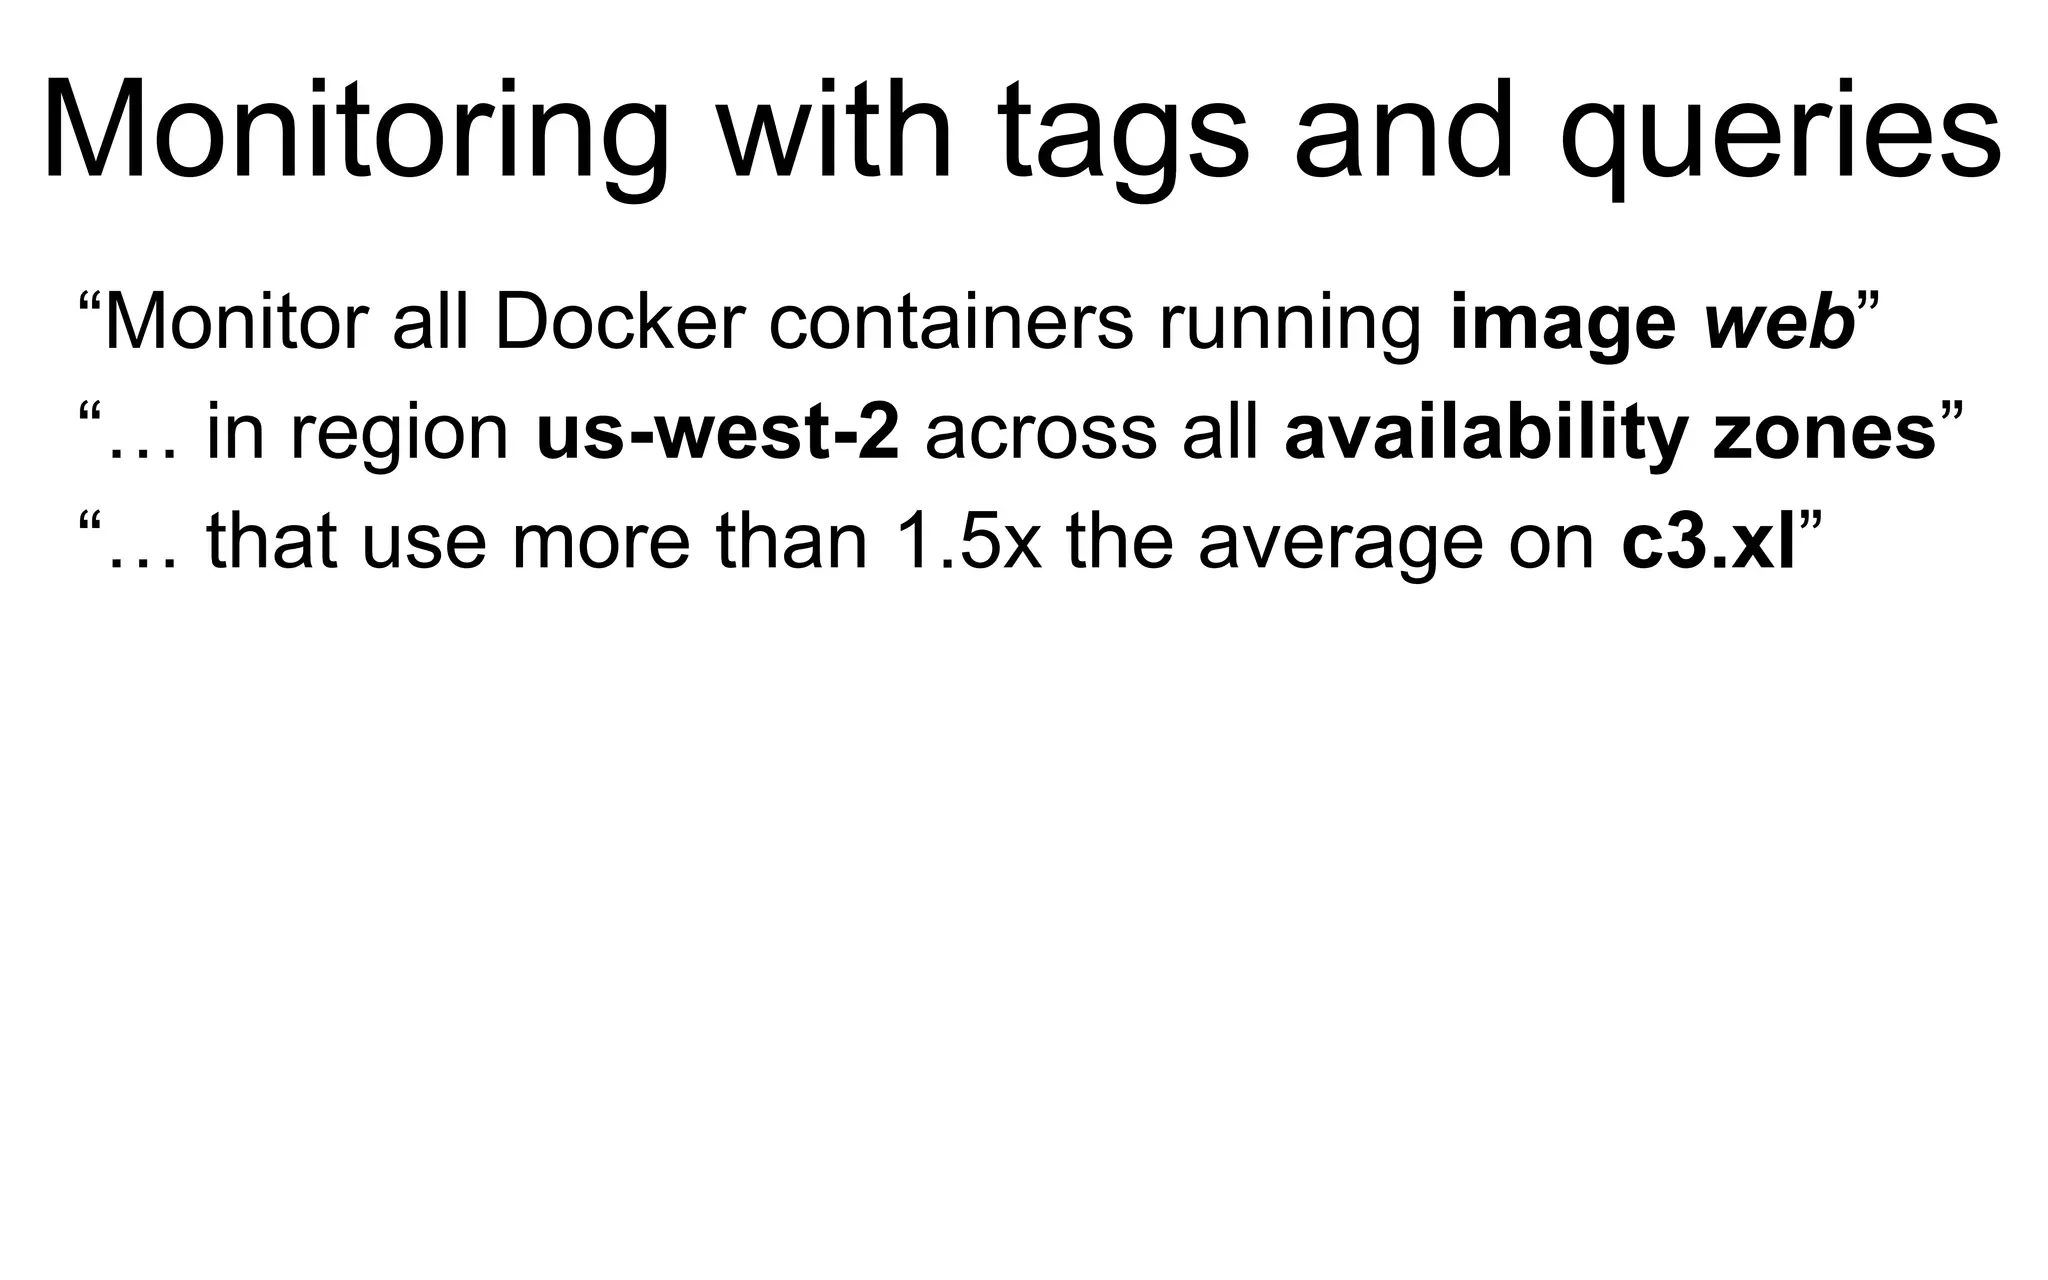
Alexis goals this presentation are three-fold:
1) Dive into key Docker metrics
2) Explain operational complexity. In other words I want to take what we have seen on the field and show you where the pain points will be.
3) Rethink monitoring of Docker containers. The old tricks won’t work.
Containerization (à la Docker) is increasing the elastic nature of cloud infrastructure by an order of magnitude. If you have adopted Docker, or are considering it, you are probably facing questions like:
- How many containers can you run on a given Amazon EC2 instance type?
- Which metric should you look at to measure contention?
- How do you manage fleets of containers at scale?
Datadog’s CTO, Alexis Lê-Quôc, presents the challenges and benefits of running Docker containers at scale. Alexis explains how to use quantitative performance patterns to monitor your infrastructure at the new level of magnitude and increased complexity introduced by containerization.
Monitoring Docker at Scale - Docker San Francisco Meetup - August 11, 2015Datadog
In this session I showed building a multi-container app from beginning to end, using Docker, Docker-Machine, Docker-Compose and everything in between. You can even try it out yourself using the link in the deck to a repo on GitHub.
Lifting the Blinds: Monitoring Windows Server 2012Datadog
Operating systems monitor resources continuously in order to effectively schedule processes.
In this webinar, Evan Mouzakitis (Datadog) discusses how to get operational data from Windows Server 2012 using a variety of native tools.
Go through the result of our latest large-scale study about Docker usage in real environment. Analyze and see the impact for operations and monitoring.
(APP309) Running and Monitoring Docker Containers at Scale | AWS re:Invent 2014Amazon Web Services
If you have tried Docker but are unsure about how to run it at scale, you will benefit from this session. Like virtualization before, containerization (à; la Docker) is increasing the elastic nature of cloud infrastructure by an order of magnitude. But maybe you still have questions: How many containers can you run on a given Amazon EC2 instance type? Which metric should you look at to measure contention? How do you manage fleets of containers at scale?
Datadog is a monitoring service for IT, operations, and development teams who write and run applications at scale. In this session, the cofounder of Datadog presents the challenges and benefits of running containers at scale and how to use quantitative performance patterns to monitor your infrastructure at this magnitude and complexity. Sponsored by Datadog.
Moving Legacy Applications to Docker by Josh Ellithorpe, Apcera Docker, Inc.
Looking to move your application to run in a container? Need to move existing x86 legacy applications to Docker? Let's break down your fundamental application concerns. This includes persistent storage, networking, configuration management, policy, logging, health monitoring, and service discovery. You won't want to miss this talk.
CoreOS: The Inside and Outside of Linux ContainersRamit Surana
CoreOS is designed for security, consistency, and reliability. Instead of installing packages via yum or apt, it uses Linux containers to manage your services at a higher level of abstraction. A single service's code and all dependencies are packaged within a container that can be run on one or many CoreOS machines.
Take an Analytics-driven Approach to Container Performance with Splunk for Co...Docker, Inc.
Docker containers add portability but can also introduce complexity into your environment. In this session learn about why monitoring your container environment is essential to maintaining service reliability, and how Splunk software can help you monitor different layers of infrastructure running in a Docker environment, including third-party tools, instances, and custom code.
Learn how to use Splunk software to collect, search and correlate container data with other infrastructure data for better service context, root cause monitoring and reporting. Additionally, receive introduction to the product integrations between Splunk and Docker such as the Splunk Logging Driver, Splunk Forwarder, and Splunk Logging Libraries.
Fully Automated Kubernetes Deployment and Management (Peng Jiang, Rancher Labs) - Kubernetes is rapidly gaining popularity as a powerful container orchestration and scheduling platform. But deploying and managing Kubernetes clusters is still a challenge for many organizations.How to ensure Kubernetes clusters in different clouds and data centers can communicate with each other? How to automate the deployment of multiple Kubernetes clusters? How to incorporate the new Kubernetes Federation into multi cloud and multi datacenter deployments? How to manage the health of Kubernetes cluster itself? etc.
In this talk, Peng will share his experience on how to automate and simplify Kubernetes deployments, and discuss how some of the latest community projects (such as kubeadm and self-hosting Kubernetes) will help address the problems in the future.
Docker for Ops: Docker Networking Deep Dive, Considerations and Troubleshooti...Docker, Inc.
Overview;
What is libnetwork
New features in 1.12
Deep Dive;
Multihost networking
Secure Control Plane
Secure Data plane
Service Discovery
Native Loadbalacing
Routing Mesh
Structured Container Delivery by Oscar Renalias, AccentureDocker, Inc.
With tools like Docker Toolbox, the entry barrier to Docker and containers is rather low. However, it takes a lot more to design, build and run an entire container platform, at scale, for production applications.
This talk will focus on why it is important to have a well-defined reference model for building container platforms that guides container engineers and architects through the process of identifying platform concerns, patterns, components as well as the interactions between them in order to deliver a set of platform capabilities (service discovery, load balancing, security, and others) to support containerized applications using existing tooling.
As part of this session will also see how a container architecture has enabled real projects in their delivery of container platforms.
Application Deployment and Management at Scale with 1&1 by Matt BaldwinDocker, Inc.
1&1, Europe’s largest web hosting company, has been automatically deploying and managing multi-tenant server environments for 20 years. These servers support millions of active websites and services around the world. Historically software stacks were pre-installed using estimates of what was considered good, taking a ‘one size fits all’ approach. I am going to show how we are now combining Git, Gitlab, Openshift and Docker to revolutionise our approach to large scale hosting, providing greater power and flexibility without increasing support overhead. This includes showing:
· Transforming the legacy multi-tenant LAMP environment into many single-tenant Docker projects
· Managing thousands of projects on behalf of tenants
· Gitlab CI for testing Docker containers
· Testing container interactions and upgrade cycle
Re:invent 2016 Container Scheduling, Execution and AWS Integrationaspyker
Members from over all over the world streamed over forty-two billion hours of Netflix content last year. Various Netflix batch jobs and an increasing number of service applications use containers for their processing. In this session, Netflix presents a deep dive on the motivations and the technology powering container deployment on top of Amazon Web Services. The session covers our approach to resource management and scheduling with the open source Fenzo library, along with details of how we integrate Docker and Netflix container scheduling running on AWS. We cover the approach we have taken to deliver AWS platform features to containers such as IAM roles, VPCs, security groups, metadata proxies, and user data. We want to take advantage of native AWS container resource management using Amazon ECS to reduce operational responsibilities. We are delivering these integrations in collaboration with the Amazon ECS engineering team. The session also shares some of the results so far, and lessons learned throughout our implementation and operations.
Container Orchestration with Docker Swarm and KubernetesWill Hall
This presentation covers the basics of what container orchestration is providing pros and cons of Docker Swarm, Kubernetes and Amazon ECS and outlining the terms and tools you will need to successfully use them.
In deploying apps that have been containerized, you have a lot to think about regarding what to use in production. There are a lot of things to manage, so orchestrators become a huge help. providing many services together such as scheduling, container communication, scaling, health, and more. There are major platforms to consider from Kubernetes, Swarm to ECS. In this talk we'll go through the overview of orchestrators and some of the differences between the big players. You should come out of the talk knowing where to go next in determining your orchestrator needs.
Introducing Chef | An IT automation for speed and awesomenessRamit Surana
Chef turns infrastructure into code. With Chef, you can automate how you build, deploy, and manage your infrastructure.
It is a powerful automation platform that transforms complex infrastructure into code, bringing your servers and services to life.
From the Philly Kubernetes December 2016 Meetup.
https://www.meetup.com/Kubernetes-Philly/events/234829676/
Kubernetes accelerates technical and business innovation through rapid development and deployment of applications. Learn how to deploy, scale, and manage your applications in a containerized environments using Kubernetes.
In this 60-minute workshop, Ross Kukulinski will review fundamental Kubernetes concepts and architecture and then will show how to containerize and deploy a multi-tier web application to Kubernetes.
Topics that will be covered include:
• Working with the Kubernetes CLI (kubectl)
• Pods, Deployments, & Services
• Manual & Automated Application Scaling
• Troubleshooting and debugging
• Persistent storage
FOWA London 2015
Micro-service systems deliver wonderful adaptability to business needs, easy scalability, and low-risk deployment. What's not to like? You also end up with a system that's hard to understand, measure and predict. Traditional approaches to monitoring simply aren't powerful enough to handle the emergent properties of a system with lots of moving parts. The solution is to apply the scientific method! Anything can be measured. Uncertainty can be reduced, and stability can be an emergent property. We just have to learn the lessons that the natural world can teach us.
Performance monitoring for Docker - Lucerne meetupStijn Polfliet
Performance monitoring for Docker
Challenges - Anomaly detection - CoScale demo
For more info about how to use CoScale Docker monitoring, some reading material here: http://www.coscale.com/blog/how-to-monitor-docker-containers-with-coscale and http://www.coscale.com/blog/how-to-monitor-your-kubernetes-cluster
A summary of CoScale Docker performance monitoring can be found here: http://www.coscale.com/docker-monitoring
Spenser Reinhardt's presentation on Detecting Security Breaches With Docker, Honeypots, & Nagios.
The presentation was given during the Nagios World Conference North America held Oct 13th - Oct 16th, 2014 in Saint Paul, MN. For more information on the conference (including photos and videos), visit: http://go.nagios.com/conference
ContainerDays NYC 2016: "Observability and Manageability in a Container Envir...DynamicInfraDays
Slides from the workshop "Observability and Manageability in a Container Environment", led by Tim Gross, at ContainerDays NYC 2016: http://dynamicinfradays.org/events/2016-nyc/programme.html#observability
BFF Pattern in Action: SoundCloud’s MicroservicesBora Tunca
At SoundCloud we managed to break away from the monolith while delivering key business features. Our journey towards a microservices architecture has not been a straightforward one. We experimented a lot to reach the set of tools and technologies that we use today. We changed how we build our applications. We introduced specific apis for our mobile and web clients. We call them BFFs (backend for the frontend). They became the central piece of SoundCloud’s architecture. We rethought how we monitor our services. We created a service registry for knowledge sharing. While making all these changes, we benefited from the learnings of our peer companies. This talk will share our learnings from this journey: what worked for us and what we moved away from.
Tracing 2000+ polyglot microservices at Uber with Jaeger and OpenTracingYuri Shkuro
Slides from my talk & demo at Go NYC Meeetup 19-Jan-2017.
We present Jaeger, Uber’s open source distributed tracing system, featuring Go backend, React based UI, and OpenTracing API support. We show examples of instrumenting application code for tracing and using distributed context propagation to attribute backend resource usage to top level consumers.
Monitoring What Matters: The Prometheus Approach to Whitebox Monitoring (Berl...Brian Brazil
Often what you monitor and get alerted on is defined by your tools, rather than what makes the most sense to you and your organisation. Alerts on metrics such as CPU usage which are noisy and rarely spot real problems, while outages go undetected. Monitoring systems can also be challenging to maintain, and overall provide a poor return on investment.
In the past few years several new monitoring systems have appeared with more powerful semantics and which are easier to run, which offer a way to vastly improve how your organisation operates Prometheus is one such system. This talk will look at the monitoring ideal and how whitebox monitoring with a time series database, multi-dimensional labels and a powerful querying/alerting language can free you from midnight pages.
In this session we’ll leave the need for performance a foregone conclusion and take a whirlwind tour through the complexity of modern Internet architectures. The complexities lead to evil optimization problems and significant challenges troubleshooting production issues to a speedy and successful end.
Starting with the simple facts that you can’t fix what you can’t see and you can’t improve what you can’t measure, we’ll discuss what needs monitoring and why. We’ll talk about unlikely allies in the fight for time and budget to instrument systems, applications and processes for observability.
You’ll leave the session with a better understanding of what it looks like to troubleshoot the storm of a malfunctioning large architecture and some tools and techniques you can use to not be swallowed by the Kraken.
Monitoring Microservices at Scale on OpenShift (OpenShift Commons Briefing #52)Martin Etmajer
Microservices promise to increase time-to-market, support growth and foster innovation by enforcing Agile, product-centered and self-enabled teams. However, building a system of microservices that actually works is not an easy endeavour - after all, you're building a highly dynamic, distributed and fault-tolerant system. In this presentation I'll share important learnings around microservices and how to use the Dynatrace digital performance management platform on Red Hat's OpenShift to manage the inherent complexities of microservices-oriented architectures.
Delivered at the FISL13 conference in Brazil: http://www.youtube.com/watch?v=K9w2cipqfvc
This talk introduces the USE Method: a simple strategy for performing a complete check of system performance health, identifying common bottlenecks and errors. This methodology can be used early in a performance investigation to quickly identify the most severe system performance issues, and is a methodology the speaker has used successfully for years in both enterprise and cloud computing environments. Checklists have been developed to show how the USE Method can be applied to Solaris/illumos-based and Linux-based systems.
Many hardware and software resource types have been commonly overlooked, including memory and I/O busses, CPU interconnects, and kernel locks. Any of these can become a system bottleneck. The USE Method provides a way to find and identify these.
This approach focuses on the questions to ask of the system, before reaching for the tools. Tools that are ultimately used include all the standard performance tools (vmstat, iostat, top), and more advanced tools, including dynamic tracing (DTrace), and hardware performance counters.
Other performance methodologies are included for comparison: the Problem Statement Method, Workload Characterization Method, and Drill-Down Analysis Method.
SREcon 2016 Performance Checklists for SREsBrendan Gregg
Talk from SREcon2016 by Brendan Gregg. Video: https://www.usenix.org/conference/srecon16/program/presentation/gregg . "There's limited time for performance analysis in the emergency room. When there is a performance-related site outage, the SRE team must analyze and solve complex performance issues as quickly as possible, and under pressure. Many performance tools and techniques are designed for a different environment: an engineer analyzing their system over the course of hours or days, and given time to try dozens of tools: profilers, tracers, monitoring tools, benchmarks, as well as different tunings and configurations. But when Netflix is down, minutes matter, and there's little time for such traditional systems analysis. As with aviation emergencies, short checklists and quick procedures can be applied by the on-call SRE staff to help solve performance issues as quickly as possible.
In this talk, I'll cover a checklist for Linux performance analysis in 60 seconds, as well as other methodology-derived checklists and procedures for cloud computing, with examples of performance issues for context. Whether you are solving crises in the SRE war room, or just have limited time for performance engineering, these checklists and approaches should help you find some quick performance wins. Safe flying."
AWS May Webinar Series - Streaming Data Processing with Amazon Kinesis and AW...Amazon Web Services
If you are interested to know more about AWS Chicago Summit, please use the following to register: http://amzn.to/1RooPPL
Amazon Kinesis is a fully managed, cloud-based service for real-time data processing over large, distributed data streams. AWS Lambda is a compute service that runs your code in response to events and automatically manages the compute resources for you. AWS Lambda can run code in response to data in Amazon Kinesis streams, making it easy to build big data applications that respond quickly to new information. In this webinar, we will cover key Kinesis and Lambda features, walk through sample use cases for stream processing, and discuss best practices on using the services together. We'll then demonstrate setting up an Amazon Kinesis stream and an associated Lambda function to capture and perform custom computations on click-stream data, all without setting up any infrastructure.
Learning Objectives: • Understand key Amazon Kinesis and AWS Lambda features • Learn how to setup streaming data capture and processing framework using AWS Lambda • Learn sample use cases, best practices and tips on using AWS Lambda with Amazon Kinesis
Who Should Attend: • Developers, Devops Engineers, IT Operations Professionals
AWS re:Invent 2016: Deep Dive on Amazon EC2 Instances, Featuring Performance ...Amazon Web Services
Amazon EC2 provides a broad selection of instance types to accommodate a diverse mix of workloads. In this session, we provide an overview of the Amazon EC2 instance platform, key platform features, and the concept of instance generations. We dive into the current generation design choices of the different instance families, including the General Purpose, Compute Optimized, Storage Optimized, Memory Optimized, and GPU instance families. We also detail best practices and share performance tips for getting the most out of your Amazon EC2 instances.
AWS re:Invent 2016: Monitoring, Hold the Infrastructure: Getting the Most fro...Amazon Web Services
Just as we got a hang of monitoring our server-based applications, they take away the server. How do you monitor something that doesn’t exist? Which metrics matter most in a serverless world? In this session, we will look at how applications are different in an AWS Lambda-based world and how to monitor them. Join us as we work our way through the stack and demonstrate how to capture the health and performance of your services.
The focus of this session is not tool-specific. Attendees will learn production-tested lessons and leave with frameworks they can implement with their serverless workloads, no matter which platforms and tools they use. This session sponsored by Datadog.
AWS Competency Partner
Docker is the developer-friendly container technology that enables creation of your application stack: OS, JVM, app server, app, database and all your custom configuration. So you are a Java developer but how comfortable are you and your team taking Docker from development to production? Are you hearing developers say, “But it works on my machine!” when code breaks in production? And if you are, how many hours are then spent standing up an accurate test environment to research and fix the bug that caused the problem?
This workshop/session explains how to package, deploy, and scale Java applications using Docker.
Dock ir incident response in a containerized, immutable, continually deploy...Shakacon
Incident response is generally predicated on the ability to examine a system post-breach, pull memory dumps, file system artifacts, system logs, etc. But what happens when that system was part of a fleet of containers? How do you pull a memory dump from an ephemeral container? How do you do forensics when the container and the host that ran the container have been gone for days? Even assuming you catch an intrusion while it's ongoing, how do you respond effectively if you can't access the systems in question because they are read-only, no SSH access? Coinbase has spent the last year attacking these challenges in a AWS-based, immutable and fully containerized infrastructure that stores over a billion dollars of digital currency. Come see how we do it.
The challenge of application distribution - Introduction to Docker (2014 dec ...Sébastien Portebois
Live recording with the demos: https://www.youtube.com/watch?v=0XRcmJEiZOM
Contents
- The application distribution challenge
- The current solutions
- Introduction to Docker, Containers, and the Matrix from Hell
- Why people care: Separation of Concerns
- Technical Discussion
- Ecosystem, momentum
- How to build Docker images
- How to make containers talk to each other, how to handle data persistence
- Demo 1: isolation
- Demo 2: real case - installing Go Math! Academy, tail –f containers, unit tests
An overview on docker and container technology behind it. Lastly, we discuss few tools that might come handy when dealing with large number of containers management.
Docker is the world's leading software containerization platform.
This is a comprehensive introduction to Docker, suitable for delivering in introductory meetups to an audience who does not know about docker.
In case you want to deliver this presentation somewhere, kindly drop me a mail at aditya.konarde@gmail.com
You can contact me at:
Connect with me onLinkedIN: https://www.linkedin.com/in/adityakonarde
Add me on Facebook: https://www.facebook.com/Aditya.Konarde
Tweet to me @aditya_konarde
Adopting Docker for production applications and services used to be hard. You had to hand-roll a lot of the underlying infrastructure and write lots of custom code for service discovery, load balancing, orchestration, desired state, etc. Today, with the rise of open source container orchestration platforms and cloud-native offerings, it's a lot easier to get up and running.
Github repo for demo: https://github.com/elabor8/dockertalk
Seminar about docker and its containerization capabilities during the "Aggiornamento Agile" event of Club degli Sviluppatori in January 2015, in Bari (Italy)
We talk about docker, what it is, why it matters, and how it can benefit us. This presentation is an introduction and delivered to local meetup in Indonesia.
Presentation on Pesantren Kilat Code Security
Tangerang, 2016-06-06
We talk about docker. What it is? Why it matters? and how it can benefit us?
This presentation is an introduction and delivered to local meetup in Indonesia.
What it Means to be a Next-Generation Managed Service ProviderDatadog
Webinar that took place on July 12 2017.
The emergence of cloud-based infrastructure has dramatically reshaped
the IT landscape for managed service providers and their customers. Infrastructure is now dynamic, elastic, and instantly available to any individual or organization.
Customers are becoming increasingly aware of the value of cloud services, and with this heightened awareness comes the desire to partner with providers who can guide them toward innovative business solutions and high-performance environments. But in this new landscape, gaining insight into the status and performance of dynamic infrastructure and applications is more challenging than ever.
Join us as we host Thomas Robinson, Solutions Architect at Amazon Web Services, and Patrick Hannah, VP of Engineering at CloudHesive, to discuss what it means to be a next-generation managed service provider and how Datadog provides visibility into modern cloud infrastructure and helps you adopt new approaches to remain competitive in this ever-changing environment.
A granular look into The Do's and Don't of Post Incident Analysis, featuring Jason Hand - DevOps Evangelist - from VictorOps and Jason Yee - Technical Writer/Evangelist - from Datadog.
Topics include a breakdown of the process in the following order:
- Service disruptions
- Detection
- Diagnosis
- Post-incident analysis
- Framework
PyData NYC 2015 - Automatically Detecting Outliers with Datadog Datadog
Monitoring even a modestly-sized systems infrastructure quickly becomes untenable without automated alerting. For many metrics it is nontrivial to define ahead of time what constitutes “normal” versus “abnormal” values. This is especially true for metrics whose baseline value fluctuates over time. To make this problem more tractable, Datadog provides outlier detection functionality to automatically identify any host (or group of hosts) that is behaving abnormally compared to its peers.
These slides cover the algorithms we use for outlier detection, and show how easy they are to implement using Python. This presentation also covers the lessons we've learned from using outlier detection on our own systems, along with some real-life examples on how to avoid false positives and negatives.
Learn more at www.datadoghq.com.
In this presentation, Mike walks through the philosophical shift of treating the servers that you have in-house as if they were part of a “cloud” and disposable, and then jumps into a technical demonstration of how to actually tear down and reconstruct your infrastructure at a moment’s notice.
What I’m going to talk about
‣Briefly we do and for whom
‣Where we started
‣The kind of data we deal with
‣How it fits altogether
‣A few things we learned along the way
‣Q+A
Examination of the old way of computing and the new way - the Dev & Ops way
Aggregate - the more tools the merrier
Correlate - because issues spread
Collaborate - you can't solve problems on your own
Analyze - not just alert whack-a-mole
Datadog is monitoring that does not suck. It's metrics friendly, people friendly and developer friendly monitoring.
Learn more at https://www.datadoghq.com/
Dig into an alert using Datadog graphs to correlate data from all of your system and determine and resolve the cause of your performance issue.
Learn more about Datadog's infrastructure monitoring at https://www.datadoghq.com
Best practices for monitoring your IT infrastructure using StatsD. Find dashboard examples here: https://p.datadoghq.com/sb/9b246c4ade
Monitor StatsD easily with Datadog. Learn more at https://www.datadoghq.com
Alerting: more signal, less noise, less painDatadog
Is this talk for me?
✓I am or will be on-call
✓I don’t like being alerted
✓I want the pain to go away
The next 40 minutes
1. Alerts == pain?
2. Measure alerts
3. Concrete (& fun) steps
Learn more about Datadog's infrastructure monitoring as a service at https://www.datadoghq.com.
Your configuration management is fact-based.
Your orchestration is fact-based.
Is your monitoring fact-based?
What does that even mean? Monitoring is very similar to configuration, at least in its expression. Configuration cares about files, services, and hosts being present and in a certain state (""nginx should be running with the following configuration""). Monitoring cares about services being present, running, and in a certain state. Both describe your infrastructure as it should be (""nginx should be running and respond in less than 200ms"").
Fact-based monitoring is about being able to control monitoring with the same facts that Puppet uses (""monitor nginx latency wherever Puppet says it should run""). This is in contrast with imperative monitoring (""monitor nginx on host a, b and c"") that gets out of sync and leads to mailbox meltdowns from spurious alerts.
Using open source and commercial examples, this talk will help you express your monitoring in a way that will feel very natural to your Puppet configuration.
Monitoring NGINX (plus): key metrics and how-toDatadog
NGINX just works and that's why we use it. That does not mean that it should be left unmonitored. As a web server, it plays a central role in a modern infrastructure. As a gatekeeper, it sees every interaction with the application. If you monitor it properly it can explain a lot about what is happening in the rest of your infrastructure.
In this talk you will learn more about NGINX (plus) metrics, what they mean and how to use them. You will also learn different methods (status, statsd, logs) to monitor NGINX with their pros and cons, illustrated with real data coming from real servers.
Essentials of Automations: The Art of Triggers and Actions in FMESafe Software
In this second installment of our Essentials of Automations webinar series, we’ll explore the landscape of triggers and actions, guiding you through the nuances of authoring and adapting workspaces for seamless automations. Gain an understanding of the full spectrum of triggers and actions available in FME, empowering you to enhance your workspaces for efficient automation.
We’ll kick things off by showcasing the most commonly used event-based triggers, introducing you to various automation workflows like manual triggers, schedules, directory watchers, and more. Plus, see how these elements play out in real scenarios.
Whether you’re tweaking your current setup or building from the ground up, this session will arm you with the tools and insights needed to transform your FME usage into a powerhouse of productivity. Join us to discover effective strategies that simplify complex processes, enhancing your productivity and transforming your data management practices with FME. Let’s turn complexity into clarity and make your workspaces work wonders!
Smart TV Buyer Insights Survey 2024 by 91mobiles.pdf91mobiles
91mobiles recently conducted a Smart TV Buyer Insights Survey in which we asked over 3,000 respondents about the TV they own, aspects they look at on a new TV, and their TV buying preferences.
UiPath Test Automation using UiPath Test Suite series, part 4DianaGray10
Welcome to UiPath Test Automation using UiPath Test Suite series part 4. In this session, we will cover Test Manager overview along with SAP heatmap.
The UiPath Test Manager overview with SAP heatmap webinar offers a concise yet comprehensive exploration of the role of a Test Manager within SAP environments, coupled with the utilization of heatmaps for effective testing strategies.
Participants will gain insights into the responsibilities, challenges, and best practices associated with test management in SAP projects. Additionally, the webinar delves into the significance of heatmaps as a visual aid for identifying testing priorities, areas of risk, and resource allocation within SAP landscapes. Through this session, attendees can expect to enhance their understanding of test management principles while learning practical approaches to optimize testing processes in SAP environments using heatmap visualization techniques
What will you get from this session?
1. Insights into SAP testing best practices
2. Heatmap utilization for testing
3. Optimization of testing processes
4. Demo
Topics covered:
Execution from the test manager
Orchestrator execution result
Defect reporting
SAP heatmap example with demo
Speaker:
Deepak Rai, Automation Practice Lead, Boundaryless Group and UiPath MVP
Pushing the limits of ePRTC: 100ns holdover for 100 daysAdtran
At WSTS 2024, Alon Stern explored the topic of parametric holdover and explained how recent research findings can be implemented in real-world PNT networks to achieve 100 nanoseconds of accuracy for up to 100 days.
Securing your Kubernetes cluster_ a step-by-step guide to success !KatiaHIMEUR1
Today, after several years of existence, an extremely active community and an ultra-dynamic ecosystem, Kubernetes has established itself as the de facto standard in container orchestration. Thanks to a wide range of managed services, it has never been so easy to set up a ready-to-use Kubernetes cluster.
However, this ease of use means that the subject of security in Kubernetes is often left for later, or even neglected. This exposes companies to significant risks.
In this talk, I'll show you step-by-step how to secure your Kubernetes cluster for greater peace of mind and reliability.
Welcome to the first live UiPath Community Day Dubai! Join us for this unique occasion to meet our local and global UiPath Community and leaders. You will get a full view of the MEA region's automation landscape and the AI Powered automation technology capabilities of UiPath. Also, hosted by our local partners Marc Ellis, you will enjoy a half-day packed with industry insights and automation peers networking.
📕 Curious on our agenda? Wait no more!
10:00 Welcome note - UiPath Community in Dubai
Lovely Sinha, UiPath Community Chapter Leader, UiPath MVPx3, Hyper-automation Consultant, First Abu Dhabi Bank
10:20 A UiPath cross-region MEA overview
Ashraf El Zarka, VP and Managing Director MEA, UiPath
10:35: Customer Success Journey
Deepthi Deepak, Head of Intelligent Automation CoE, First Abu Dhabi Bank
11:15 The UiPath approach to GenAI with our three principles: improve accuracy, supercharge productivity, and automate more
Boris Krumrey, Global VP, Automation Innovation, UiPath
12:15 To discover how Marc Ellis leverages tech-driven solutions in recruitment and managed services.
Brendan Lingam, Director of Sales and Business Development, Marc Ellis
A tale of scale & speed: How the US Navy is enabling software delivery from l...sonjaschweigert1
Rapid and secure feature delivery is a goal across every application team and every branch of the DoD. The Navy’s DevSecOps platform, Party Barge, has achieved:
- Reduction in onboarding time from 5 weeks to 1 day
- Improved developer experience and productivity through actionable findings and reduction of false positives
- Maintenance of superior security standards and inherent policy enforcement with Authorization to Operate (ATO)
Development teams can ship efficiently and ensure applications are cyber ready for Navy Authorizing Officials (AOs). In this webinar, Sigma Defense and Anchore will give attendees a look behind the scenes and demo secure pipeline automation and security artifacts that speed up application ATO and time to production.
We will cover:
- How to remove silos in DevSecOps
- How to build efficient development pipeline roles and component templates
- How to deliver security artifacts that matter for ATO’s (SBOMs, vulnerability reports, and policy evidence)
- How to streamline operations with automated policy checks on container images
Generative AI Deep Dive: Advancing from Proof of Concept to ProductionAggregage
Join Maher Hanafi, VP of Engineering at Betterworks, in this new session where he'll share a practical framework to transform Gen AI prototypes into impactful products! He'll delve into the complexities of data collection and management, model selection and optimization, and ensuring security, scalability, and responsible use.
Removing Uninteresting Bytes in Software FuzzingAftab Hussain
Imagine a world where software fuzzing, the process of mutating bytes in test seeds to uncover hidden and erroneous program behaviors, becomes faster and more effective. A lot depends on the initial seeds, which can significantly dictate the trajectory of a fuzzing campaign, particularly in terms of how long it takes to uncover interesting behaviour in your code. We introduce DIAR, a technique designed to speedup fuzzing campaigns by pinpointing and eliminating those uninteresting bytes in the seeds. Picture this: instead of wasting valuable resources on meaningless mutations in large, bloated seeds, DIAR removes the unnecessary bytes, streamlining the entire process.
In this work, we equipped AFL, a popular fuzzer, with DIAR and examined two critical Linux libraries -- Libxml's xmllint, a tool for parsing xml documents, and Binutil's readelf, an essential debugging and security analysis command-line tool used to display detailed information about ELF (Executable and Linkable Format). Our preliminary results show that AFL+DIAR does not only discover new paths more quickly but also achieves higher coverage overall. This work thus showcases how starting with lean and optimized seeds can lead to faster, more comprehensive fuzzing campaigns -- and DIAR helps you find such seeds.
- These are slides of the talk given at IEEE International Conference on Software Testing Verification and Validation Workshop, ICSTW 2022.
Epistemic Interaction - tuning interfaces to provide information for AI supportAlan Dix
Paper presented at SYNERGY workshop at AVI 2024, Genoa, Italy. 3rd June 2024
https://alandix.com/academic/papers/synergy2024-epistemic/
As machine learning integrates deeper into human-computer interactions, the concept of epistemic interaction emerges, aiming to refine these interactions to enhance system adaptability. This approach encourages minor, intentional adjustments in user behaviour to enrich the data available for system learning. This paper introduces epistemic interaction within the context of human-system communication, illustrating how deliberate interaction design can improve system understanding and adaptation. Through concrete examples, we demonstrate the potential of epistemic interaction to significantly advance human-computer interaction by leveraging intuitive human communication strategies to inform system design and functionality, offering a novel pathway for enriching user-system engagements.
GraphRAG is All You need? LLM & Knowledge GraphGuy Korland
Guy Korland, CEO and Co-founder of FalkorDB, will review two articles on the integration of language models with knowledge graphs.
1. Unifying Large Language Models and Knowledge Graphs: A Roadmap.
https://arxiv.org/abs/2306.08302
2. Microsoft Research's GraphRAG paper and a review paper on various uses of knowledge graphs:
https://www.microsoft.com/en-us/research/blog/graphrag-unlocking-llm-discovery-on-narrative-private-data/
In his public lecture, Christian Timmerer provides insights into the fascinating history of video streaming, starting from its humble beginnings before YouTube to the groundbreaking technologies that now dominate platforms like Netflix and ORF ON. Timmerer also presents provocative contributions of his own that have significantly influenced the industry. He concludes by looking at future challenges and invites the audience to join in a discussion.
Elevating Tactical DDD Patterns Through Object CalisthenicsDorra BARTAGUIZ
After immersing yourself in the blue book and its red counterpart, attending DDD-focused conferences, and applying tactical patterns, you're left with a crucial question: How do I ensure my design is effective? Tactical patterns within Domain-Driven Design (DDD) serve as guiding principles for creating clear and manageable domain models. However, achieving success with these patterns requires additional guidance. Interestingly, we've observed that a set of constraints initially designed for training purposes remarkably aligns with effective pattern implementation, offering a more ‘mechanical’ approach. Let's explore together how Object Calisthenics can elevate the design of your tactical DDD patterns, offering concrete help for those venturing into DDD for the first time!
Observability Concepts EVERY Developer Should Know -- DeveloperWeek Europe.pdfPaige Cruz
Monitoring and observability aren’t traditionally found in software curriculums and many of us cobble this knowledge together from whatever vendor or ecosystem we were first introduced to and whatever is a part of your current company’s observability stack.
While the dev and ops silo continues to crumble….many organizations still relegate monitoring & observability as the purview of ops, infra and SRE teams. This is a mistake - achieving a highly observable system requires collaboration up and down the stack.
I, a former op, would like to extend an invitation to all application developers to join the observability party will share these foundational concepts to build on:
7. Containers in a nutshell
• Been around for a long time
– jails, zones, cgroups
• No full-virtualization overhead
• Used for runtime isolation (e.g. jails)
• Docker is an Escape from Dependency Hell
9. Mini-host or über-process?
Process Container Host
Spec Source Dockerfile Kickstart
On disk .TEXT /var/lib/docker /
In memory PID Container ID Hostname
In the network Socket veth* eth*
Runtime
context
server core host data center
13. Operational complexity
• Average containers per host: N (N=5, 10/2014)
• N-times as many “hosts” to manage
• Affects
– provisioning: prep’ing & building containers
– configuration: passing config to containers
– orchestration: deciding where/when containers
run
– monitoring: making sure containers run
properly
20. Aggravating factors
• Registry-based provisioning
– new images as fast as you can git commit
• Autonomic orchestration
– from imperative to declarative
– automated
– individual containers don’t matter
– e.g. kubernetes, mesos
31. Layers of monitoring
• Access to metrics from all the layers
• Amazon CloudWatch, OS metrics, Docker metrics,
app metrics in 1 place
• Shared timeline
34. Tags
• Monitoring is like Auto-Scaling Groups
• Monitoring is like Docker orchestration
• From imperative to declarative
• Query-based
• Queries operate on tags
35. Monitoring with tags and queries
“Monitor all Docker containers running image web”
“… in region us-west-2 across all availability zones”
“… and make sure resident set size < 1GB on c3.xl”
36. Monitoring with tags and queries
“Monitor all Docker containers running image web”
“… in region us-west-2 across all availability zones”
“… and make sure resident set size < 1GB on c3.xl”
37. Monitoring with tags and queries
“Monitor all Docker containers running image web”
“… in region us-west-2 across all availability zones”
“… that use more than 1.5x the average on c3.xl”
39. Take-aways
1. Docker increases operational complexity by an
order of magnitude unless…
2. You have layered monitoring, from the instance to
the container and to the application, and…
3. You monitor using tags and queries
Editor's Notes
My name is Alexis.
I’m the CTO of Datadog.
We monitor cloud-based infrastructures.
We have been monitoring containers for a few years now (lxc then docker)
Datadog is a monitoring service made for cloud environments, such as AWS, Azure, Google Cloud, etc.
By that I mean that Datadog understands that your infrastructure can change at any time and deals with it naturally.
To be able to monitor effectively, Datadog acts as an aggregator: it aggregates everything, it speaks native Cloudwatch and over 100 different other sources, like databases, web servers, etc.
My goals for this talk are three-fold.
Dive into key Docker metrics
Explain operational complexity. In other words I want to take what we have seen on the field and show you where the pain points will be.
Rethink monitoring of Docker containers. The old tricks won’t work.
Here’s what I would like to talk about today.
I will start with very brief history of containers and docker. This is a popular topic so I will only focus on operational matters, including key metrics that containers expose.
I will focus on the inherent complexity that comes with running fleets of containers.
I will illustrate this with what we see out there, in the real world. We have a particular vantage point that gives us good insight into this.
Containers, as lightweight virtual runtimes have been around for a while without going back all the way to the mainframe. Depending on the operating system, they go by the name of jails, zones, cgroups and are like traditional VMs, without the flexibility but also without the overhead.
They were initially designed for security reasons (e.g. jails) but most recently have been used to escape dependency hell.
Dependency hell is this state where you end up having tens or hundreds of dependencies on shared code.
Before shared libraries we had compile-time dependencies to build static executables.
Shared libraries were a good idea when the size of a library was commensurate to the amount of RAM available in a machine. Now, obviously, there is a lot less memory pressure. Still, that has remained the default way to build software.
Then, packages came: apt, yum, rvm, virtualenv, etc. as a partial solution to have a group of binaries that reliably work together. That proved too slow, having to wait for upstream updates so people started to bundle their code and dependencies into /opt. Then a way to make self-contained packages. And now we are back full-circle to static binaries, when we realized how much baggage we carried in shared code.
When you look at it a container is a hybrid between a process and a full-blown host. It has a Dockerfile, which is a manifest or a recipe to build the container, much like source code builds a binary and kickstart, chef or puppet build a full-blown host.
Then you have the actual binary representation of the container on disk, in /var/lib/docker. For a binary, it’s the .text section. For a host it’s its filesystem.
Finally when it runs a container has a unique ID, much like a process has a PID and a host has a hostname.
So a container is this intermediary between a single binary and a full-blown host. It’s lik a static binary with a fully-functioning IP stack.
To put it simply if you look at it from a dev point of view, a container looks like a binary. If you are think about it from an operations point of view, a container is closer to a host.
Let’s recap for a minute.
We know that a container is a lightweight VM
We know roughly what current deployments look like in number of containers per instance.
We know how to measure the performance of a single container.
How do we monitor the whole thing.
Here I want to make the case that Docker introduces operational complexity
This is how the stack has evolved over the past 15 years.
On the left, without virtualization. Off-the-shelf could be your J2EE runtime, or your database.
Then when virtualization and services like EC2 were introduced, in the middle. It’s allowed better utilization and quasi-instant provisioning but for an engineer, few things have changed.
And now running Docker containers inside EC2 instances on top of real hardware.
There is a clear trend here toward a lot more moving parts than before. It also puts engineering much closer to operations.
Specifically by an order of magnitude or so given the 5 containers per instance on average..
This affects a lot of different things at run-time.
provisioning: docker
configuration: etcd, confd, consul, etc.
orchestration: kubernetes, mesos
monitoring: where I can contribute the most
Let’s look at monitoring an EC2 instance.
I counted 10 CloudWatch metrics, about 100 metrics coming from the OS, 50 metrics coming from a container, 10-15 of which are critical to monitor, and let’s say 50 metrics for an off-the-shelf component, for instance a database.
This is a conservative estimate as we see our customers use many more metrics per instance.
Now let’s plug in some numbers.
Assuming you have 100 instances, and 5 containers per instance, you have 500 containers to manage and monitor.
And remember, from a management standpoint, containers behave like hosts. Single-purpose hosts, but hosts none the less.
So for a given instance, you have moved from 160 metrics per instance, to about 410.
Again assuming, 5 containers per host and being conservative on the number of metrics you need to keep an eye on.
If I recap, 100 instances, 41,000 metrics generated.
That’s already 3x what you had before.
And it gets worse. Much worse
Let’s talk about velocity.
If you compare the “half-life” of an EC2 instance, and by half-life I mean the median uptime of your instances. You’re likely having a mix of hourly instances and long-lived instances that will go on for months.
Compare this to containers. A container’s half-life can be in minutes, days at the most.
On top of that, you’ll have to layer in much faster provisioning, where new versions of containers are created on a daily basis, so you rotate your container fleet on a daily basis between versions.
Much faster and much more often than doing an OS upgrade.
And you add autonomic orchestration that go from imperative to declarative.
So you can say, I need 1 container of this kind per instance per zone, at all times. And the scheduler makes sure it’s always the case.
If you use mesos or kubernetes, this is your new reality
In summary, from a management and monitoring standpoint, it means a lot more and a lot faster.
More moving parts that change pretty much all the time with limited predictability.
If your monitoring is still centered around hosts, this is what your world view looks like: complicated.
When we talk to customers, they feel that the move to EC2 was a key factor to rethink their monitoring. Because instances come and go, different groups within their organization would spin up new stacks with little advance notice.
Imagine if you throw containers in the mix. The old, host-centric monitoring practice simply stops working altogether. The host-centric monitoring practice that has you track individual hosts.
It’s a bit like ptolemaic astronomy. Put the earth at the center of the universe and account for the movement of the planets. It gets pretty complicated.
In other words host-centric monitoring does not really understand containers, so either you treat them as hosts, and you have a lot of hosts that come and go every few minutes, which makes your life miserable because the host-centric monitoring system thinks half of your infrastructure is on fire.
Or you don’t track containers, and you essentially have a gap. You see the OS, you see the app, and what happens in the middle, well…
So in short, if you think about monitoring containers like you’ve monitored hosts before, you’re in for a painful ride very very quickly.
So how do we do it properly?
We need a new approach, that does not treat everything like a host.
The picture here, as you’ve guessed, comes from Copernicus. He suggested a radical approach to simplifying the universe. Don’t put the earth at the center of it… Compared to putting the earth at the center of the universe, this one is striking in clarity and simplicity.
So what’s the secret sauce?
It’s simple: forget about hosts, think in layers and tags.
What do you I mean by that…
Using a layered monitoring approach is pretty simple.
This is where you want to be: have coverage from the bottom of the stack all the way to the top.
Which means using monitoring tools that don’t leave any gap.
At the bottom, CloudWatch to know about the VMs.
In the middle, an infrastructure monitoring system that understands containers.
Ad at the top, an application performance monitoring tool.
So in terms of what you can see through these tools:
At the bottom, raw resources like cpu, network, io of the VM.
In the middle, anything from the OS to docker metrics.
At the top, application throughput.
The key here is to have 1 shared timeline for everything.
You want to get CloudWatch metrics, OS metrics, Docker metrics and app metrics, ideally in 1 place, all on the same timeline so that you can see when things break, how changes ripples through the different layers.
That’s the first part of the equation. Layers.
Tags is the second half of the equation.
The good news is that you use them already. How are they relevant to monitoring in general and monitoring containers in particular?
Think of monitoring like ASG.
Think of monitoring like container orchestration.
Don’t think “imperative”, think “declarative”.
Don’t monitor host X, Y and Z. Instead, monitor everything that share a common property, for instance being located in the same AZ.
Think in terms of queries and you will see that tags work beautifully because queries operate on tags.
Here’s an example:
Monitor… to make sure a container does not blow up in memory.
You can see the tags:
Name of container image: web
AWS Region: us-west-2
Instance type: c3.xlarge
Do you see how powerful this is?
Once you have queries in place, you can express even more interesting things such as:
Monitor …