Download to read offline

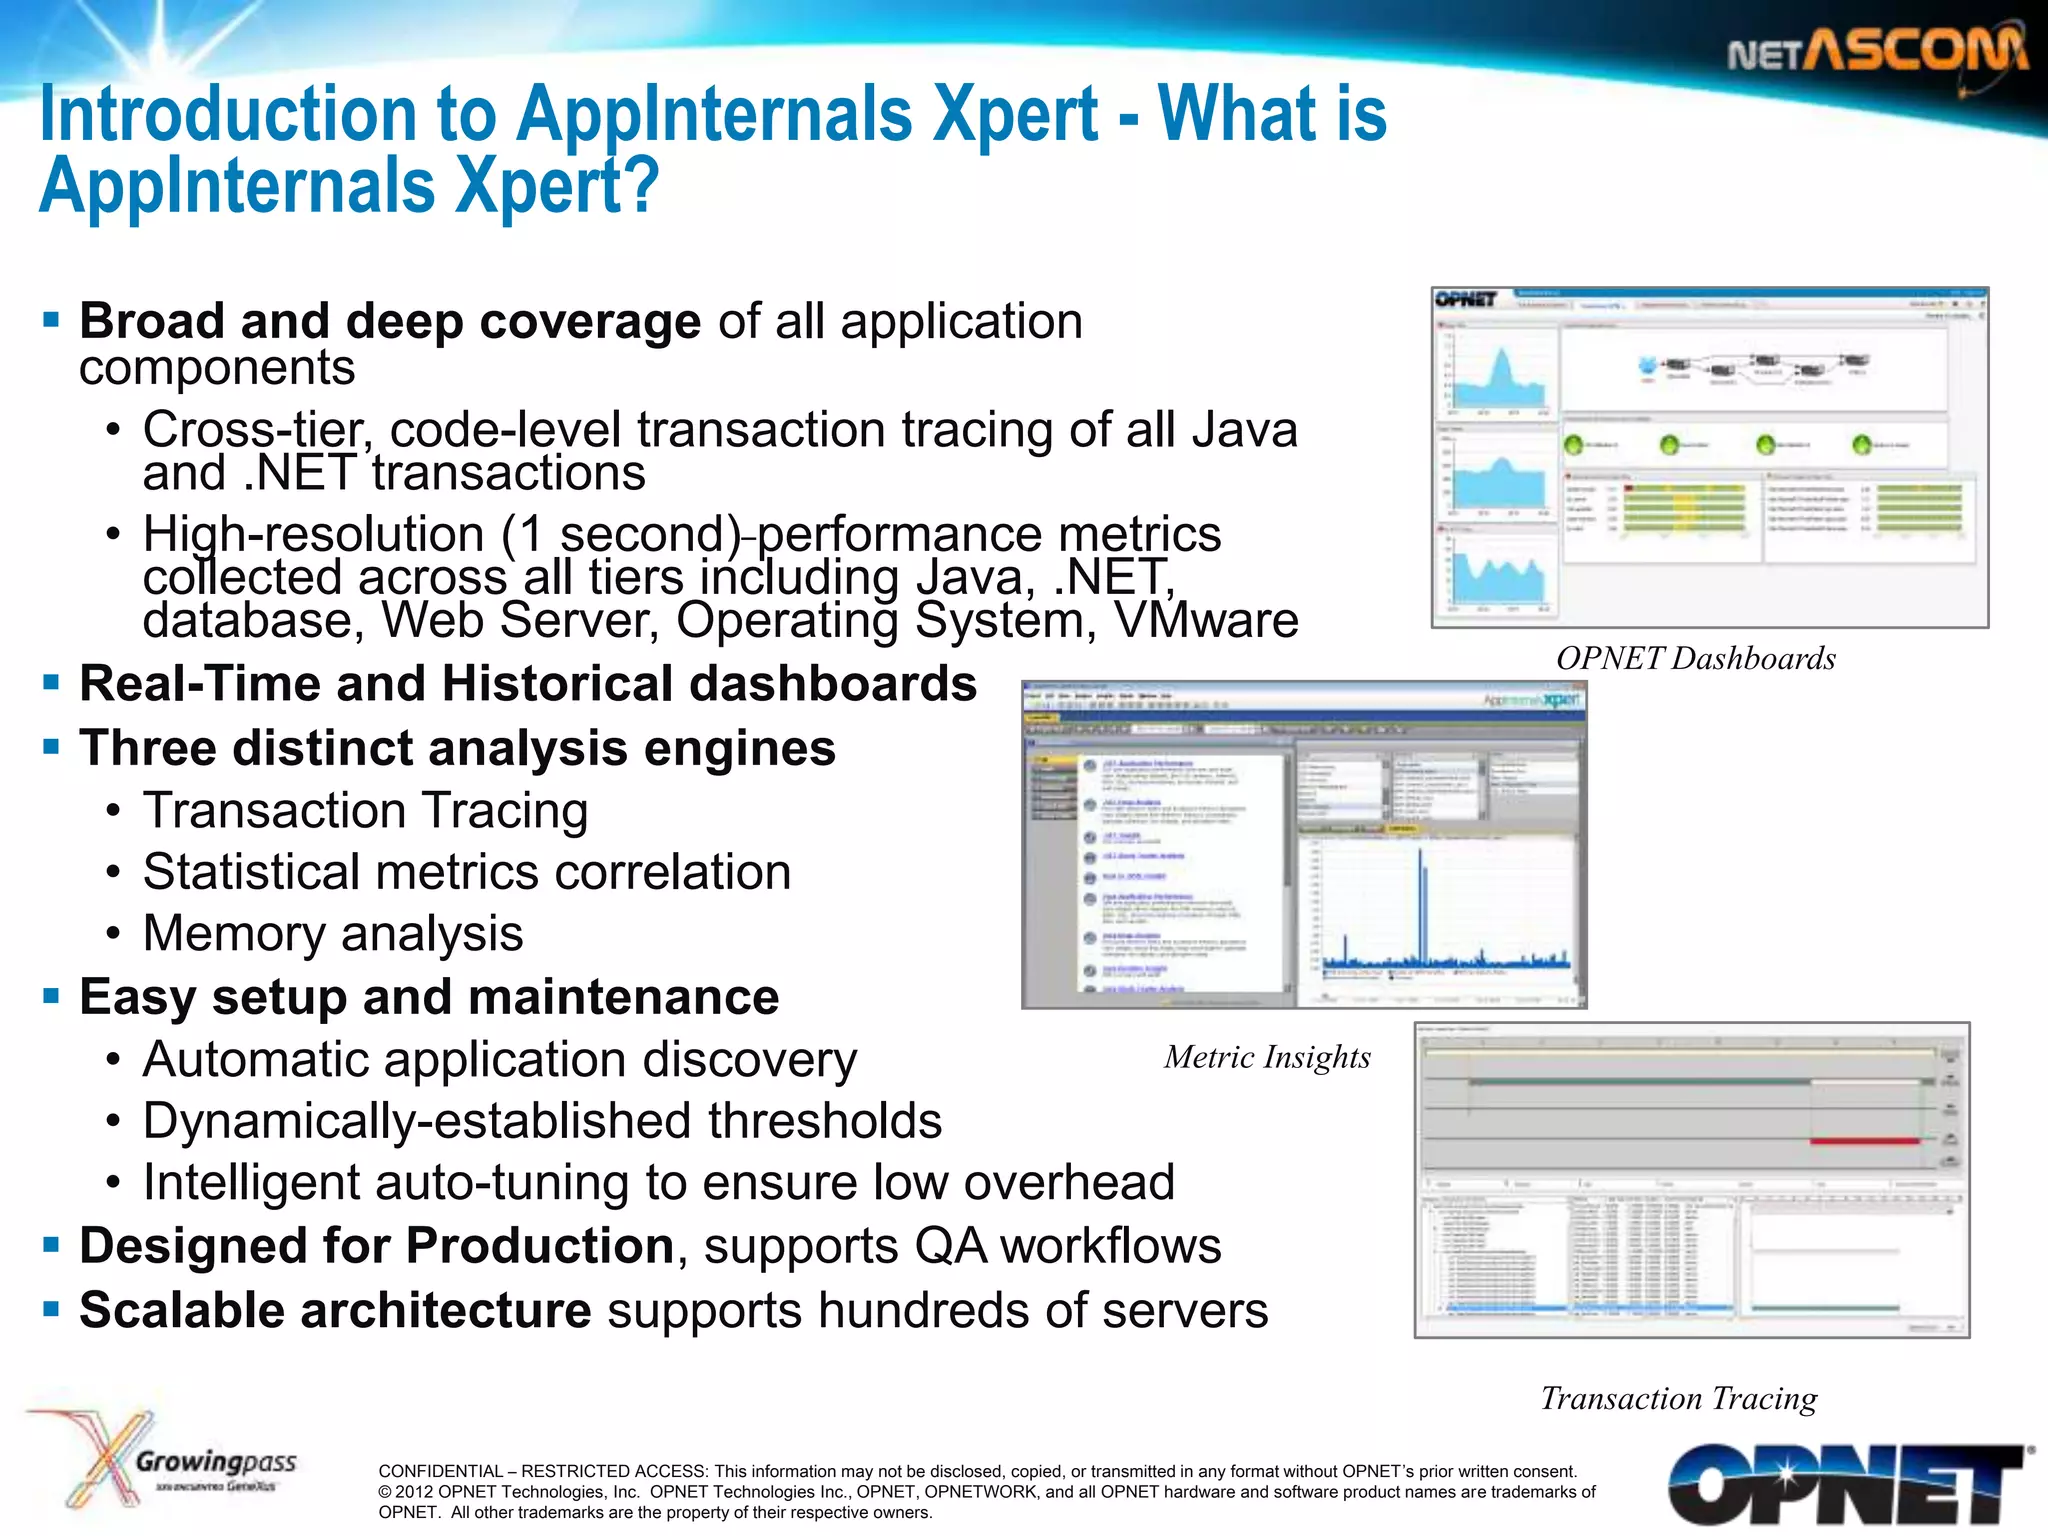
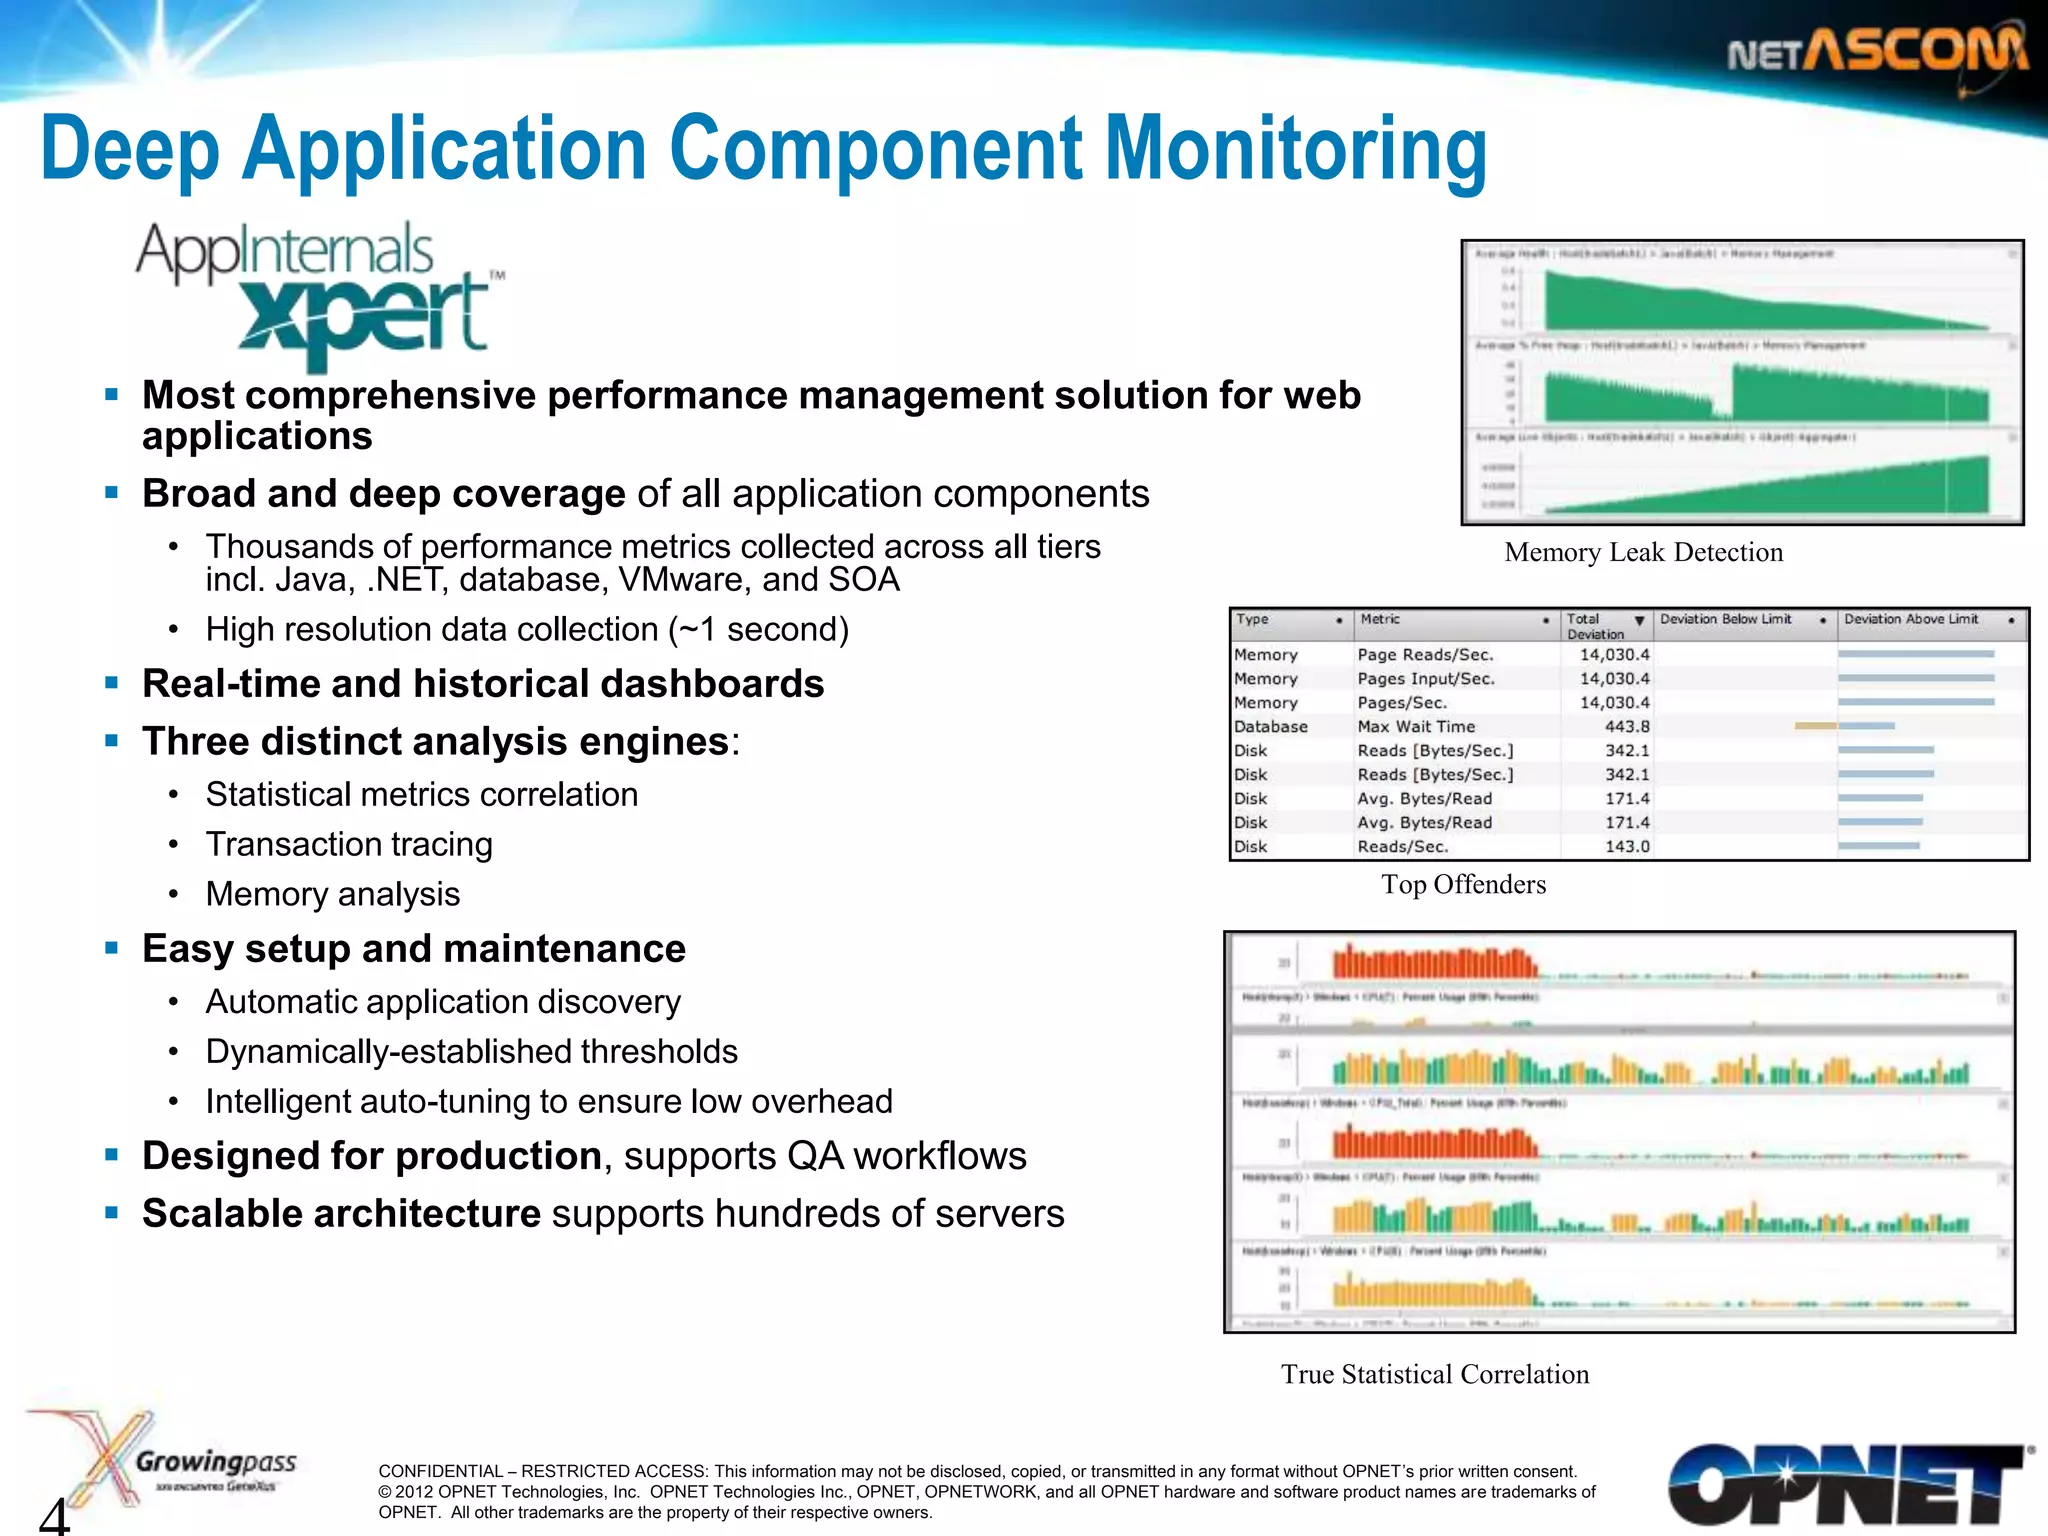
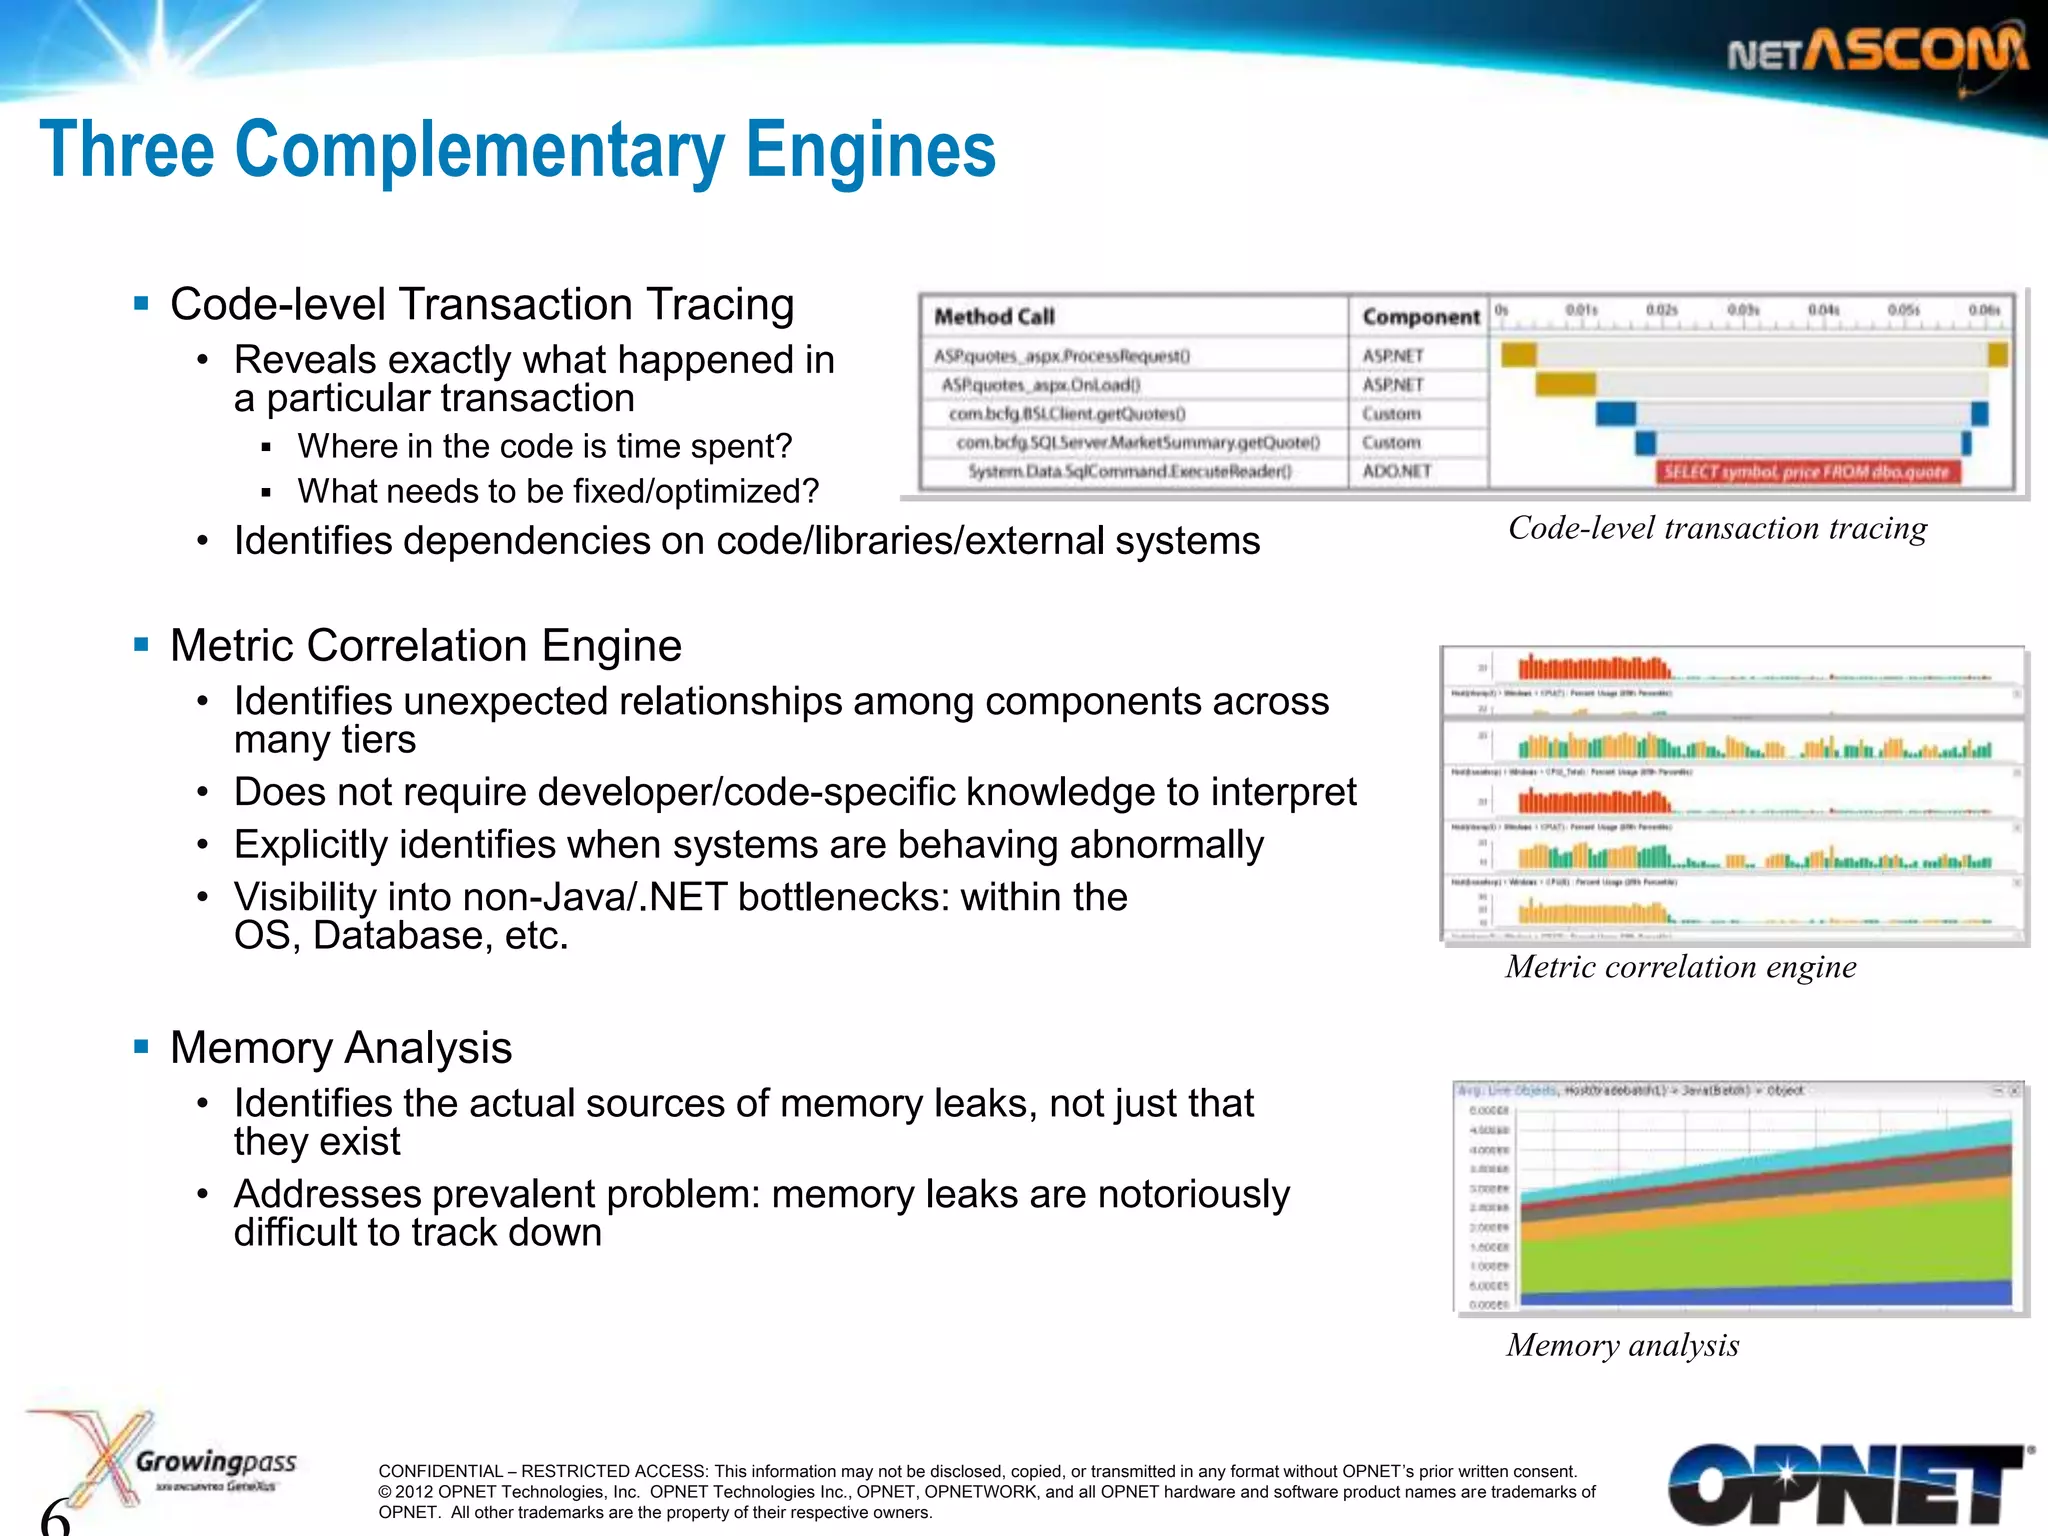
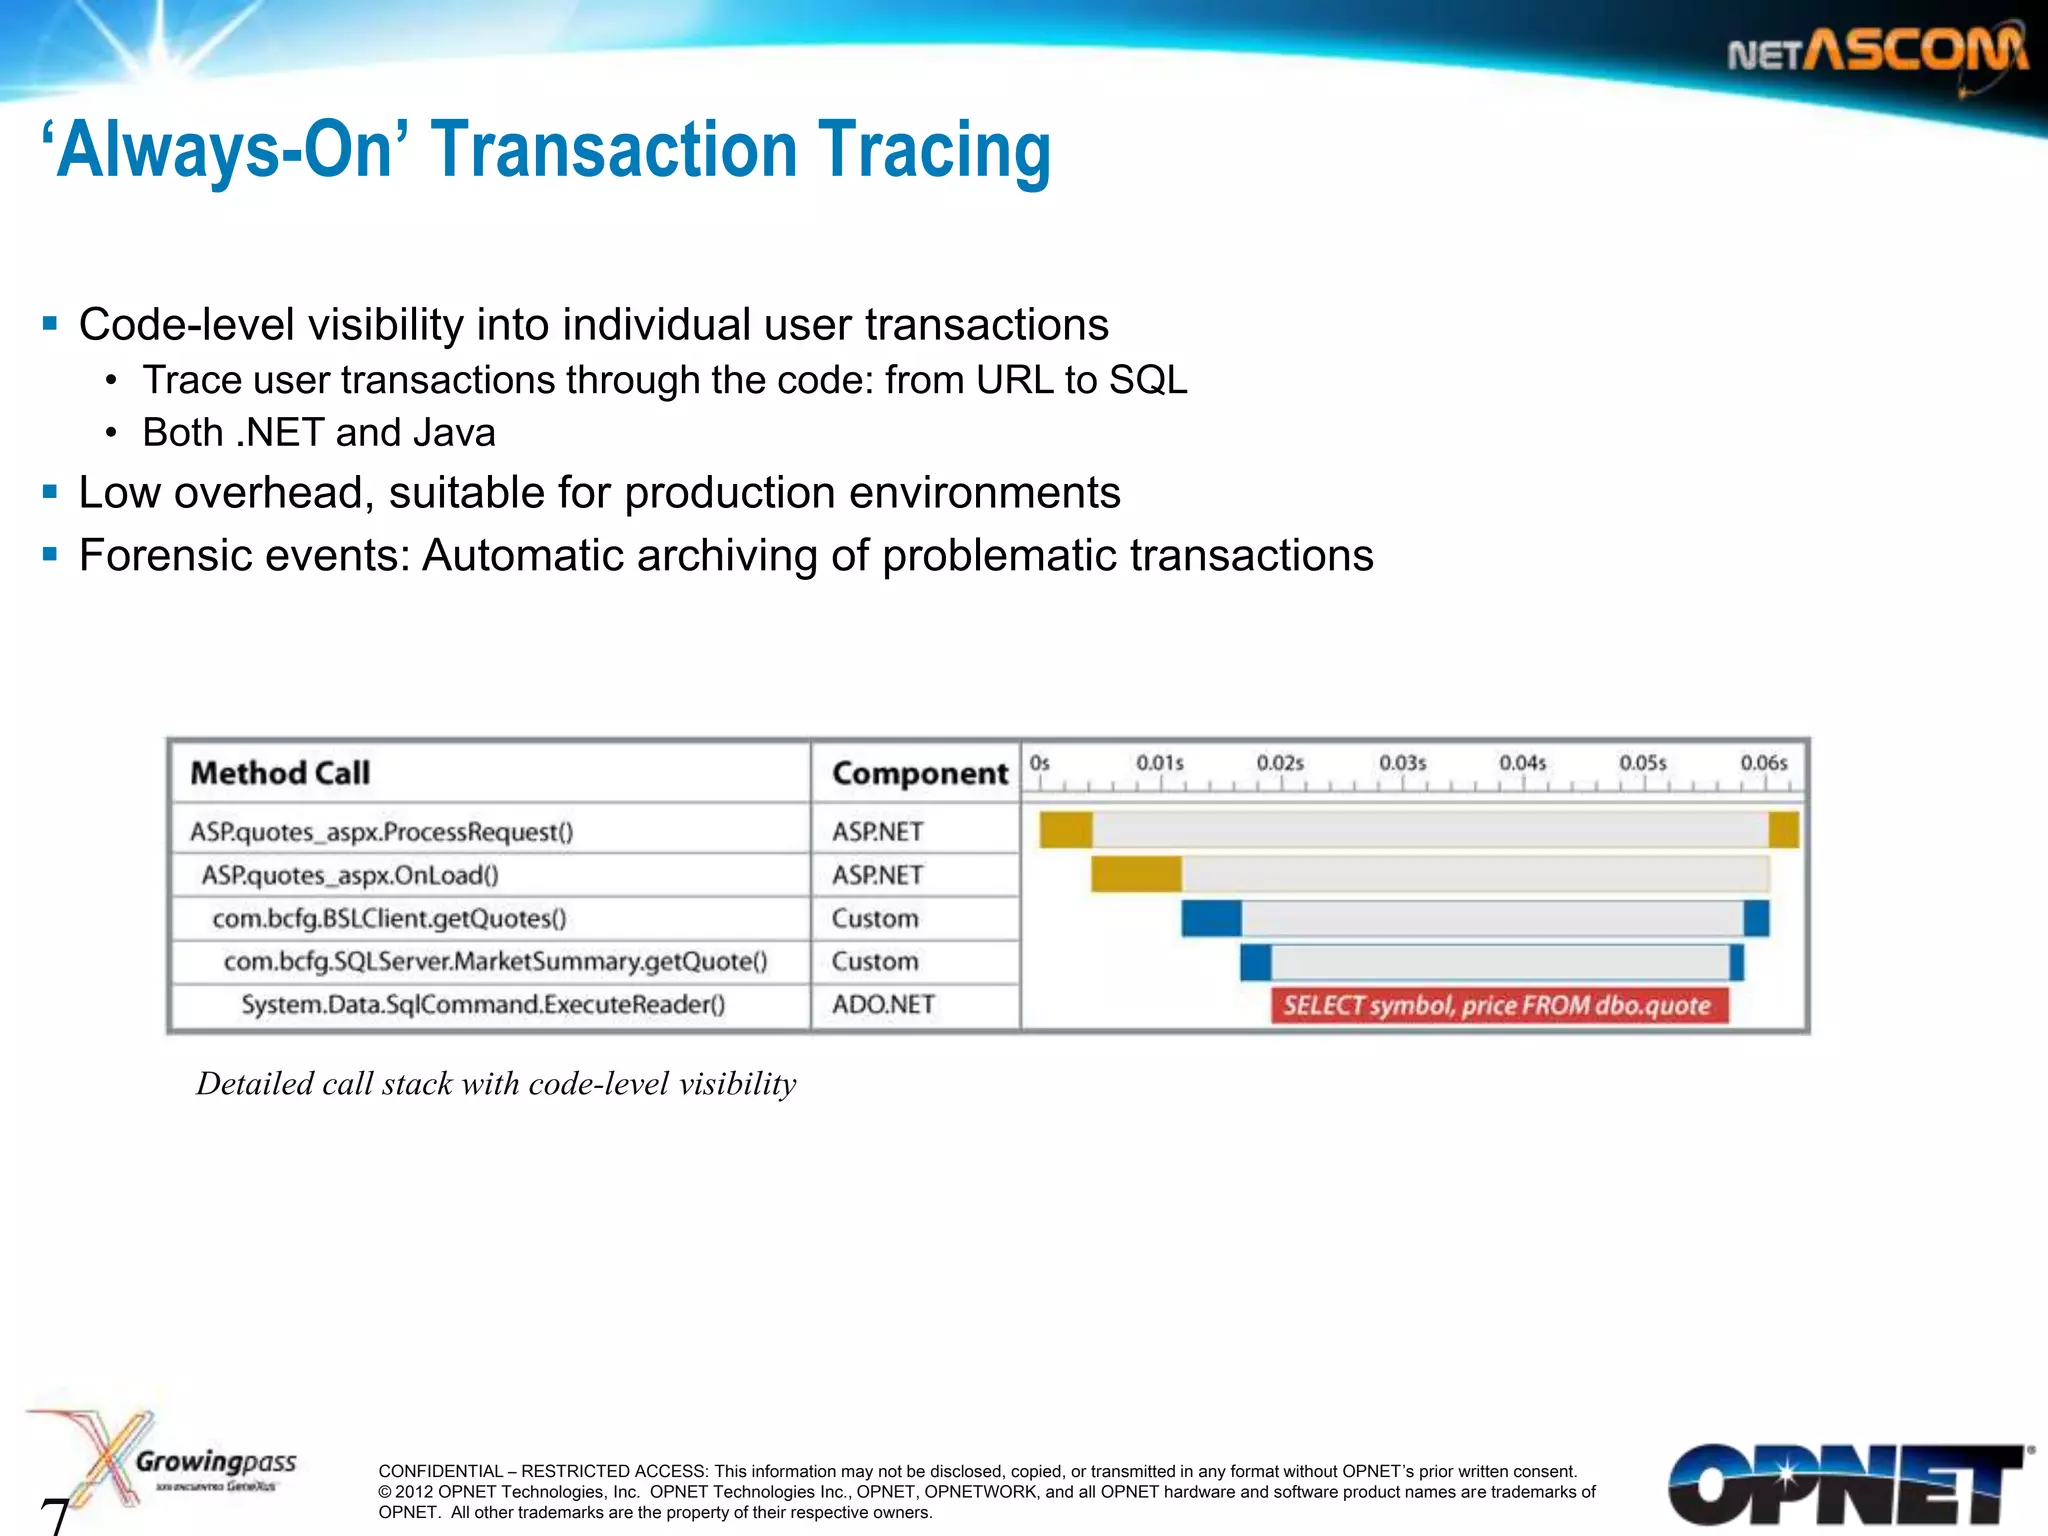
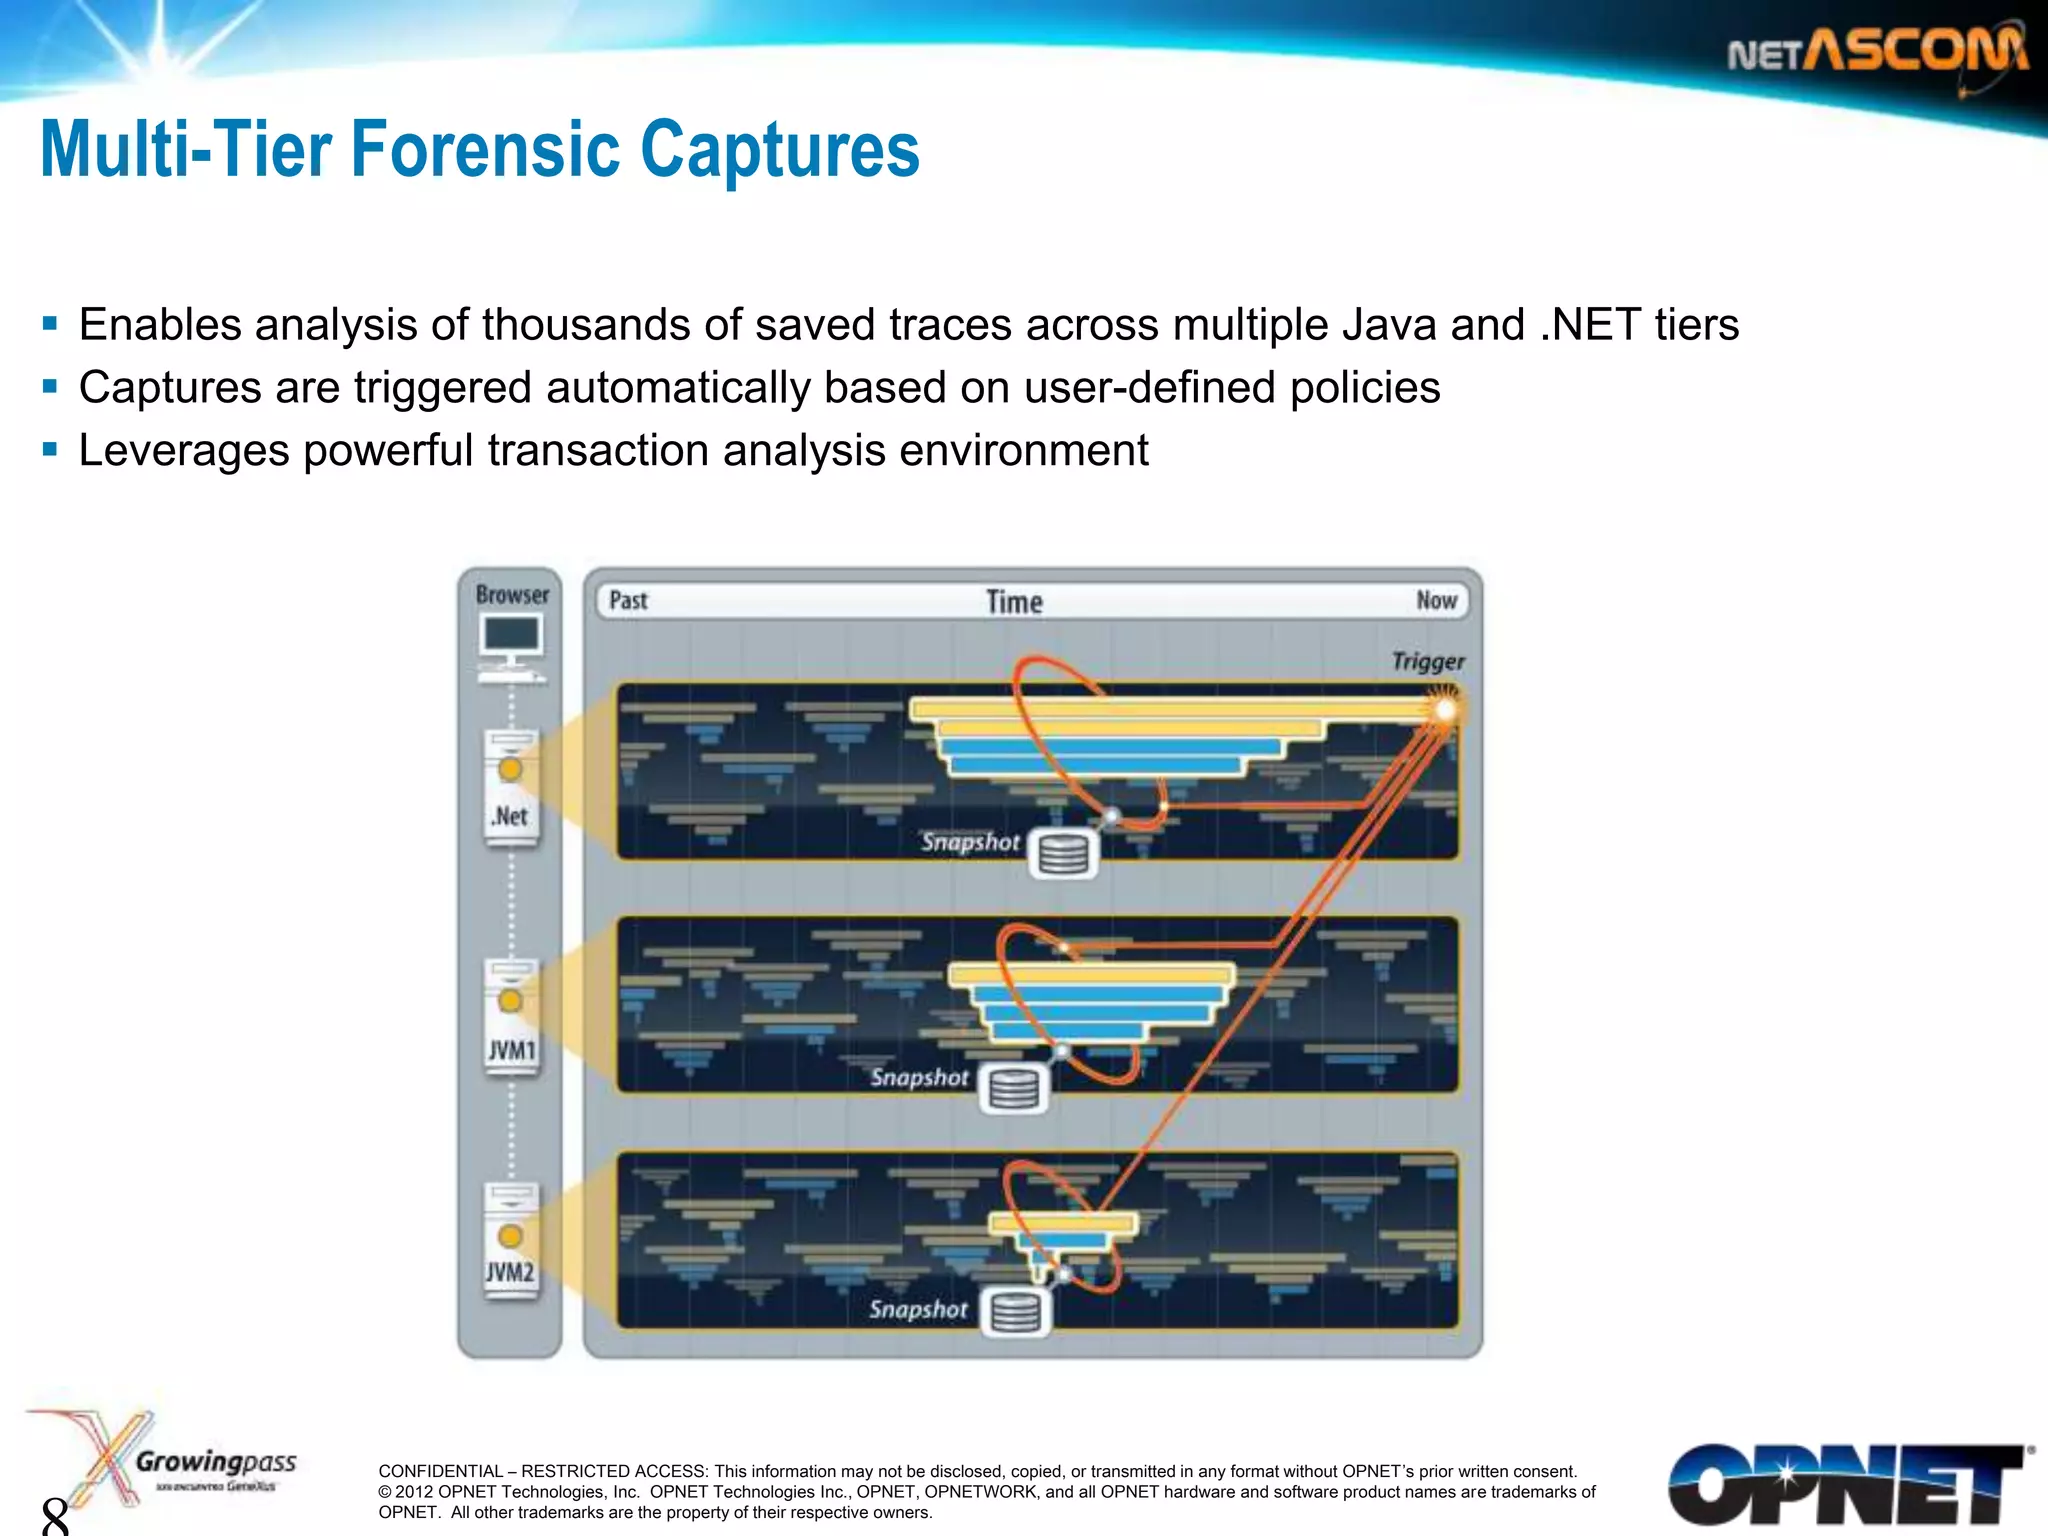
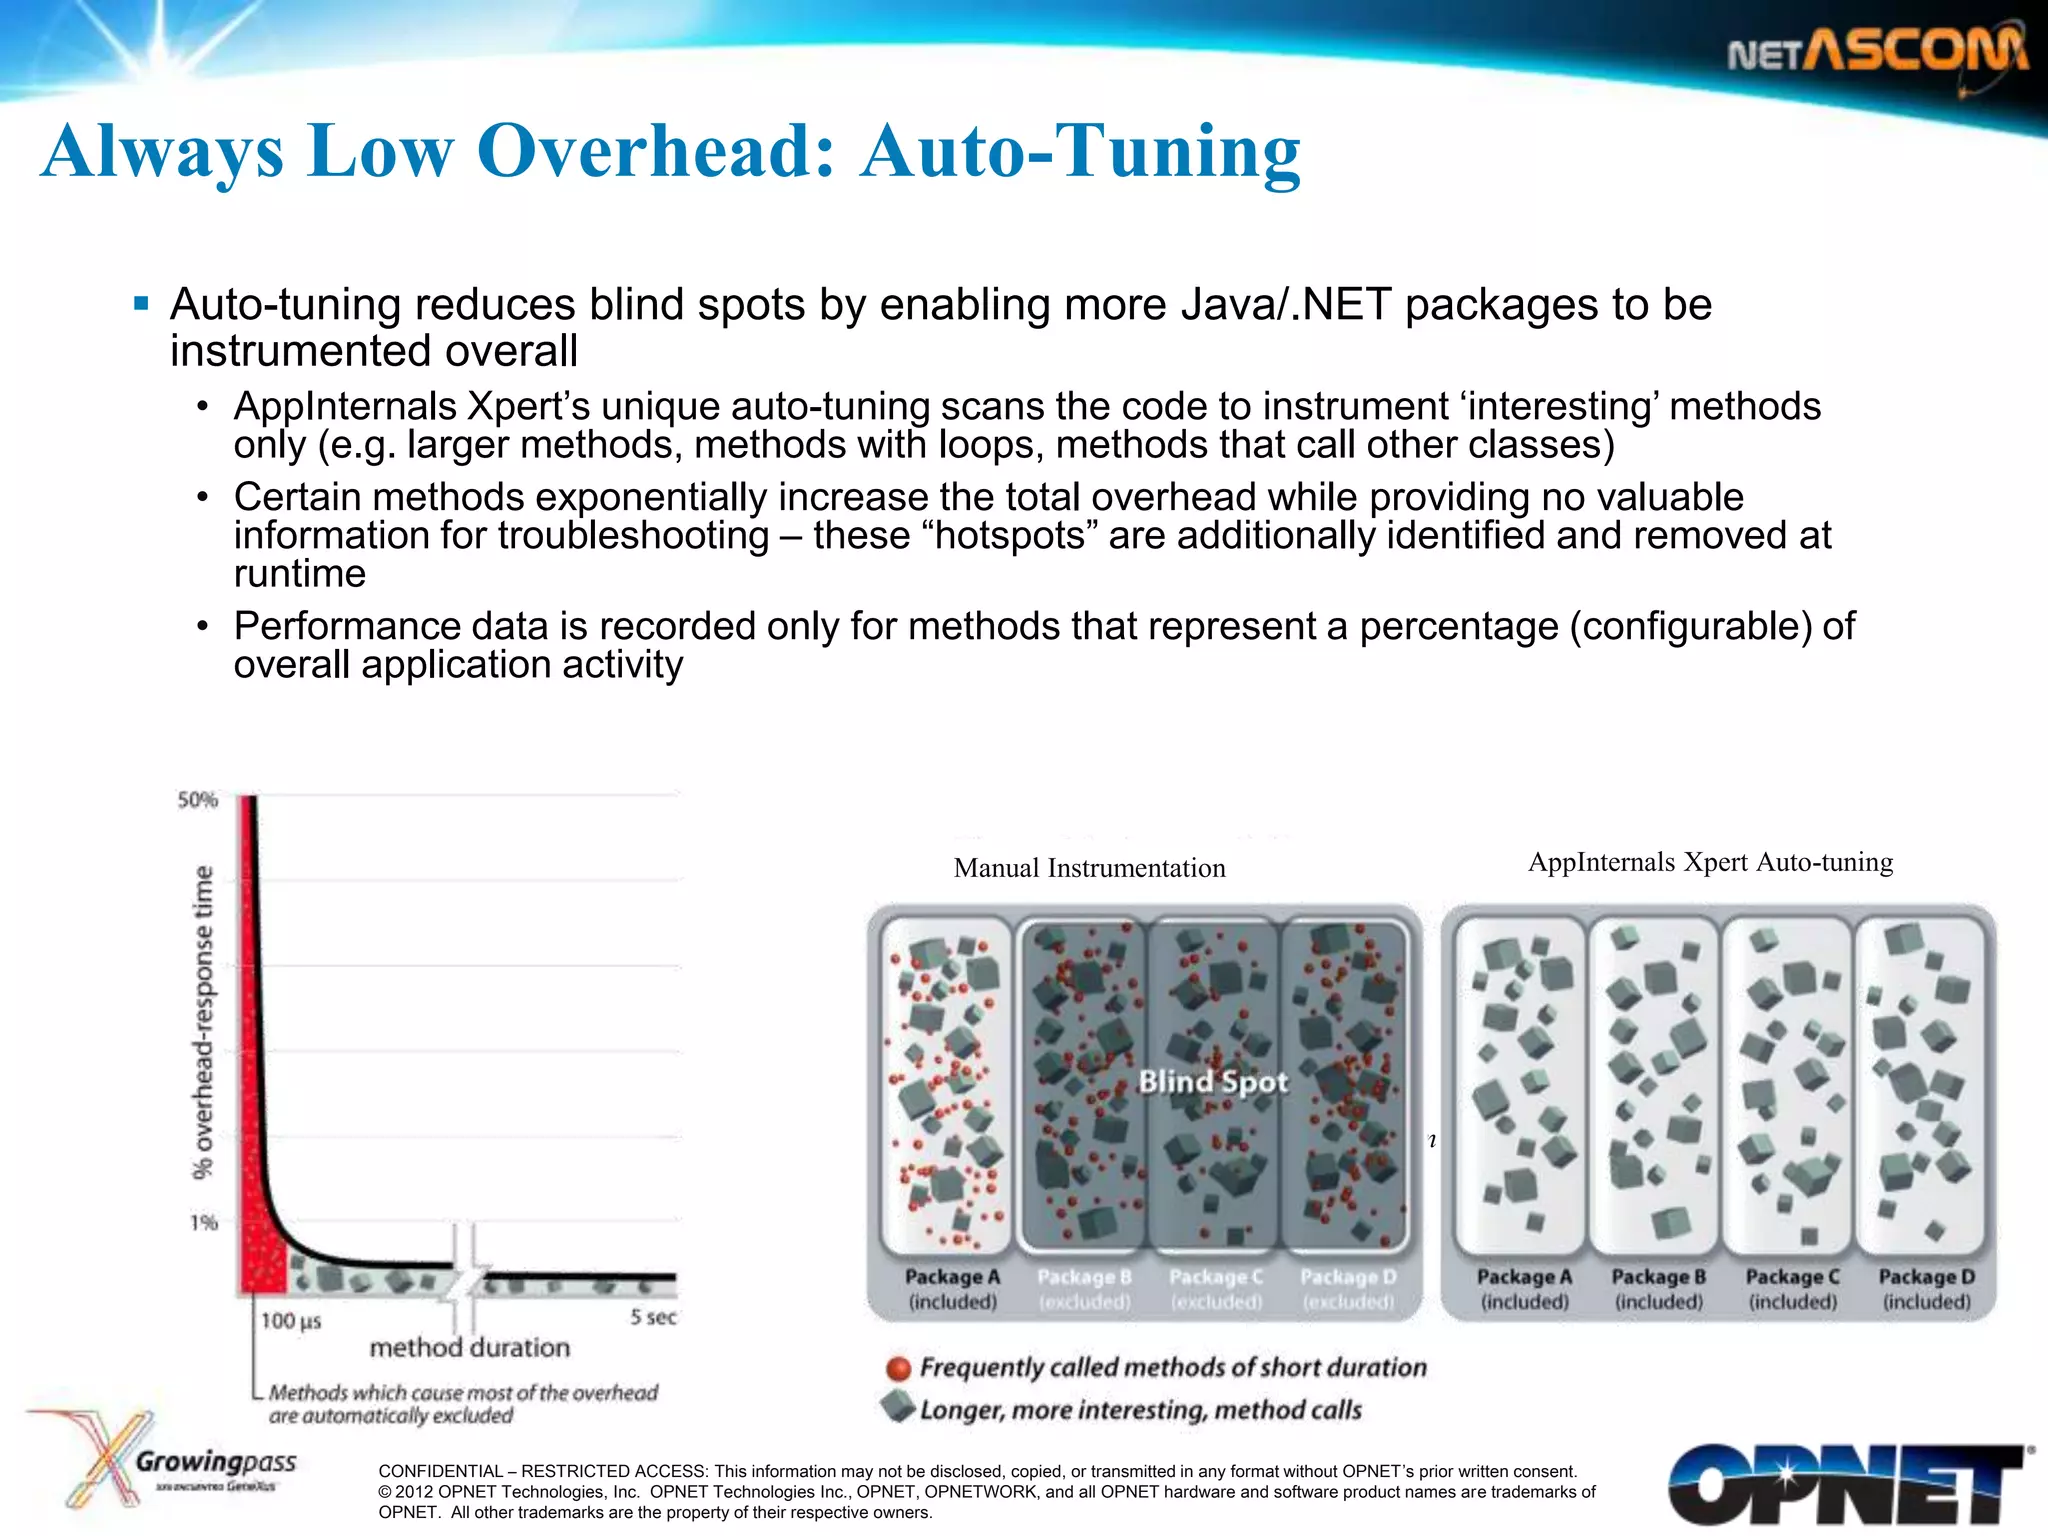
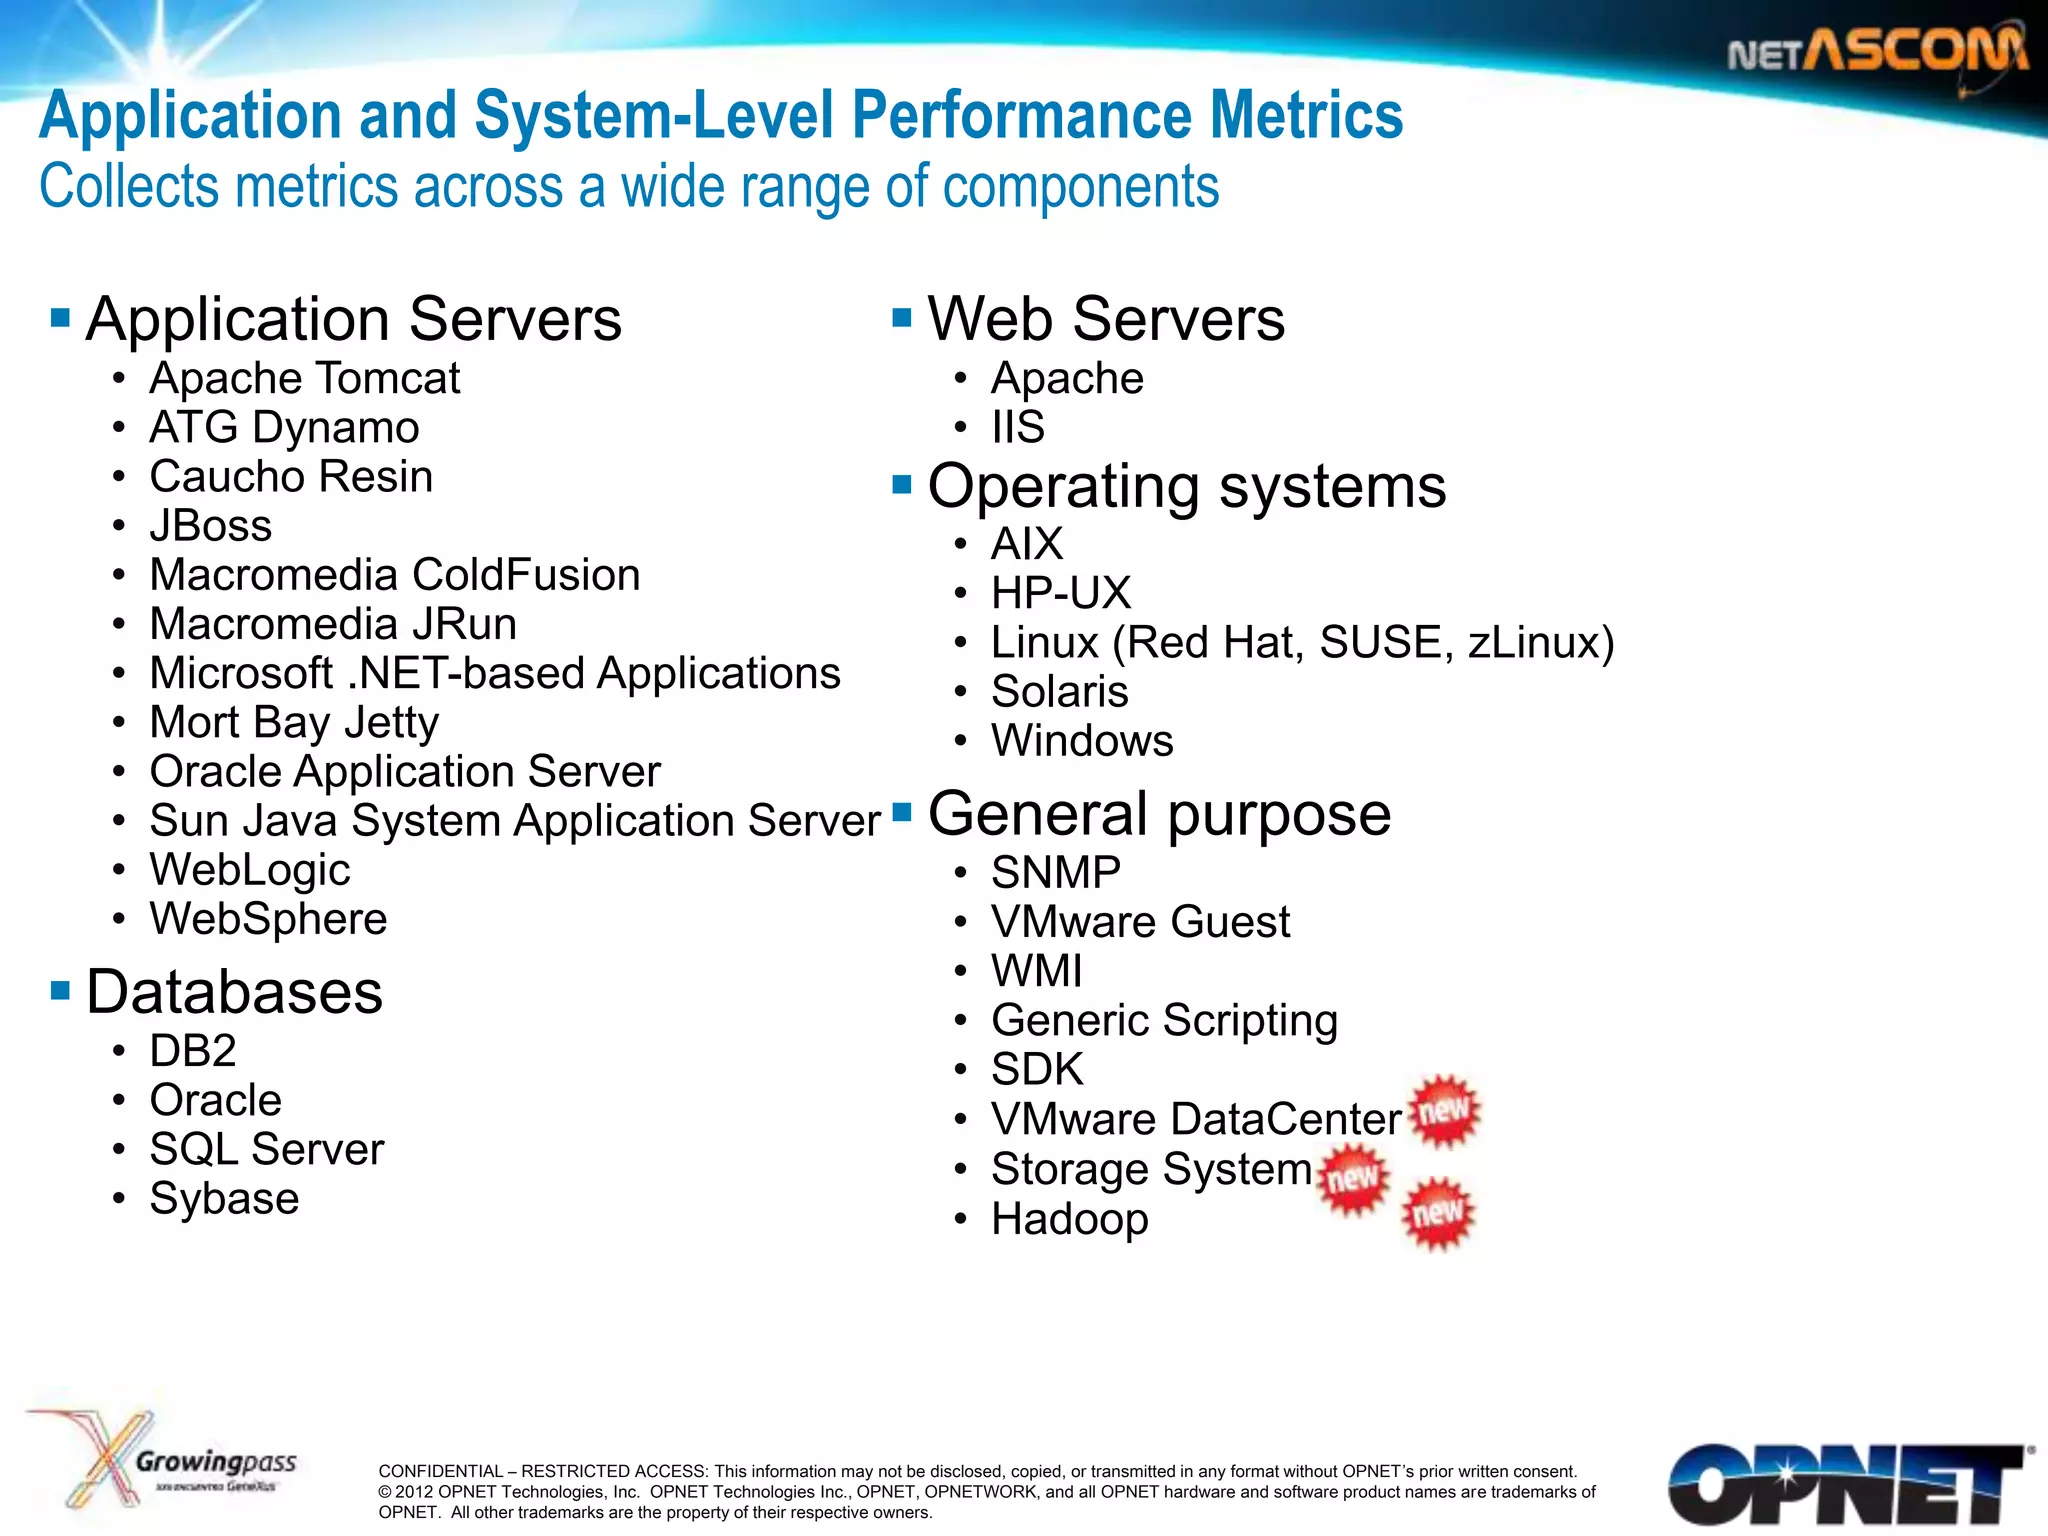
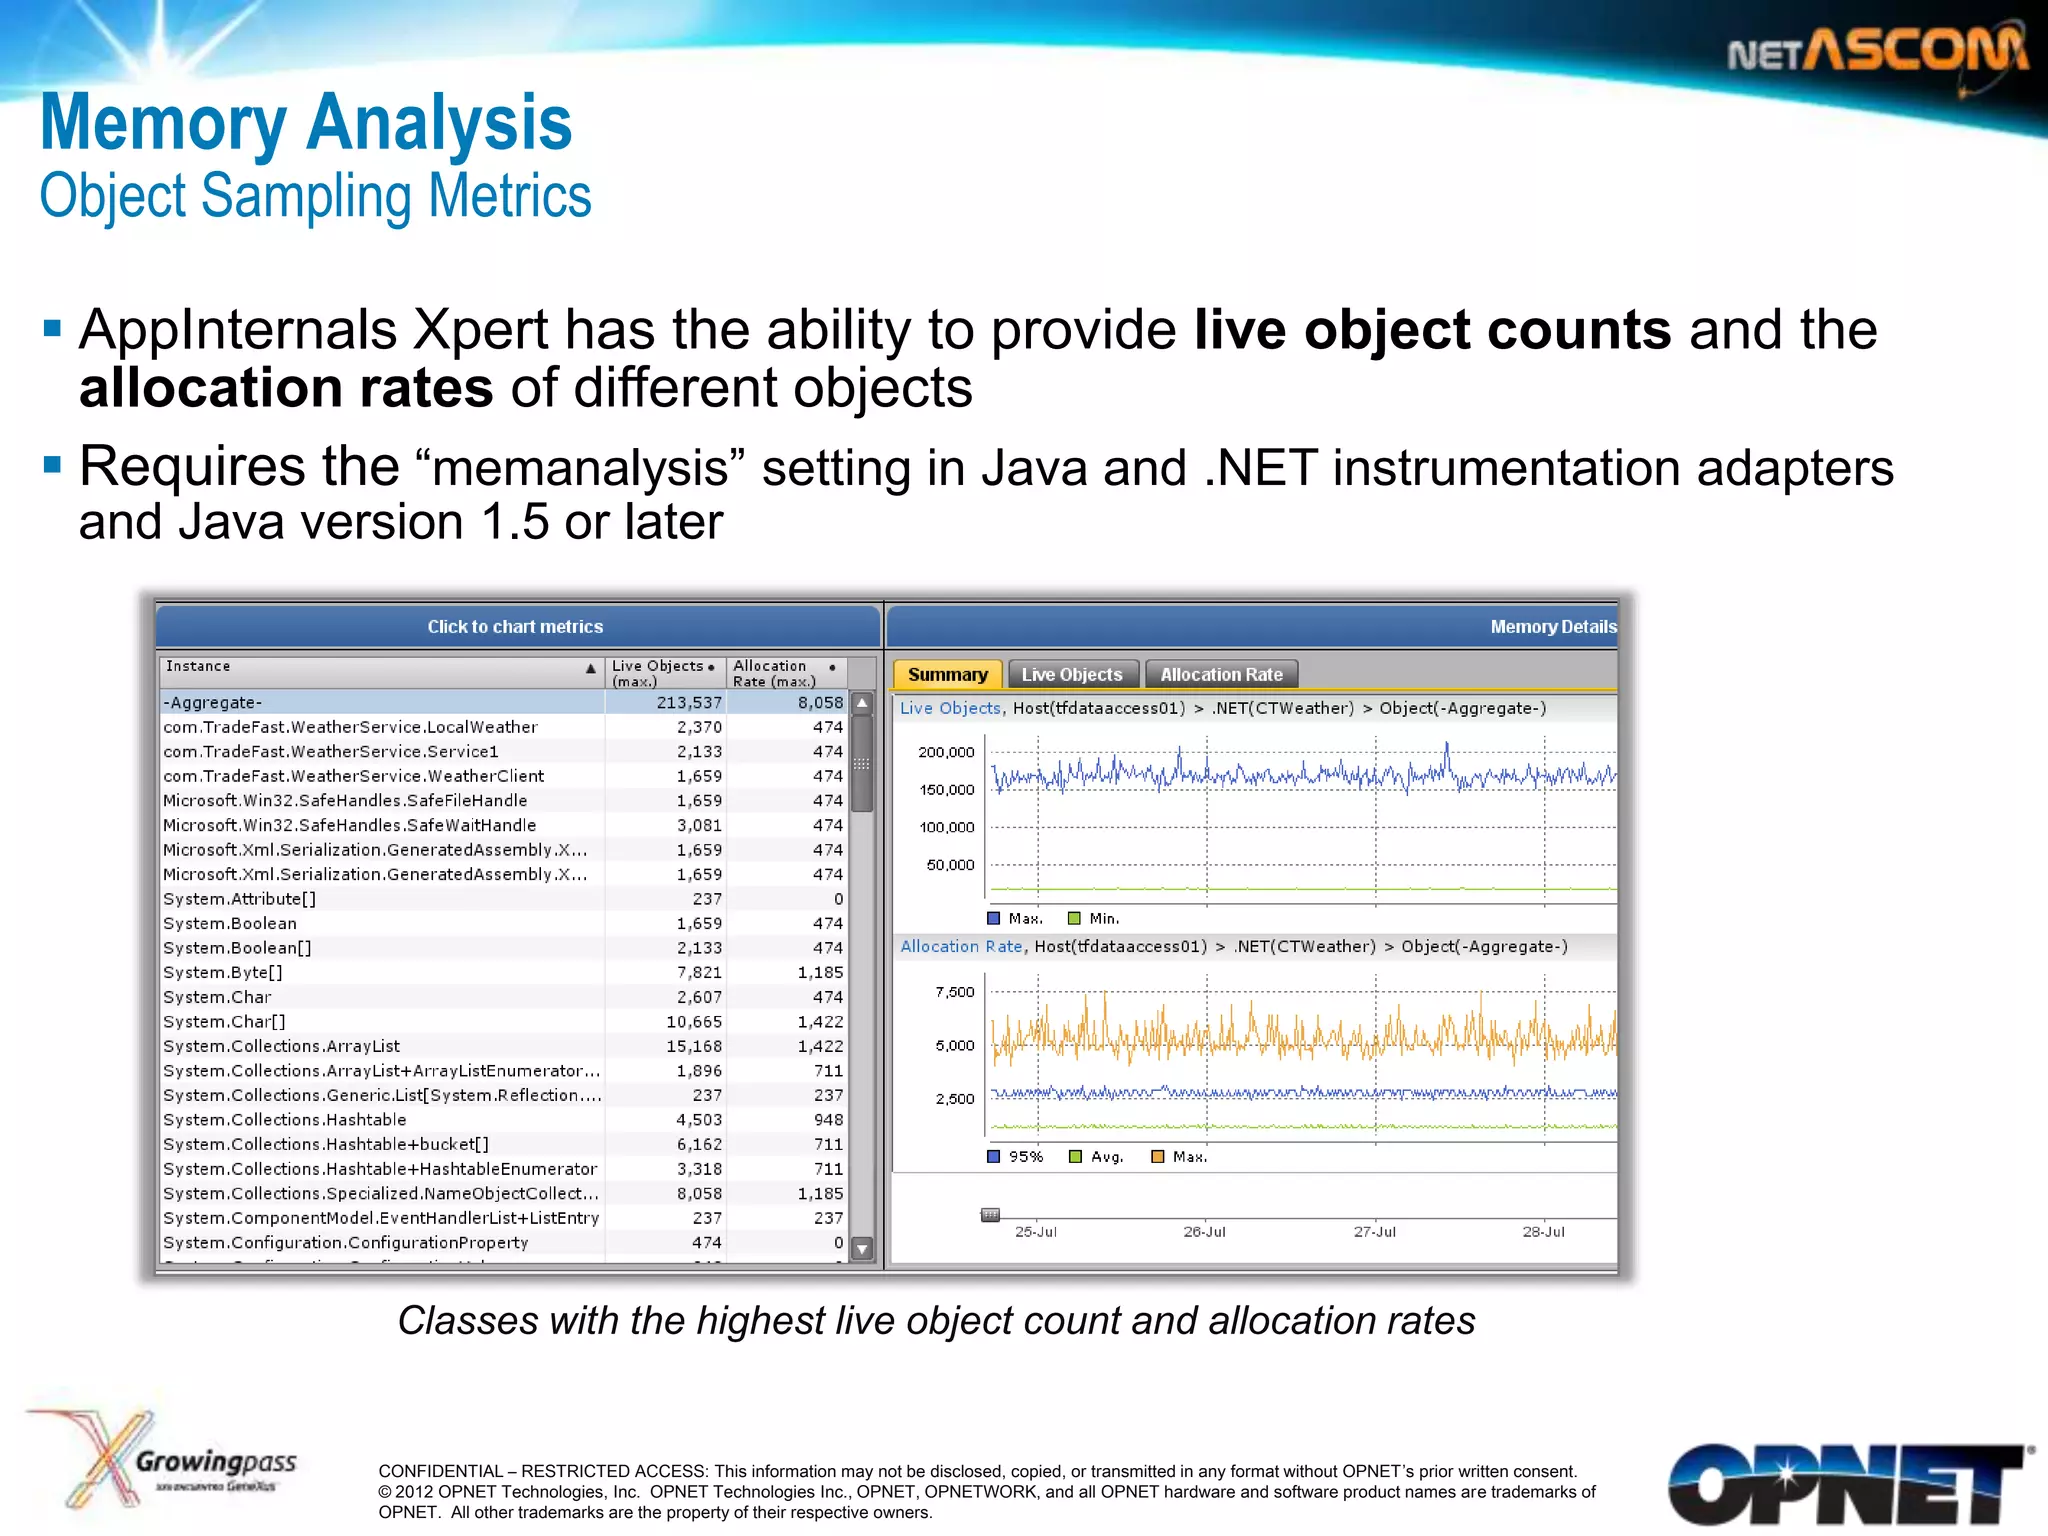
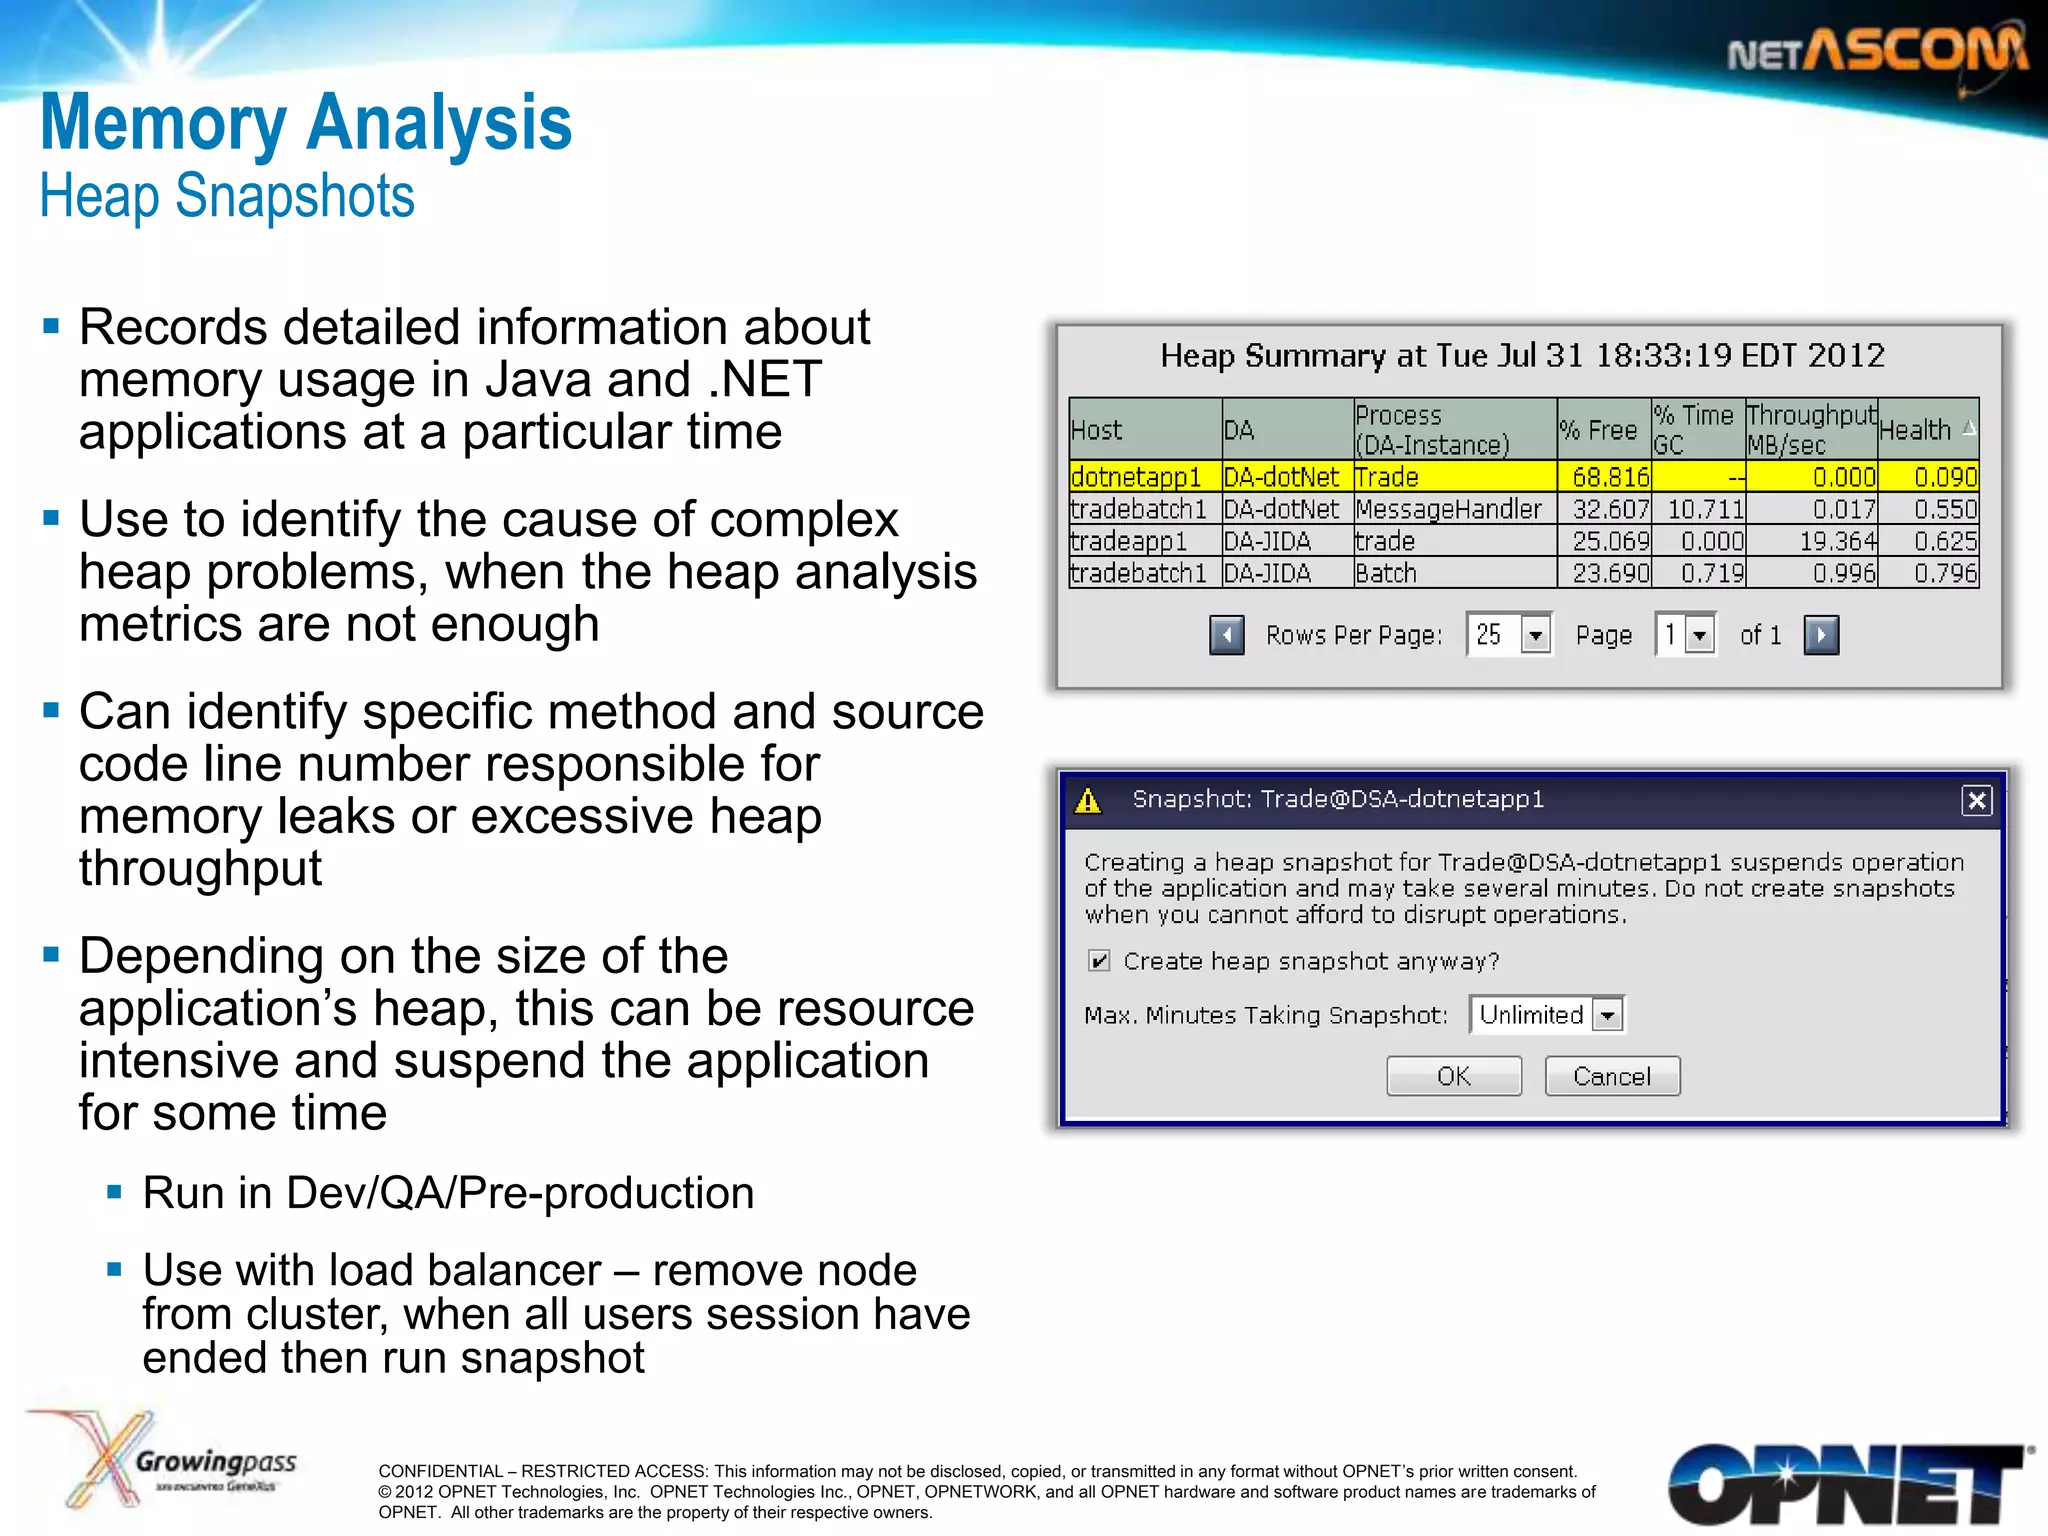


This document discusses an application performance monitoring tool called AppInternals Xpert. It provides three key functions: (1) code-level transaction tracing across tiers, (2) collection of high-resolution performance metrics across all application components, and (3) memory analysis to detect leaks. The tool offers real-time and historical dashboards and scales to monitor hundreds of servers with low overhead through automatic discovery and auto-tuning.