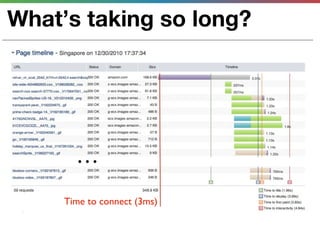
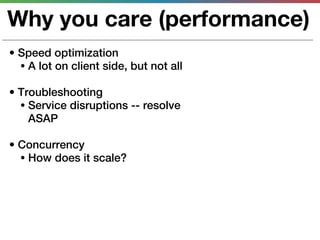
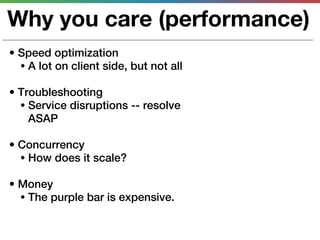
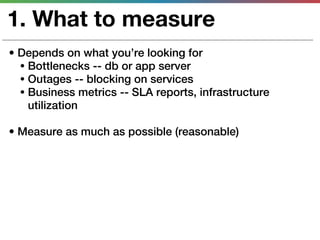
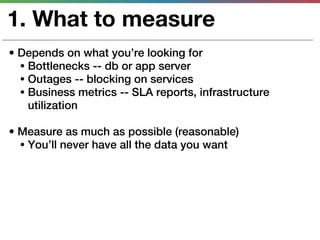
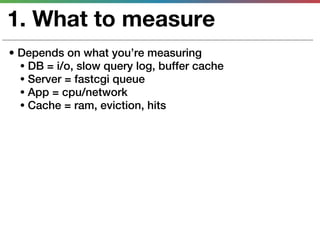
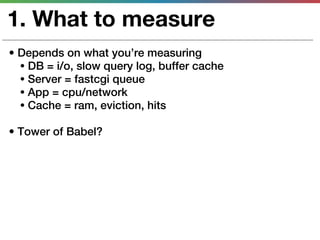
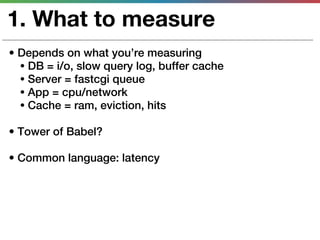
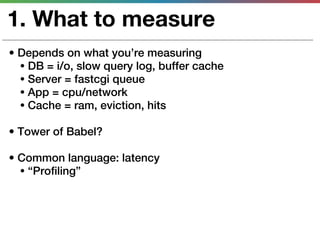
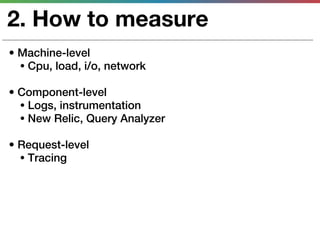
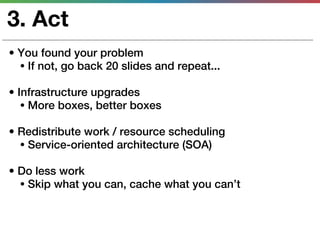
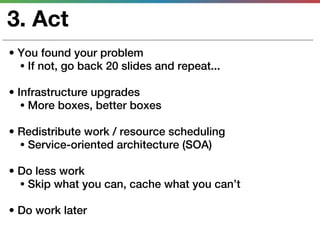
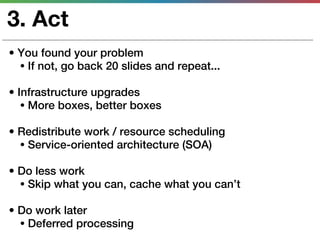
This document discusses various techniques for measuring and improving application performance. It begins by explaining the importance of measuring performance at the machine, component, and request levels. This includes collecting metrics on CPU, memory, I/O, logs, and tracing requests. Once issues are identified, the document recommends actions like caching, queueing work, and rearchitecting systems using service-oriented principles to improve performance. It stresses the importance of an ongoing process of measuring, analyzing data, taking action, and verifying the impact of changes.
Operational Insight: Concepts and Examples (w/o Presenter Notes)royrapoport
The 2015-06-15 Operational Insight presentation, without presenter notes (because the way Keynote handles presenter notes makes them dominate the presentation)
Whether you're looking to make your web app run faster or scale better, one great way to achieve both is to simply do less work. How? By using caches, the data hidey-holes which generations of engineers have thoughtfully left at key junctures in computing infrastructure from your CPU to the backbone of the internet. Requests into web applications, which span great distances and often involve expensive frontend and backend lifting are great candidates for caching of all types. We'll discuss the benefits and tradeoffs of caching at different layers of the stack and how to find low-hanging cachable fruit, with a particular focus on server-side improvements
Beyond Averages - Web Performance MeetupDan Kuebrich
When raw data becomes overwhelming, we turn to abstraction to understand our world. In examining the performance of our systems, the data is always overwhelming. Solutions like summary statistics have come to our rescue, and they are good—up to a point. In order to truly understand our systems, we need to know when and how to sidestep those abstractions,to get deep, detailed performance insight. At this meetup, I’ll explore techniques for visualizing the underlying structure of performance data and how this empowers drilling down to populations and individual samples in the data set.
Brug af sociale tjenester, sociale netværk og web 2.0 software til at skabe så billig markedsføring som muligt.
Internettet er i dag fyldt med muligheder for at markedsføre dig og din virksomhed, og det uden at du behøver betale spidsen af en jetjager.
Der vil blive forklaret hvordan du kan udnytte de mange tjenester til din fordel, og hvad der reelt virker. For ligeså mange muligheder for god markedsføring der er, ligeså mange muligheder for tidsspilde er der.
Workshoppen ledes af Brian Brandt
Make Life Suck Less (Building Scalable Systems)guest0f8e278
This presentation was given at LinkedIn. It is a collection of guidelines and wisdom for re-thinking how we do engineering for massively scalable systems. Useful for anyone who cares about Big Data, Distributed Computing, Hadoop, and more.
This talk evalutes some easy ways to extract useful trending and capacity planning out of your existing monitoring investment. Using Nagios performance data, we examine simple behaviors with PNP4Nagios and graduate on to more insightful analytics with Graphite. With metrics in hand we look at the questions that IT /should/ be asking, such as:
* What sort of data should I trend?
* Why do I need to trend it?
* How do Operational or Engineering trends relate to Business or Transactional monitoring?
* How does this data impact our customer relationship and/or their bottom-line?
Finally, we look at creative ways to get profiling data out of your production systems with a minimum amount of effort from your development team.
Nondeterministic Software for the Rest of UsTomer Gabel
A talk given at GeeCON 2018 in Krakow, Poland.
Classically-trained (if you can call it that) software engineers are used to clear problem statements and clear success and acceptance criteria. Need a mobile front-end for your blog? Sure! Support instant messaging for a million concurrent users? No problem! Store and serve 50TB of JSON blobs? Presto!
Unfortunately, it turns out modern software often includes challenges that we have a hard time with: those without clear criteria for correctness, no easy way to measure performance and success is about more than green dashboards. Your blog platform better have a spam filter, your instant messaging service has to have search, and your blobs will inevitably be fed into some data scientist's crazy contraption.
In this talk I'll share my experiences of learning to deal with non-deterministic problems, what made the process easier for me and what I've learned along the way. With any luck, you'll have an easier time of it!
This presentation was given at LinkedIn. It is a collection of guidelines and wisdom for re-thinking how we do engineering for massively scalable systems. Useful for anyone who cares about Big Data, Distributed Computing, Hadoop, and more.
1st in the "Rewriting the Rules of Perfomance Testing" series. Scott Barber and Dan Bartow discuss ways load and performance teams have "cheated" in the past due to constraints that are eliminated with new cloud-based approaches to testing.
Sean Kandel - Data profiling: Assessing the overall content and quality of a ...huguk
The task of “data profiling”—assessing the overall content and quality of a data set—is a core aspect of the analytic experience. Traditionally, profiling was a fairly cut-and-dried task: load the raw numbers into a stat package, run some basic descriptive statistics, and report the output in a summary file or perhaps a simple data visualization. However, data volumes can be so large today that traditional tools and methods for computing descriptive statistics become intractable; even with scalable infrastructure like Hadoop, aggressive optimization and statistical approximation techniques must be used. In this talk Sean will cover technical challenges in keeping data profiling agile in the Big Data era. He will discuss both research results and real-world best practices used by analysts in the field, including methods for sampling, summarizing and sketching data, and the pros and cons of using these various approaches.
Sean is Trifacta’s Chief Technical Officer. He completed his Ph.D. at Stanford University, where his research focused on user interfaces for database systems. At Stanford, Sean led development of new tools for data transformation and discovery, such as Data Wrangler. He previously worked as a data analyst at Citadel Investment Group.
In this session, we will discuss the Great Simplification Architecture, instead of creating abstract towers of babel, we will see how we can create agile, maintainable and easy to work with architectures and systems that allow you to just go in and start working, rather than spend a lot of time an effort hammering everything in sight, looking for the nail that the architecture diagram's page 239 says must be there.
Expecto Performa! The Magic and Reality of Performance TuningAtlassian
In the enterprise there are rarely simple solutions to highly nuanced problems that satisfy all needs. Several customers might each ask "How do I make Jira/Confluence faster?" and each require a different answer. Using this example, this talk will pick apart the inputs, outputs, concerns, and realities of answering a short question with a long answer. We'll then discuss real-world examples from our own internal instances, to give you a taste of the process we've gone through to solve our own performance problems, and to show why there is no simple playbook; "it depends" on a lot! The key takeaways are:
* The importance of having a shared definition of performance
* The importance of having agreed-upon priorities, including what isn't important
* The importance of measuring (allthethings) and understanding them
* The thing you think is the problem might not be the problem, and vice versa.
* The real world and the ideal world tend to look nothing alike!
Pushing the Bottleneck: Predicting and Addressing the Next, Next ThingIBM UrbanCode Products
Finding bottlenecks in our software delivery processes is often pretty easy. But once we squash one bottleneck, another team becomes the limiting factor. This presentation looks how bottlenecks work, and how to predict the next bottleneck you'll need to work on.
This talk discusses how we structure our analytics information at Adjust. The analytics environment consists of 20+ 20TB databases and many smaller systems for a total of more than 400 TB of data. See how we make it work, from structuring and modelling the data through moving data around between systems.
Performance Optimization of Cloud Based Applications by Peter Smith, ACLTriNimbus
Peter Smith, PhD, Principal Software Engineer at ACL talks about Performance Optimization of Cloud Based Applications at TriNimbus' 2017 Canadian Executive Cloud & DevOps summit in Vancouver
(SPOT205) 5 Lessons for Managing Massive IT Transformation ProjectsAmazon Web Services
Choice Hotels is undertaking a multiyear, $20 million project to recreate our core business engines on AWS. In trying to approach this complex undertaking, we determined that the project itself is a system too. You can apply principles of good architecture and design work in how you approach the project structure and management. Come to this talk by Choice Hotels’ CTO to learn five key lessons and 20 concrete takeaways that you can implement today to help your AWS projects succeed.
Web Performance tuning presentation given at http://www.chippewavalleycodecamp.com/
Covers basic http flow, measuring performance, common changes to improve performance now, and several tools and techniques you can use now.
4. speed: where is it?
DNS
First HTTP Request your boxes
DNS, connection
Fulfill HTTP Request (“Time to first byte”)
5. speed: where is it?
DNS
First HTTP Request your boxes
Subsequent HTTP Requests
DNS, connection
Fulfill HTTP Request (“Time to first byte”)
Download + render page contents
(+js)
14. Why you care (performance)
• Speed optimization
• A lot on client side, but not all
15. Why you care (performance)
• Speed optimization
• A lot on client side, but not all
• Troubleshooting
• Service disruptions -- resolve
ASAP
16. Why you care (performance)
• Speed optimization
• A lot on client side, but not all
• Troubleshooting
• Service disruptions -- resolve
ASAP
• Concurrency
• How does it scale?
17. Why you care (performance)
• Speed optimization
• A lot on client side, but not all
• Troubleshooting
• Service disruptions -- resolve
ASAP
• Concurrency
• How does it scale?
• Money
• The purple bar is expensive.
22. It’s all about tradeoffs
good / evil
risk / reward
fearlessness / sobriety
23. How to make decisions (ideally)
1. Decide what to measure
24. How to make decisions (ideally)
1. Decide what to measure
2. Measure, examine
25. How to make decisions (ideally)
1. Decide what to measure
2. Measure, examine
3. Act
26. How to make decisions (ideally)
1. Decide what to measure
2. Measure, examine
3. Act
4. Check
27. 1. What to measure
• Depends on what you’re looking for
• Bottlenecks -- db or app server
• Outages -- blocking on services
• Business metrics -- SLA reports, infrastructure
utilization
• Measure as much as possible (reasonable)
28. 1. What to measure
• Depends on what you’re looking for
• Bottlenecks -- db or app server
• Outages -- blocking on services
• Business metrics -- SLA reports, infrastructure
utilization
• Measure as much as possible (reasonable)
• You’ll never have all the data you want
30. How to make decisions (ideally)
1. Decide what to measure
31. How to make decisions (ideally)
1. Decide what to measure
2. Measure, examine
32. How to make decisions (ideally)
1. Decide what to measure
2. Measure, examine
3. Act
33. How to make decisions (ideally)
1. Decide what to measure
2. Measure, examine
3. Act
4. Check
34. 1. What to measure
• Depends on what you’re measuring
• DB = i/o, slow query log, buffer cache
• Server = fastcgi queue
• App = cpu/network
• Cache = ram, eviction, hits
35. 1. What to measure
• Depends on what you’re measuring
• DB = i/o, slow query log, buffer cache
• Server = fastcgi queue
• App = cpu/network
• Cache = ram, eviction, hits
• Tower of Babel?
36. 1. What to measure
• Depends on what you’re measuring
• DB = i/o, slow query log, buffer cache
• Server = fastcgi queue
• App = cpu/network
• Cache = ram, eviction, hits
• Tower of Babel?
• Common language: latency
37. 1. What to measure
• Depends on what you’re measuring
• DB = i/o, slow query log, buffer cache
• Server = fastcgi queue
• App = cpu/network
• Cache = ram, eviction, hits
• Tower of Babel?
• Common language: latency
• “Profiling”
38. 2. How to measure
• Machine-level
• Cpu, load, i/o, network
• Component-level
• Logs, instrumentation
• New Relic, Query Analyzer
• Request-level
• Tracing
39. 2. Machine metrics
• You have four basic resources
• CPU
• RAM
• I/O
• Network
• Open-source: Ganglia, Munin, Zabbix, etc.
• Commercial: CloudKick, AppFirst, Librato, etc...
• Everybody uses some form of this
• Facebook monitors over 5 million metrics with
Ganglia
41. 2. Machine metrics
• Home run:
• DB has high CPU wait
• Requests are slow -- why?
• Falling short:
• Low CPU usage on app and DB
• Low disk usage on DB
• Requests are slow -- why?
42. 2. Component metrics
• Very heterogeneous
• Throughput metrics
• Error conditions
• Profiling data
• Collect from:
• Logs: tail -f, Splunk, Loggly, Hoptoad
• Service calls: JMX
• Profiling: xhprof, cProfile
• Other: New Relic, Query Analyzers
• Basically everybody does this too in some form
43. 2. Component metrics
• Home run:
• Low CPU usage on app and DB
• Low disk usage on DB
• App instrumentation shows time spent in service
calls
• fastcgi queue getting deep
• Requests are slow -- why?
64. 3. Act
• You found your problem
• If not, go back 20 slides and repeat...
65. 3. Act
• You found your problem
• If not, go back 20 slides and repeat...
• Infrastructure upgrades
66. 3. Act
• You found your problem
• If not, go back 20 slides and repeat...
• Infrastructure upgrades
• More boxes, better boxes
67. 3. Act
• You found your problem
• If not, go back 20 slides and repeat...
• Infrastructure upgrades
• More boxes, better boxes
• Redistribute work / resource scheduling
68. 3. Act
• You found your problem
• If not, go back 20 slides and repeat...
• Infrastructure upgrades
• More boxes, better boxes
• Redistribute work / resource scheduling
• Service-oriented architecture (SOA)
69. 3. Act
• You found your problem
• If not, go back 20 slides and repeat...
• Infrastructure upgrades
• More boxes, better boxes
• Redistribute work / resource scheduling
• Service-oriented architecture (SOA)
• Do less work
70. 3. Act
• You found your problem
• If not, go back 20 slides and repeat...
• Infrastructure upgrades
• More boxes, better boxes
• Redistribute work / resource scheduling
• Service-oriented architecture (SOA)
• Do less work
• Skip what you can, cache what you can’t
71. 3. Act
• You found your problem
• If not, go back 20 slides and repeat...
• Infrastructure upgrades
• More boxes, better boxes
• Redistribute work / resource scheduling
• Service-oriented architecture (SOA)
• Do less work
• Skip what you can, cache what you can’t
• Do work later
72. 3. Act
• You found your problem
• If not, go back 20 slides and repeat...
• Infrastructure upgrades
• More boxes, better boxes
• Redistribute work / resource scheduling
• Service-oriented architecture (SOA)
• Do less work
• Skip what you can, cache what you can’t
• Do work later
• Deferred processing
73. 3. Caching
• Store things where they can be retrieved more cheaply
(faster)
87. 3. C.R.E.A.M.
• Browser cache
• CDN More speed gain,
• Proxy / optimizer More invalidations
• Opcode cache
• Application-driven
• App-specific cache
• ORM cache
• Local (runtime) cache
• Database
• Query cache Less speed gain,
• Denormalization Fewer invalidations
88. 3. When to cache
• Protect resources
• DB
• Services
• Cover for slow actions
• DB
• Disk hits
• External service calls
• Number-crunching
89. 3. Deferred work
• Presmise: synchronous work is lame
• Go async!
• Mechanism: queue
• RabbitMQ, 0MQ, ActiveMQ, Amazon SQS
Q
app servers workers/hadoop/??
db/cache
90. 3. When to queue
• Actions you can decouple from that page load
• Things that don’t have to update in real-time
• Counter updates (queue and aggregate)
• External API calls
• Long-running requests (ajax)
• Batch processing
• Shell commands
92. 3. SOA
• We’ve got two pages on our website and one box
serving it
def fast_action(): def slow_action():
x *= y x = compute()
render (‘fast.tpl’) render(‘slow.tpl’)
• Problem?
• Slow actions starve fast actions!
• How to remedy?
93. 3. SOA
• Take 1: buy more servers
• But if anyone calls slow action on one, we lose
• All servers must be able to handle slow_action’s
workload
• Take 2: pull out slow action
def fast_action(): def slow_action():
x *= y x = remote_compute()
render (‘fast.tpl’) render(‘slow.tpl’)
• Who does this????
94. 3. Resource scheduling
Low
Low
Low
app
Low High
High Low
Low Low
memcached number-cruncher
95. 3. Resource scheduling
Low
Low
Low
app
Low High
High Low
Low Low
memcached number-cruncher
97. How to make decisions (ideally)
1. Decide what to measure
98. How to make decisions (ideally)
1. Decide what to measure
2. Measure, examine
99. How to make decisions (ideally)
1. Decide what to measure
2. Measure, examine
3. Act
100. How to make decisions (ideally)
1. Decide what to measure
2. Measure, examine
3. Act
4. Check
101. 4. Did we ruin everything?
• If your metrics were right, things are probably faster
• But they’re different
• ... and probably more complicated
• How do we keep track of it?
• Better tools
• Next month: performance and load testing with
Selenium
102. Takeaways
• Hard to solve problems without understanding them at
a fundamental level
• Get data, visualize
• Machine and component metrics are key
• Sometimes they’re not enough
• Once we know a problem, there’s help
• SOA, Cache, Deferral -- complementary tools
• As web systems become more complicated, we must
use more sophisticated tools to monitor and debug
them
split this into 4 pages with more info\n\nso, it’s important, but I’d argue that it’s also particularly interesting, and only getting more so\n
\n
\n
\n
\n
\n
there’s a lot -- too much. here’s a little bit\n
I took a class called making decisions...\nit’s about measuring, then optimizing\ncan’t tell you how to act--that’s too specific\nbut can tell you how to decide how to act\n