Downloaded 266 times

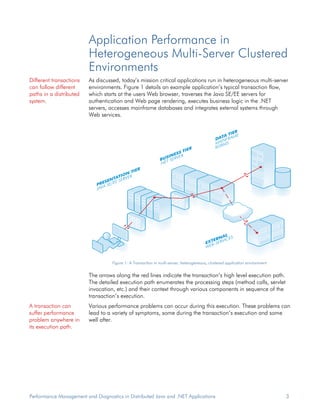
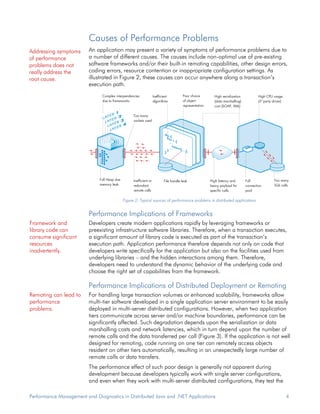
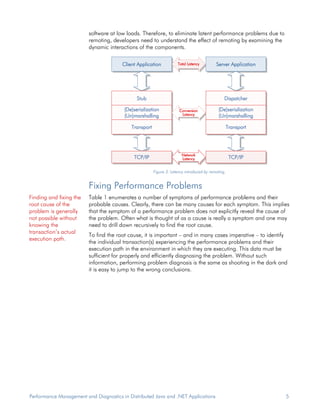
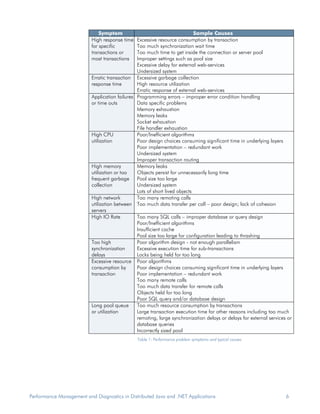
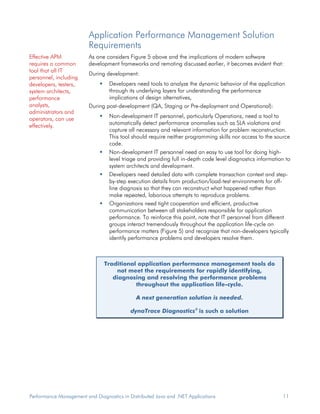

Performance problems are common in mission critical Java and .NET applications running in distributed, heterogeneous environments. Problem resolution takes too much time and resources using current tools. Traditional developer tools like debuggers and profilers do not work in production and do not provide the information needed to diagnose problems across multiple servers. Performance issues can occur anywhere in a transaction's execution path, so simply addressing symptoms does not solve the underlying problem. A new approach is needed to efficiently collect diagnostic data and speed up root cause analysis.


![Afterdeath[1]](https://cdn.slidesharecdn.com/ss_thumbnails/afterdeath1-124219454542-phpapp02-thumbnail.jpg?width=640&height=640&fit=bounds)
![Jesus Teach[1]](https://cdn.slidesharecdn.com/ss_thumbnails/jesusteach1-124219454762-phpapp02-thumbnail.jpg?width=640&height=640&fit=bounds)
![Married[1]](https://cdn.slidesharecdn.com/ss_thumbnails/married1-124219454863-phpapp02-thumbnail.jpg?width=640&height=640&fit=bounds)
![Practicekarma[1]](https://cdn.slidesharecdn.com/ss_thumbnails/practicekarma1-124219455481-phpapp02-thumbnail.jpg?width=640&height=640&fit=bounds)


