Downloaded 21 times
![PPR Maths nbk
MODUL 13
SKIM TUISYEN FELDA (STF) MATEMATIK SPM “ENRICHMENT”
TOPIC : GRADIENT AND AREA UNDER A GRAPH
MASA : 1 JAM
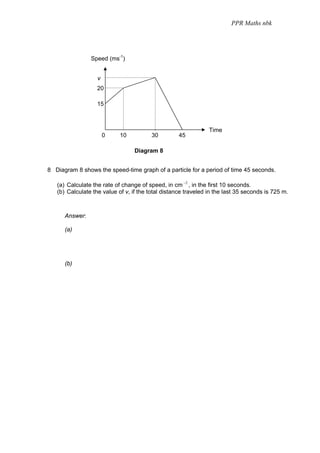
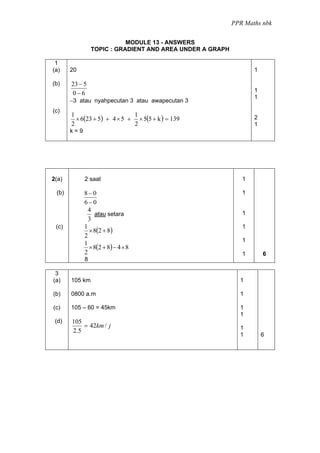
1 Diagram 1 shows the speed-time graph of a particle for a period of 15 s.
Speed (ms-1)
23
k
5
0 Time (s)
6 10 15
DIAGRAM 1
(a) State the distance, in m, the particle moves with constant speed.
(b) Calculate the rate of change of speed, in ms-2, in the first 6 s.
(c) Calculate the value of k, if the total distance travelled in the first 15 s is
139m.
[6 marks]
Answer:
(a)
(b)
(c)](https://image.slidesharecdn.com/module13-gradientandareaunderagraph-130412003608-phpapp02/85/Module13-gradientandareaunderagraph-1-320.jpg)
![PPR Maths nbk
MODUL 13
SKIM TUISYEN FELDA (STF) MATEMATIK SPM “ENRICHMENT”
TOPIC : GRADIENT AND AREA UNDER A GRAPH
MASA : 1 JAM
1 Diagram 1 shows the speed-time graph of a particle for a period of 15 s.
Speed (ms-1)
23
k
5
0 Time (s)
6 10 15
DIAGRAM 1
(a) State the distance, in m, the particle moves with constant speed.
(b) Calculate the rate of change of speed, in ms-2, in the first 6 s.
(c) Calculate the value of k, if the total distance travelled in the first 15 s is
139m.
[6 marks]
Answer:
(a)
(b)
(c)](https://image.slidesharecdn.com/module13-gradientandareaunderagraph-130412003608-phpapp02/75/Module13-gradientandareaunderagraph-1-2048.jpg)
![PPR Maths nbk
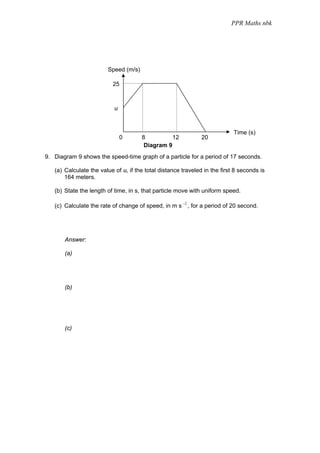
2. Diagram 2 shows the speed-time graph of two particles, α and β for a period of
8s.
Speed (ms-1)
N M
8
J K L
4
O Time (s)
3 6 8
DIAGRAM 2
The graph OKNM represents the movement of particle α and the graph JKL
represents the movement of particle β.Both particles start moving at the same time.
(a) State the length of time, in s, that particle α moves with uniform speed.
(b) Calculate the rate of change of speed, in ms-2, of particle α in the first
6 s.
(c) Calculate the difference in distance, in m, of particle α and particle β
for a period of 8 s.
[6 marks]
Answer:
(a)
(b)
(c)](https://image.slidesharecdn.com/module13-gradientandareaunderagraph-130412003608-phpapp02/85/Module13-gradientandareaunderagraph-2-320.jpg)
![PPR Maths nbk
3. Diagram 3 shows the distance-time graph of the journeys taken by Ali and Fuad.
Distance (km)
F B
105
60
G
O Time
0700 0730 0800 0830 0900 0930
DIAGRAM 3
The straight line OB represents Ali’s journey from town X to town Y, while the
straight line FG represents Fuad’s journey from town Y to town X.
Ali and Fuad uses the same route.
(a) State the distance, in km, of town Y from town X.
(b) Find the time Ali and Fuad meet each other during their journey.
(c) Find the distance when they meet from town Y.
(d) Calculate Fuad’s speed.
[6 marks]
Answer:
(a)
(b)
(c)
(d)](https://image.slidesharecdn.com/module13-gradientandareaunderagraph-130412003608-phpapp02/85/Module13-gradientandareaunderagraph-3-320.jpg)
![PPR Maths nbk
Speed (m s-1)
20
v
time (s)
10 25 30
DIAGRAM 4
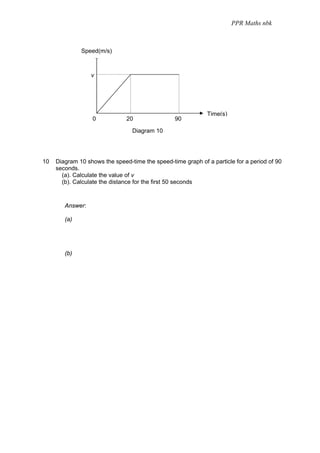
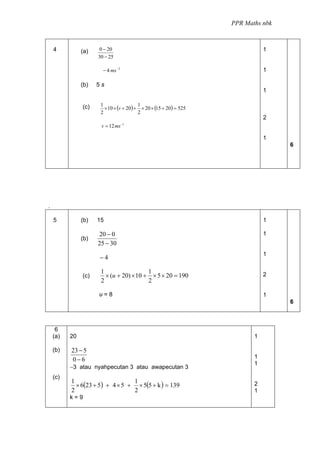
4. Diagram 4 shows the speed-time graph of a motorcyclist in a period of 30
seconds.
Given that the total distance travelled by the motorcyclist is 525 m.
Calculate,
(a) the rate of change of speed in the last 5 second,
(b) the duration of uniform speed,
(c) the value of v.
[6 marks]
Answer:
(a)
(b)
(c)](https://image.slidesharecdn.com/module13-gradientandareaunderagraph-130412003608-phpapp02/85/Module13-gradientandareaunderagraph-4-320.jpg)
![PPR Maths nbk
5. Diagram 5 shows a velocity-time graph for a particle.
velocity ( m s-1)
20
u
O 15 25 30 time (s)
DIAGRAM 5
(a) State the time, in s, the particle moves with constant velocity.
(b) Calculate the accleration, in m s-2, of the particle in the last 5
seconds.
(c) Find the value of u if the total distance travelled after 15 seconds is
190 m.
[ 6 marks ]
Answer:
(a)
(b)
(c)](https://image.slidesharecdn.com/module13-gradientandareaunderagraph-130412003608-phpapp02/85/Module13-gradientandareaunderagraph-5-320.jpg)
![PPR Maths nbk
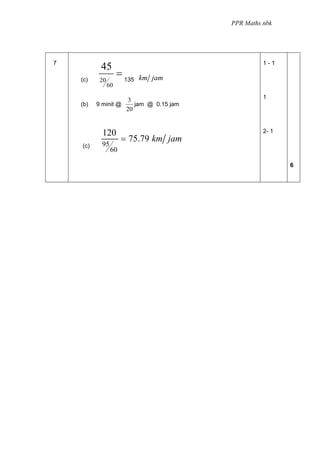
6. Diagram 6 shows a displacement – time graph for the journey of a car from town A
to town C passing town B and then back to town A.
Displacement (km)
60 C
B
45
A0 Time (min)
20 55 64 95
DIAGRAM 6
(a) Calculate the speed in km/h for the journey from town A to town B.
(b) State the time taken for the car to stop at town C.
(c) Calculate the average speed in km/h for the total distance of the car.
[ 6 marks ]
Answer:
(a)
(b)
(c)](https://image.slidesharecdn.com/module13-gradientandareaunderagraph-130412003608-phpapp02/85/Module13-gradientandareaunderagraph-6-320.jpg)

1. The document provides worked solutions to 10 math word problems involving gradient and area under graphs. The problems involve calculating distances, rates of change of speed, values on graphs, and average speeds using information from speed-time and distance-time graphs. 2. The solutions show the step-by-step working and calculations to arrive at the answers for each part of the problems. Formulas for calculating gradient, area under graphs, and distances from rates and times are used. 3. The document serves as an example of how to apply mathematical concepts of gradient, area under graphs, and kinematic formulas to real-world word problems and arrive at quantitative solutions.


![Topic 1 - Forces and Motion [Autosaved].pptx](https://cdn.slidesharecdn.com/ss_thumbnails/topic1-forcesandmotionautosaved-231219145058-b924d3b6-thumbnail.jpg?width=640&height=640&fit=bounds)