This document discusses the modeling and analysis of induction motors using LabVIEW software, highlighting the complexity involved in their study due to the integration of power electronic switches. It presents a methodology for simulating the motor's performance based on mathematical equations, allowing for graphical analysis and monitoring of motor characteristics, such as torque vs. speed and load testing. The findings emphasize LabVIEW's advantages in providing a dynamic graphical interface for real-time motor analysis and fault diagnosis.
![International Journal of Power Electronics and Drive System (IJPEDS)
Vol. 5, No. 3, February 2015, pp. 344~354
ISSN: 2088-8694 344
Journal homepage: http://iaesjournal.com/online/index.php/IJPEDS
Modelling and Analysis of Induction Motor using LabVIEW
E.Ramprasath, P.Manojkumar
Departmentof Electrical and Electronics Engineering, K.S.Rangasamy College of Technology
Article Info ABSTRACT
Article history:
Received Oct 4, 2014
Revised Dec 22, 2014
Accepted Jan 13, 2015
Induction motor characteristics became complex to study, after the invention
of drives where the motor incorporated with power electronic switches such
as thyristor, diodes, GTO, and MOSFET. Induction motor characteristics can
be studied and modelled with software such as Finite Element Analysis and
Laboratory Virtual Instrument Engineering Workbench. Finite Element
Analysis is used to study and model the motor might be complex and the
time taken to compute was unreliable. In this paper induction motor was
modeled with the help of LabVIEW software this allows us to model and
simulate the motor in order to analyze the performance. The induction motor
modelled here was based on the mathematical equations.
Keyword:
Characteristics
Induction Motor
LabVIEW
Modelling
Simulation Copyright © 2015 Institute of Advanced Engineering and Science.
All rights reserved.
Corresponding Author:
E.Ramprasath,
Department of Electrical and Electronics Engineering,
K.S.Rangasamy College of Technology,
K.S.R Kalvi Nagar, Tiruchengode, Namakkal - 637215, Tamil Nadu, India.
Email: ramprasath009@gmail.com
1. INTRODUCTION
Induction motor designing based on the equation is bit complex, because equation whose terms are
not of the first degree and more over it is a strongly coupled system. The input and output variable
relationship is almost complex thus simulation of induction motor physically is hard. Most commonly
employed software are PSpice, Finite Element Analysis, Matrix Laboratory and Laboratory Virtual
Instrument Engineering Workbench other software rather than is, are created based on the text lines.
LabVIEW software is based on the graphical programming environment. LabVIEW software has a dynamic
nature which contributes to this dynamic tracking of processing the data. The changes in this data can be can
be observed continuously. Dynamic analyzing is established based on both the mathematical and physical
model. Normally equivalent circuit of induction motor resembles the equivalent circuit of transformer where
the airgap between the stator and rotor in the induction motor differentiate from the transformer. LabVIEW
software of following qualities such as multi-dimensional plots, xy graphs, report generation in excel, word
makes this software accessible and has a unique feature, which simplifies the simulation process [1].
The dynamic and steady state analysis of induction motor are difficult to compute so modelling a
motor using mathematical model helps to eliminate the further consequences. So the determination of
parameters must be accurate for carrying out multiple analysis. Machine performance changes as the coupled
system inertia changes it also contributes to the change in the load torque. Motor constancy changes if the
motor inertia and load torque of that motor changes. Identifying faults in electric motor using LabVIEW is
growing research area where many researchers giving their valuable contribution to find out faults in
motor.Electric motor comprises of numerous motor which are developed and improved day by day in that
Induction motor monitoring and faults diagnosis is a feature rich area because induction motor is the widely
used motor which occupies nearly 75 % of drives in industries so only they’re widely known as the work
horse of an industry [2-3].](https://image.slidesharecdn.com/0726jan1513jan1522dec14ijpedsmodellinglabviewedit-171214012109/75/Modelling-and-Analysis-of-Induction-Motor-using-LabVIEW-1-2048.jpg)
![IJPEDS ISSN: 2088-8694
Modelling and Analysis of Induction Motor using LabVIEW (E.Ramprasath)
345
2. PRELIMINARY EQUIVALENT CIRCUIT & MATHEMATICAL EXPRESSION
Induction motor is commonly known as the work horse of an industry owing to the robust nature,
rugged construction and reliable operation. When an alternating current is provided to the secondary winding
circuit of the induction motor it produces the revolving magnetic flux around the stator. Air gap act as the
dielectric medium which separates the rotor from the stator without having any physical contact. This
revolving magnetic flux cuts the rotor windings axially as a result it produces an induced electromotive force
in the rotor which is sinusoidal in nature. In a squirrel cage induction motor the end rings are short circuited,
which provides the path for the induced current to flow across the rotor windings. The current induced in the
rotor starts to circulate which produces a magnetic field in a direction opposite to the cause. Production of
torque is owing to the fundamental interaction between these two counter balancing magnetic fields due to
the applied voltage to the stator [4].
Figure 1. Equivalent Circuit Parameters of an Induction Motor
Slip is defined as the ratio of the difference between the synchronous speed and the actual motor
speed to the ratio of the synchronous speed.
In general induction motor the torque is directly proportional to the product of the rotor current and
flux per stator pole. The electromagnetic torque in synchronous watt can be expressed as:
∗
Stator copper loss which occurs at the induction motor:
Rotor copper loss which occurs at the induction motor:
Input power which of the induction motor:
√3 cos 3 cos
Air gap power of the induction motor:
Core loss which occurs at the induction motor:
Output power which of the induction motor:
Torque induced which occurs at the induction motor:](https://image.slidesharecdn.com/0726jan1513jan1522dec14ijpedsmodellinglabviewedit-171214012109/75/Modelling-and-Analysis-of-Induction-Motor-using-LabVIEW-2-2048.jpg)
![ ISSN: 2088-8694
IJPEDS Vol. 5, No. 3, February 2015 : 344 – 354
346
Figure 2. Power flow diagram of the induction motor
3. LabVIEW INTRODUCTION & BUILDING THE MODEL
National Instruments developed LabVIEW software for the first time in the year 1986 for the Apple
Macintosh Company. It was conceptualized as a programming environment for hardware control. The
introduction of an interface between the Personnel Computer and the instrument which is to be controlled by
software was the main aim. The graphical user interface which is used to simulate the controlled instrument
on the computer monitor itself with the help of LabVIEW software. LabVIEW is also a graphical
programming language, it is familiarly known as “G code”. Applications created in LabVIEW are called
“Virtual Instruments” [5]. Nowadays LabVIEW software is also compatible with other operating system such
as Windows and Linux, etc. The word LabVIEW is an acronym for Laboratory Virtual Instrument
Engineering Workbench which is a graphical programming language based on graphical icons instead of
number of programming codes for simulation purpose. LabVIEW software allows the user to build their own
set of virtual instrument easily. These programs are known as Virtual Instruments, or VIs, due to their
operational replica of physical instruments, like temperature monitor, spectral scopes, pressure gauges,
cathode ray oscilloscopes, and multi-meters etc.The inputs are known as controls and the outputs are known
as indicators are placed on the graphic user interface (GUI) called Front Panel (FP). They communicate with
each block diagram through terminals of the icons. In LabVIEW the data flow of the program will be from
left to write, but in C/C++ programming codes will be executed in order of top to bottom, errors in the
LabVIEW will be easily identified during the execution of the program itself [6].
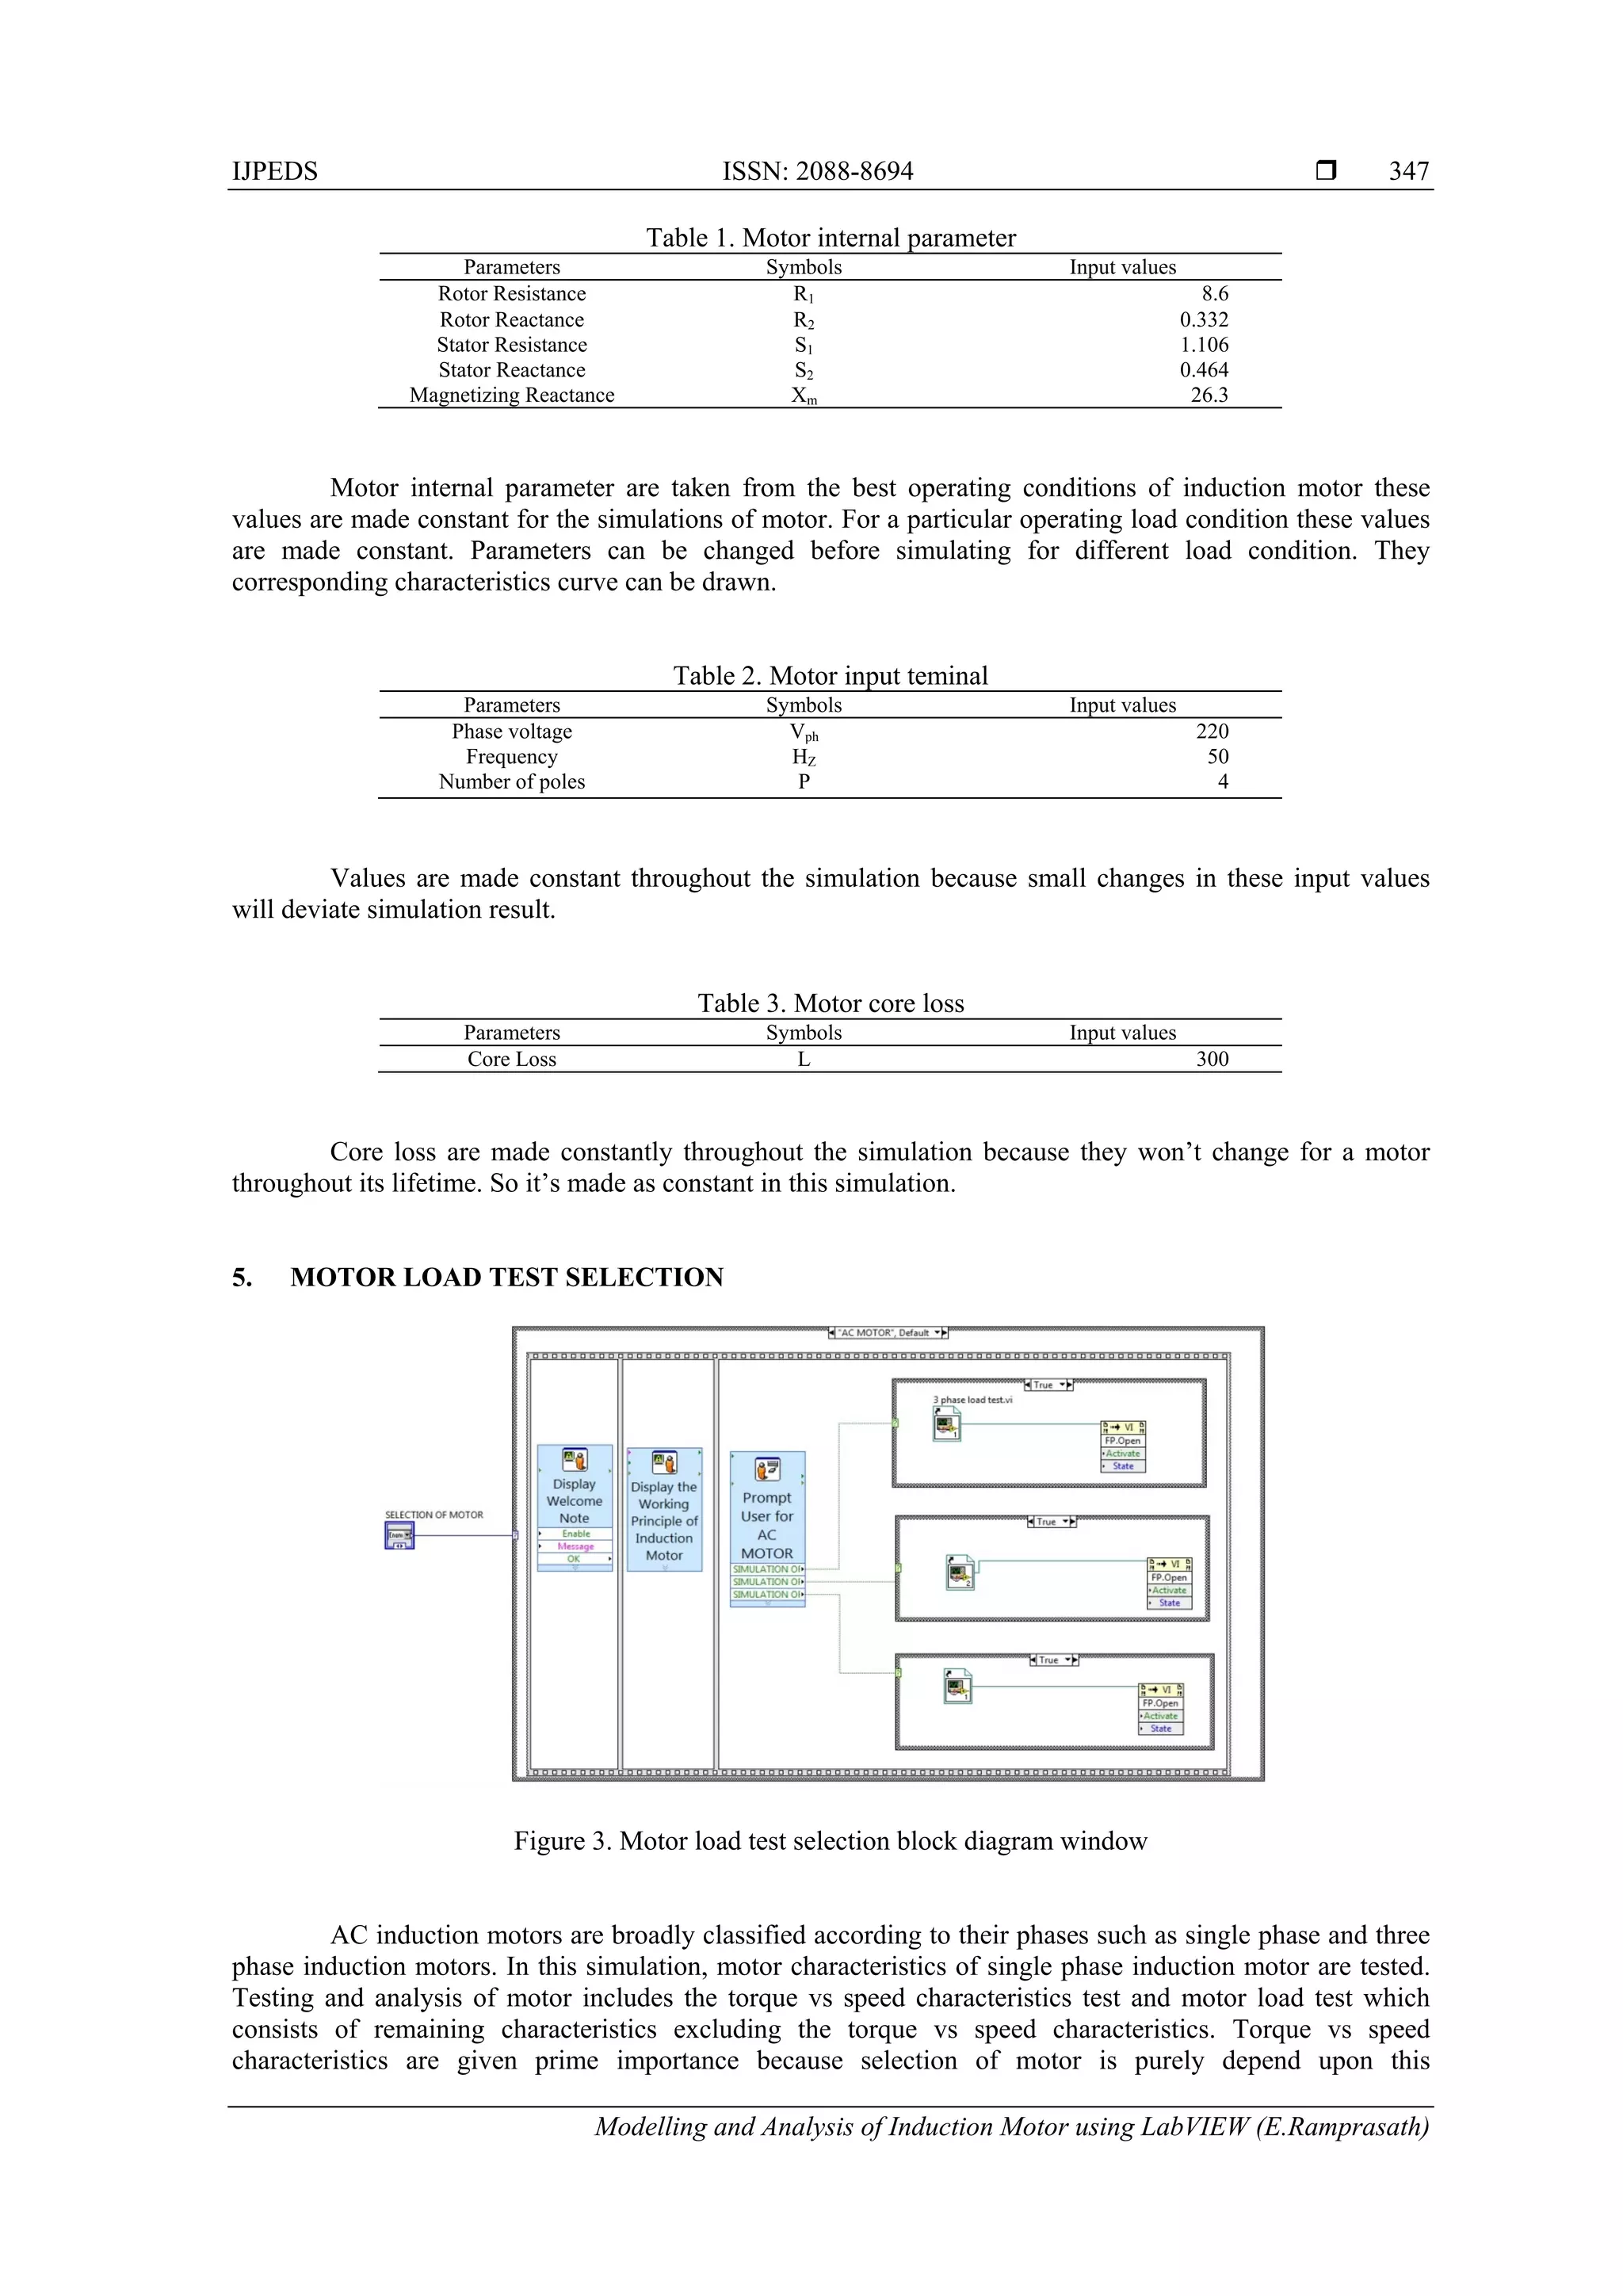
4. SIMULATION OF INDUCTION MOTOR CHARACTERISTICS USING LabVIEW
Machine’s modelling developed in LabVIEW software is based on the mathematical expressions.
Mathematical equations are first derived then converted into models using icons from the arithmetic board
for further implementation in LabVIEW for graphical analysis [7]. List of simulation for Induction Machine
in LabVIEW follows:
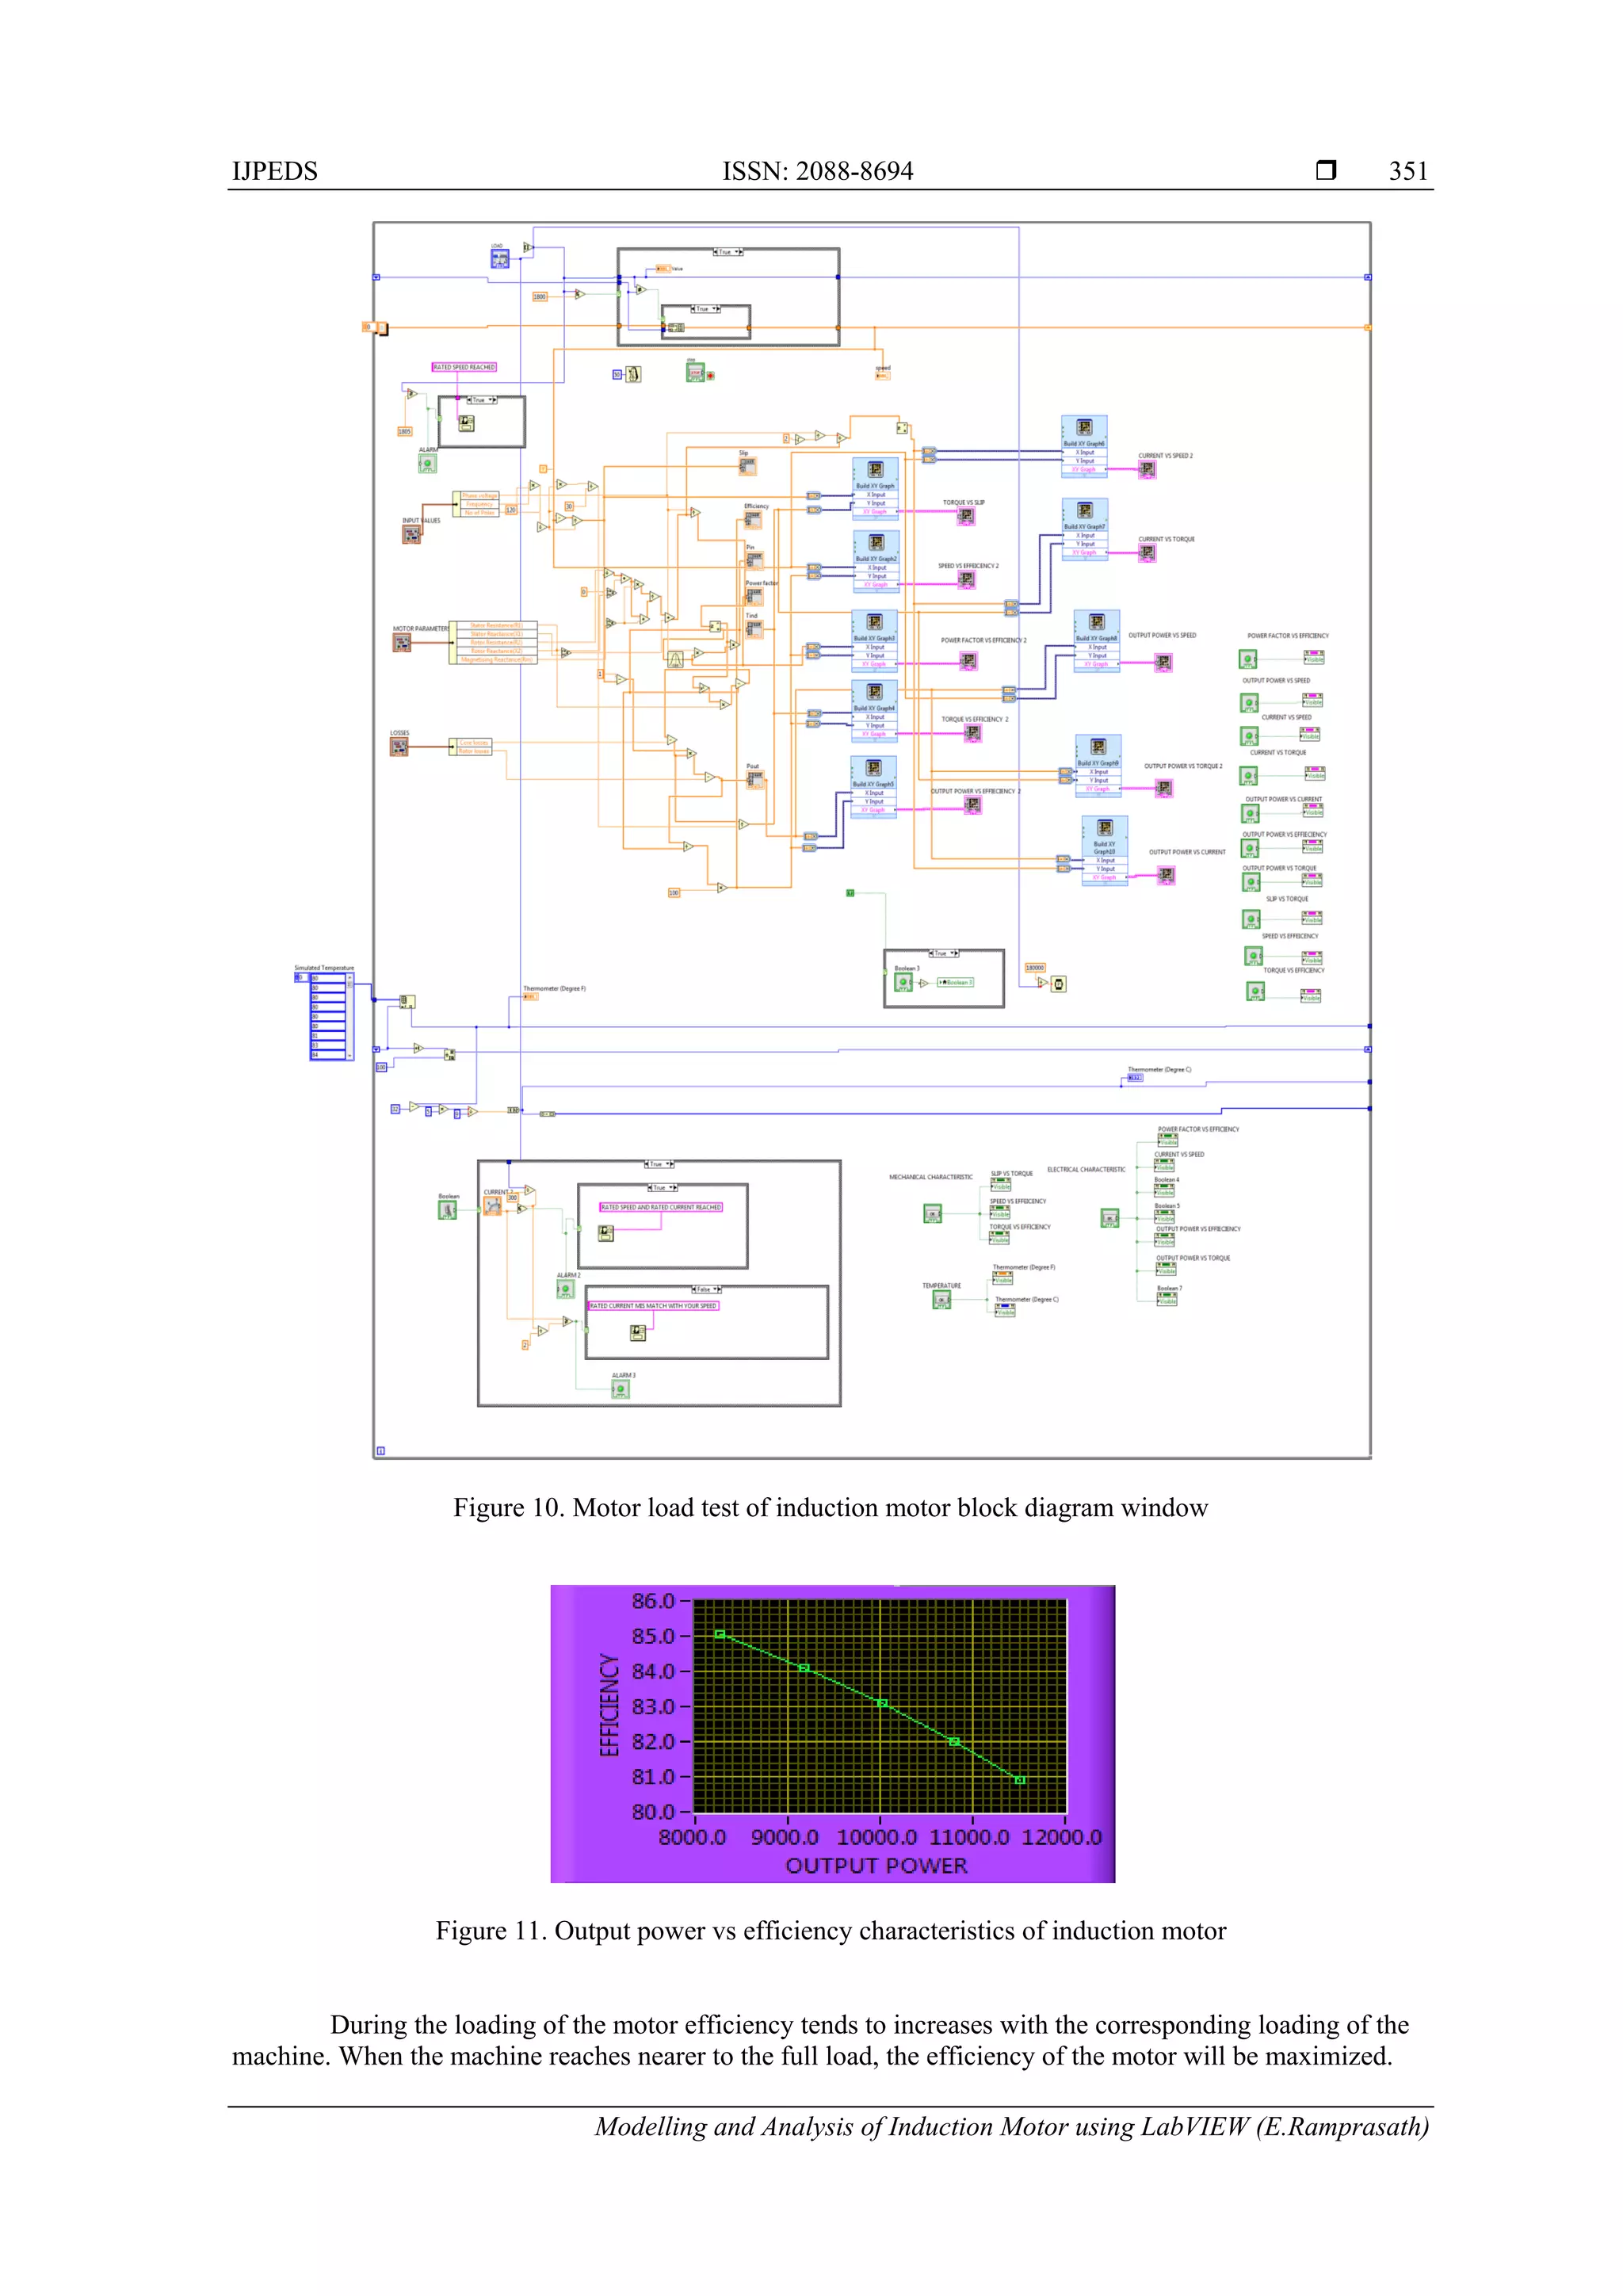
a) Simulation Torque Vs Speed relationship of an Induction Motor
b) Simulation of Induction Motor Load Test
The above said simulation can be build using the parameters. Parameters which are used to model
the induction motor are described below with their corresponding symbols to have a clear idea before
modelling motor. The simulations performed here to analyses the modelled motor with its characteristics
which can be compared to the healthy motor in real time and it moreover helps to achieve the improvements
in motor modelling before manufacturing it in factories. By changing the above input parameters
corresponding values can be obtained in the form of graphical representation. By changing the given load
changes in the motor speed and torque can be achsievedand their corresponding characteristics of induction
motor can be displayed in the form of graph representation. By changing the individual parameter for a
particular speed will also be displayed in this simulation. Here core loss is the considered as the constant loss
of a particular induction motor which is to be modeled [8-17].](https://image.slidesharecdn.com/0726jan1513jan1522dec14ijpedsmodellinglabviewedit-171214012109/75/Modelling-and-Analysis-of-Induction-Motor-using-LabVIEW-3-2048.jpg)
![IJPEDS ISSN: 2088-8694
Modelling and Analysis of Induction Motor using LabVIEW (E.Ramprasath)
353
Figure 15. Speed vs efficiency characteristics of inducton motor
6. CONCLUSION
The analysis of this experimental result shows that induction motor model was built with the
LabVIEW software. It can be used to model and simulate the working process of induction motor by which
motor performance calculated, is set to compare with the real time operating consideration of the induction
motor for the optimal operation of machines. The creation of the induction motor model can be bundled into a
sub-Virtual Instrumentation, for further experimental studies. This type of work can be further proceeded to
the other machines such as DC machine and special electrical machine. It helps the manufacturer to study the
motor performance before manufacturing it. Modelling the electric motor in LabVIEW, gives the possibility,
to use the capabilities of this powerful graphical programming language, in studying various problems, related
to this component of the power system. Since LabVIEW interfaces easily to a large number of hardware by
multifunctional data acquisition cards, electric motors model can be easily modelled and they are used to study
the various characteristics of motors.Analysis can be further used to study the performance of the motor,
because testing a motor in real time situation requires huge initial investment and requires time. If the motor
fails to achieve the rated efficiency, efficacy, then it became useless. This modelling and analysis aid to avoid
these type of losses such recoverable financial loss and non-recoverable time loss and provide the best
platform to study the characteristics of the motor.
REFERENCES
[1] RK Rajput. Electrical Machines. First Edition, New York. McGraw-Hill. 199; 3352-353.
[2] R Krishnan. Electric Motor Drives Modeling, Analysis and Control. First Edition, Prentice-Hall International, Inc.
Upper Saddle River, New Jersey 07458, 2001.
[3] R Gunabalan et al. Simulation of Inverter fed Induction Motor Drive with LabVIEW. International Journal of
Electrical, Robotics Electronics and Communications Engineering. 2014; 8(1): 91-95.
[4] Gentian dume. Synchronous Generator Model based on LabVIEW Software. WSEAS Transactions on Advances in
Engineering Education. 2013; 10: 101-112.
[5] RA Jabbar, et al. Simulation of Electrical Machines Laboratory using LabVIEW. International Conference on
Computer, Electrical, andSystems Science, and Engineering, World Academy of Science Engineering and
Technology. 2010; 29-31.
[6] Abdenour Soualhi, et al. Detection and Diagnosis of Faults in Induction Motor using an Improved Artificial ANT
Clustering Technique. IEEE Transactions on Industrial Electronics. 2013; 60: 4053 – 4062.
[7] M Aderiano da Silva, et al. Rotor Bar Fault Monitoring method based on Analysis of Air-Gap Torques of Induction
Motors. IEEE Transactions on Industrial Informatics. 2013; 9: 2274–2283.
[8] Bogdan Virlan, et al. Induction Motor with outer Rotor and Ring Stator Winding for Multispeed Applications. IEEE
Transactions on Energy Conversion. 2013; 28: 999 – 1007.
[9] L Daniel Ransom, Randy Hamilton. Extending Motor Life with Updated Thermal Model Overload Protection. IEEE
Transactions on Industry Applications. 2013; 49: 2471 – 2477.
[10] Gianmario Pellegrino, et al. Comparison of Induction and PM Synchronous Motor Drives for EV Application
Including Design Examples. IEEE Transactions on Industry Applications. 2012; 48: 2322 – 2332.
[11] N Konstantinos Gyftakis, et al. A Novel Approach for Broken Bar Fault Diagnosis in Induction Motors through
Torque Monitoring. IEEE Transactions on Energy Conversion. 2013; 28: 267 – 277.
[12] Lu´ıs Alberto Pereira, et al. Influence of Saturation on the Airgap Induction Waveform of Five-Phase Induction
Machines. IEEE Transactions on energy Conversion. 2012; 27: 29 – 41.
[13] Pinjia Zhang, et al. A Nonintrusive Winding Heating Method for Induction Motor using Soft Starter forPreventing
Moisture Condensation. IEEE Transactions on Industry Applications. 2012; 48; 117 – 123.
[14] Sungho Lee, et al. Evaluation of the Influence of Rotor Axial Air Ducts on Condition Monitoring of Induction
Motors. IEEE Transactions on Industry Applications. 2013; 49: 2024 – 2033.](https://image.slidesharecdn.com/0726jan1513jan1522dec14ijpedsmodellinglabviewedit-171214012109/75/Modelling-and-Analysis-of-Induction-Motor-using-LabVIEW-10-2048.jpg)
![ ISSN: 2088-8694
IJPEDS Vol. 5, No. 3, February 2015 : 344 – 354
354
[15] Woosuk Sung, etal. Energy-Efficient and Robust Control for High-Performance Induction Motor Drive with an
Application in Electric Vehicles. IEEE Transactions on Vehicular Technology. 2012; 61: 3394 – 3405.
[16] K Vinoth kumar. A Review of Voltage and Current Signature Diagnosis in Industrial Drives. IJPEDS. 2011; 1: 75 –
82.
[17] RL Chakrasali, et al. A Novel Method of Starting Induction Motor – A Comparative Study. IJPEDS. 2011; 1: 41 –
46.
BIBLIOGRAPHY OF AUTHORS
E. Ramprasath received B.E degree in Electrical and Electronics engineering from Velalar
College of Technology, Thindal, Erode, Tamil Nadu, India. Now currently pursuing M.E degree
in Power Electronics and Drives at K.S.Rangasamy college of Technology, Tiruchengode,
Namakkal, Tamil Nadu, India. His area of interest is Power Electronics and Drives, and
Electrical Machines.
P.Manojkumar received B.E degree in Electrical and Electronics Engineering from Karpagam
University, Coimbatore, Tamil Nadu and India. He received M.Tech degree in Embedded
Systems from Amrita Vishwa Vidyapeetham University, Amrita Nagar, Coimbatore, Tamil
Nadu and India. He is currently working towards the Ph.D. degree in automotive electronics, his
area of research fuel savings in automobiles by universal ECU with multiple fuel ignition system
using LabVIEW at Anna University, Chennai, Tamil Nadu, and India. His area of interest is
Microprocessor and Microcontroller, and Embedded systems](https://image.slidesharecdn.com/0726jan1513jan1522dec14ijpedsmodellinglabviewedit-171214012109/75/Modelling-and-Analysis-of-Induction-Motor-using-LabVIEW-11-2048.jpg)


