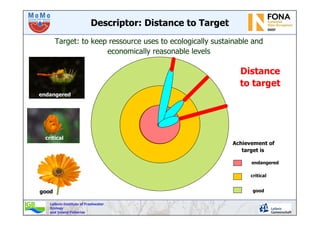
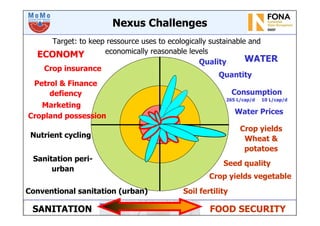
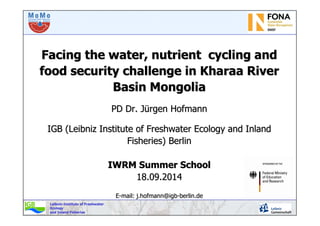
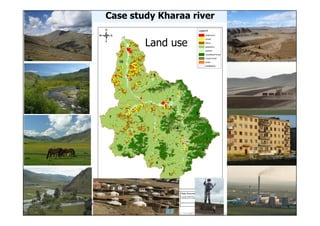
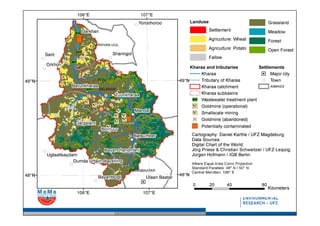
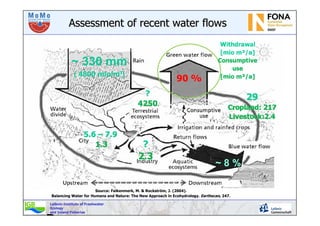
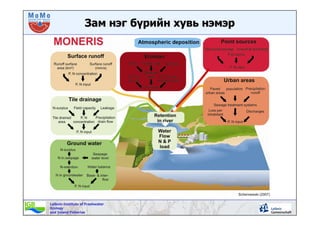
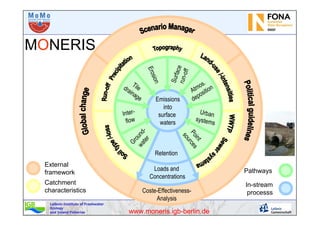
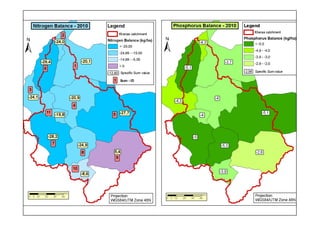
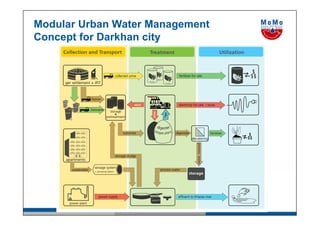
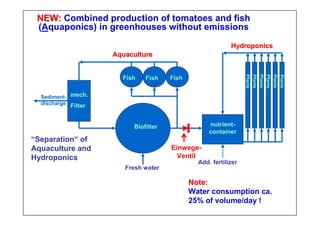
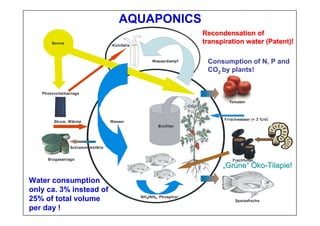
The document discusses integrated water resources management (IWRM) strategies in the Kharaa River Basin, Mongolia, emphasizing the interplay between water, nutrient cycling, and food security. It highlights monitoring climate and hydrological trends, assessing water quality, and developing sustainable agricultural practices to address environmental pressures. A modular urban water management concept is proposed for Darkhan city, focusing on aquaponics and hydroponics to minimize emissions and use water efficiently.


![Spatial variability of simulated discharge,
importance of Kharaa headwaters
Kharaa I
Bayan Gol
Bayan Gol I
Boroo
Gol
Tunkhelin
Gol
Kharaa II
Sugnugr Gol
Mandalin Gol
Zagdalin Gol
Kharaa III
0.83
0.97
0.69
0.58
0.88
0.90
1.02
1.34
2.18
2.45
specific runoff
[l s-1 km-2]
Identification of “water towers”
Specific discharges are highest in the
headwaters of the Kharaa, in the Khentii
mountains (Menzel et al., 2011)
25
30
35
40
45
50
55
60
1961-19901971-20002001-20302011-20402021-20502031-20602041-20702051-20802061-20902071-2100
WaterAvailability[mm]
B1 CNCM3
B1 ECHAM5
B1 IPSL
WFD_Monthly
A2
CNCM3
A2
ECHAM5
A2
IPSL
Water availability change](https://image.slidesharecdn.com/momohofmann20150306berlin1-150419184033-conversion-gate01/85/Aktive-Mitwirkung-in-dem-Projekt-Integriertes-Wasserressourcenmanagement-in-Zentralasien-Dr-Jurgen-Hoffman-7-320.jpg)

![Leibniz-Institute of Freshwater
Ecology
and Inland Fisheries
TNTN loadsloads [t yr[t yr--11] in Kharaa] in Kharaa riverriver](https://image.slidesharecdn.com/momohofmann20150306berlin1-150419184033-conversion-gate01/85/Aktive-Mitwirkung-in-dem-Projekt-Integriertes-Wasserressourcenmanagement-in-Zentralasien-Dr-Jurgen-Hoffman-14-320.jpg)


![Leibniz-Institute of Freshwater
Ecology
and Inland Fisheries
Sown area, total grain yields and area weighted yields [dt ha-1] of
national wheat production in Mongolia from 1990 to 2012
0
100
200
300
400
500
600
700
800
1990
1991
1992
1993
1994
1995
1996
1997
1998
1999
2000
20012002
2003
2004
2005
2006
2007
2008
2009
2010
2011
2012
Sownarea(1000ha)/TotalYield[kt]
0
2
4
6
8
10
12
14
16
18
WeightedYield[dtha]
Total Yield [Kilotonnes] Sown Area (1000 ha ) Yield [dt ha]](https://image.slidesharecdn.com/momohofmann20150306berlin1-150419184033-conversion-gate01/85/Aktive-Mitwirkung-in-dem-Projekt-Integriertes-Wasserressourcenmanagement-in-Zentralasien-Dr-Jurgen-Hoffman-23-320.jpg)
![Leibniz-Institute of Freshwater
Ecology
and Inland Fisheries
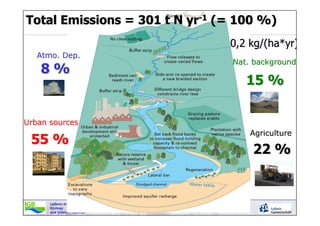
Total demanded Nutrients 2013
(N, P, K) [t]
TOTAL 11700 t yrTOTAL 11700 t yr--11
DemandedDemanded nutrientsnutrients
forfor SEEDS 3260 t yrSEEDS 3260 t yr--11
FallowFallow 8440 t yr8440 t yr--11
RERE--USE 476 t yrUSE 476 t yr--11](https://image.slidesharecdn.com/momohofmann20150306berlin1-150419184033-conversion-gate01/85/Aktive-Mitwirkung-in-dem-Projekt-Integriertes-Wasserressourcenmanagement-in-Zentralasien-Dr-Jurgen-Hoffman-24-320.jpg)


![Water consumption
[ Water L/kg Meat ]
200 –
1000 L
3900 L
4800 L
15500 L
KLA vs ASTAFASTAF--PRO:PRO: + 1,6 kg
Tomaten](https://image.slidesharecdn.com/momohofmann20150306berlin1-150419184033-conversion-gate01/85/Aktive-Mitwirkung-in-dem-Projekt-Integriertes-Wasserressourcenmanagement-in-Zentralasien-Dr-Jurgen-Hoffman-32-320.jpg)
![Emissions of greenhouse gas
[ Emission of CO2 in kg/kg Meat ]
(Dänisches Ministerium für Ernährung,
Landwirtschaft und Fischerei)
1,8
3,1
3,6
19,4
Carbon Footprint: CO2-
Äquivalente von der Produktion
bis hin zum Supermarkt!
KLA vs ASTAFASTAF--PRO:PRO: ~ 0,2
+ 1,6 kg
Tomaten](https://image.slidesharecdn.com/momohofmann20150306berlin1-150419184033-conversion-gate01/85/Aktive-Mitwirkung-in-dem-Projekt-Integriertes-Wasserressourcenmanagement-in-Zentralasien-Dr-Jurgen-Hoffman-33-320.jpg)