Downloaded 20 times


![Symbolic Variables
• Symbolic variables are a type, like double or char
• To
»
»
»
make symbolic variables, use sym
a=sym('1/3');
b=sym('4/5');
mat=sym([1 2;3 4]);
fractions remain as fractions
» c=sym('c','positive');
can add tags to narrow down scope
see help sym for a list of tags
• Or use syms
» syms x y real
shorthand for x=sym('x','real'); y=sym('y','real');](https://image.slidesharecdn.com/mit6094iap10lec05-140114131733-phpapp02/85/Mit6-094-iap10_lec05-4-320.jpg)


![More Symbolic Operations
• We can do symbolics with matrices too
» mat=sym('[a b;c d]');
» mat2=mat*[1 3;4 -2];
compute the product
» d=det(mat)
compute the determinant
» i=inv(mat)
find the inverse
• You can access symbolic matrix elements as before
» i(1,2)](https://image.slidesharecdn.com/mit6094iap10lec05-140114131733-phpapp02/85/Mit6-094-iap10_lec05-7-320.jpg)


![Writing Excel Files
• MATLAB contains specific functions for reading and writing
Microsoft Excel files
• To write a matrix to an Excel file, use xlswrite
» [s,m]=xlswrite('randomNumbers',rand(10,4),...
'Sheet1'); % we specify the sheet name
• You can also write a cell array if you have mixed data:
» C={'hello','goodbye';10,-2;-3,4};
» [s,m]=xlswrite('randomNumbers',C,'mixedData');
• s and m contain the 'success' and 'message' output of the
write command
• See doc xlswrite for more usage options](https://image.slidesharecdn.com/mit6094iap10lec05-140114131733-phpapp02/85/Mit6-094-iap10_lec05-25-320.jpg)
![Reading Excel Files
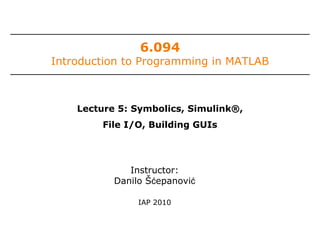
• Reading excel files is equally easy
• To read from an Excel file, use xlsread
» [num,txt,raw]=xlsread('randomNumbers.xls');
Reads the first sheet
num contains numbers, txt contains strings, raw is the
entire cell array containing everything
» [num,txt,raw]=xlsread('randomNumbers.xls',...
'mixedData');
Reads the mixedData sheet
» [num,txt,raw]=xlsread('randomNumbers.xls',-1);
Opens the file in an Excel window and lets you click on the
data you want!
• See doc xlsread for even more fancy options](https://image.slidesharecdn.com/mit6094iap10lec05-140114131733-phpapp02/85/Mit6-094-iap10_lec05-26-320.jpg)


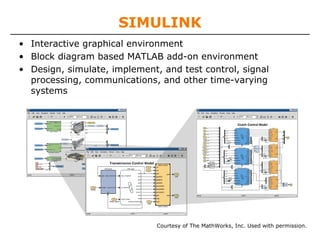
This document provides an outline and overview of key topics covered in Lecture 5 of the MIT course 6.094 Introduction to Programming in MATLAB, including: (1) Symbolic math toolbox for symbolic rather than numeric calculations, including symbolic variables, expressions, and operations. (2) Simulink for designing and simulating dynamic systems using a graphical block diagram interface and library of blocks. (3) File input/output for importing and exporting data to and from text and Excel files. (4) Graphical user interface development using the GUIDE tool to visually design and program GUIs for MATLAB applications.