


![III.B.2 Employee Controls, Values, and Ethics
While appraisal methods differ across lines of business, the firm monitors employee performance
through annual 360 Performance Reviews. BofA also trains personnel annually on its Code of
Ethics. Included in the document are its core values to: “deliver for our customers, clients and
shareholders, trust in our team, embrace the power of our people, act responsibly, and promote
opportunity”.64 As stated in the BofA 2010 Annual Report, “… [W]e has developed employee
incentive, reward and recognition programs that align with our customer experience goals.”65
Though BofA has received criticism in the media since the financial crisis, overall it can be
assumed, because of the current awards and accolades that it has received, that the company is
well aligned with the core values that it puts forth. Honors such as, World’s Most Admired
Companies, Top 50 Companies for Diversity, and Top 200 of the Global 2000, demonstrates that
BofA supports its people and fosters a safe, ethical environment in which to work.66
III.C. BofA – Strategic Position Definition
III.C.1 BofA - Corporate Level Strategy
Business Portfolio
BofA‟s business portfolio under CB includes Deposits, Global Card Services, Home Loans and
Insurance, and Global Commercial Banking. The CB scope of product offerings includes a
portfolio targeted to mass-market consumers and small-to-mid size businesses:
1. The Deposits group offers products and services that represent traditional retail banking
offerings; these include checking, savings, money market accounts, and CDs and IRAs.
2. Global Card Services is a leading credit card issuer in the US and provides consumer
and business cards, consumer lending, and international credit/debit cards.
3. Home Loans and Insurance provides consumer real-estate products, including first-lien
home mortgages, home equity loans and lines of credit, and insurance-related products
Global Commercial Banking offers customer lending-related products, working capital
management, commercial loans, and asset-based lending.
BofA IB provides a portfolio geared towards large corporations, institutions, and high-net-worth
individuals:
35](https://image.slidesharecdn.com/missionpeaksuperstarsbofa-130310235519-phpapp01/85/Bank-of-America-s-Project-New-BAC-For-Good-or-for-Bad-35-320.jpg)
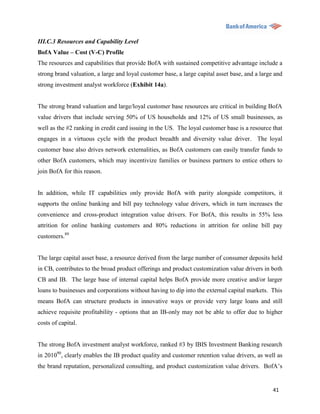

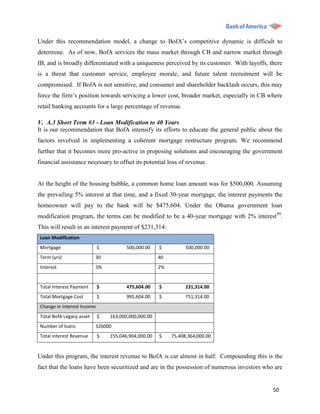
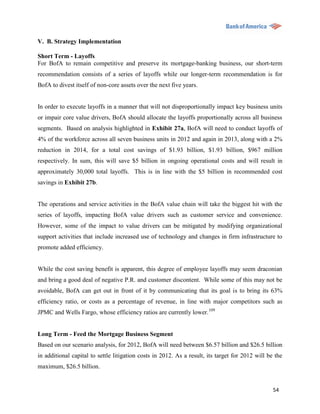

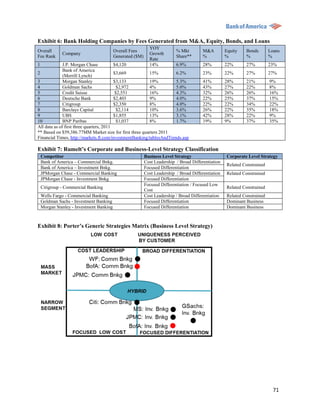
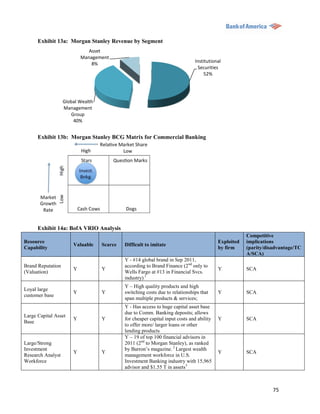
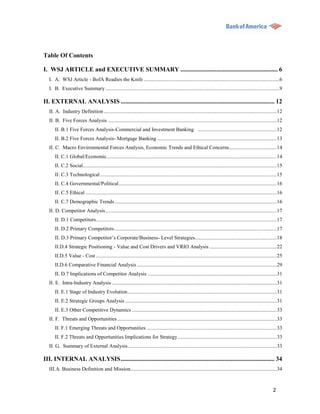
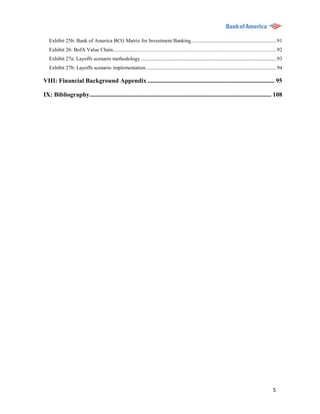
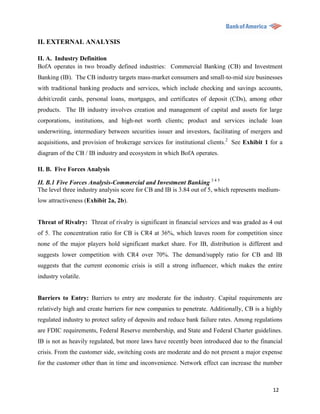
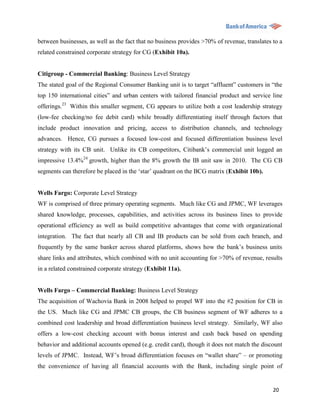
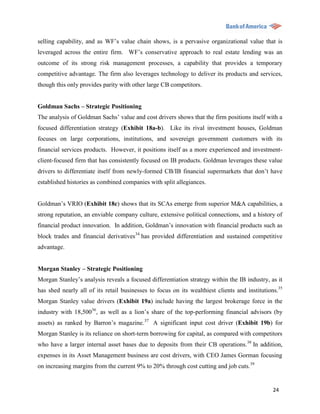
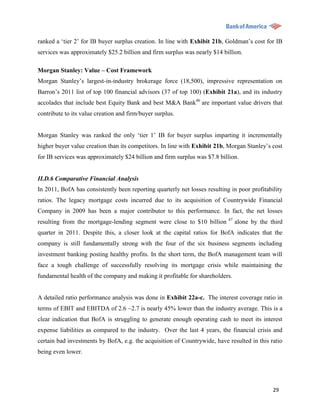
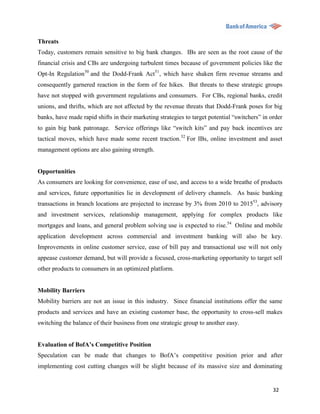
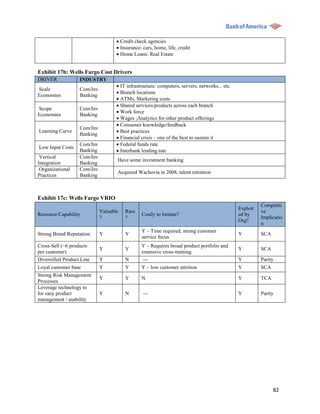
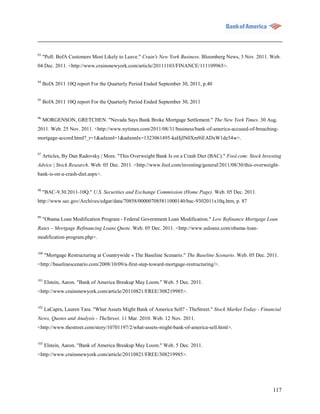
![Integrated/Diverse
Y N ---- Y PARITY
product offerings
Y - Spends significant % of revenue
maintaining, upgrading, and expanding
IT Y N technology offerings. Major competitors Y PARITY
can match this, but smaller competitors
cannot afford similar investments.
Y - The company provides unmatched
convenience in the United States, serving
approximately 58
million consumer and small business
Convenience Y N Y PARITY
relationships with more than 5,900 retail
banking offices, more than 18,000 ATMs
and award-winning online banking with
nearly 30 million active users
N – Acquisition of Countrywide
Risk Management N N Financial and Merrill Lynch brokerage N Disadvantage
both led to significant expense
Y – But in BofA‟s case, U.S. government
Government forced it to acquire Merrill Lynch when
Relationship / Y Y CEO wanted to pull out of deal; N Disadvantage
Political Savvy government also suing over Countrywide
mortgage practices
N - They have continuously being ranked
Customer service Y N the worst. However the competitors do N Disadvantage
not do better either.
1
http://issuu.com/brandfinance/docs/september_update?viewMode=magazine&mode=embed
2
http://online.barrons.com/report/top-financial-advisors/100
3
http://www.investmentnews.com/apps/pbcs.dll/article?AID=/20110523/FREE/110529986
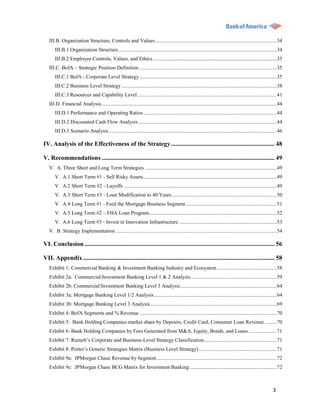
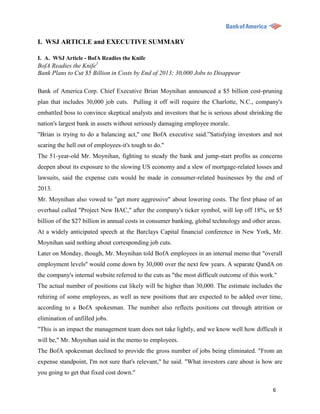
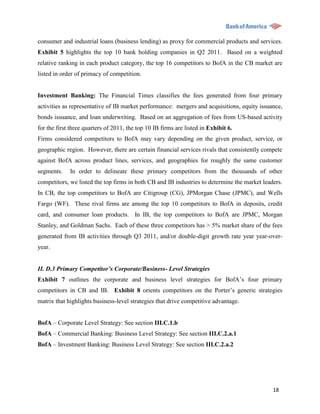
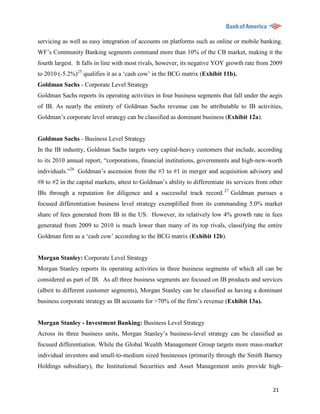
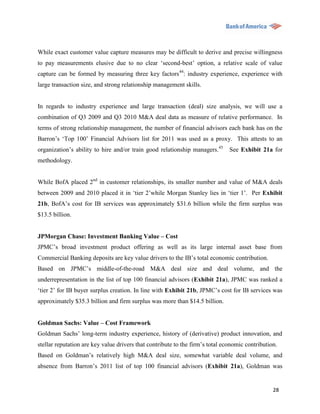
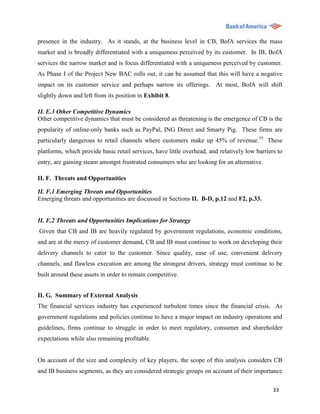
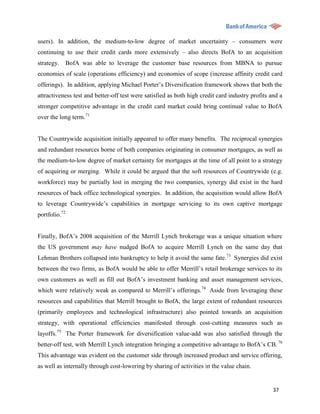
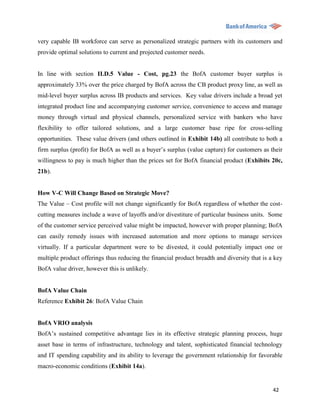
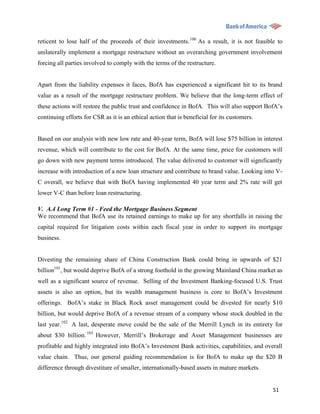
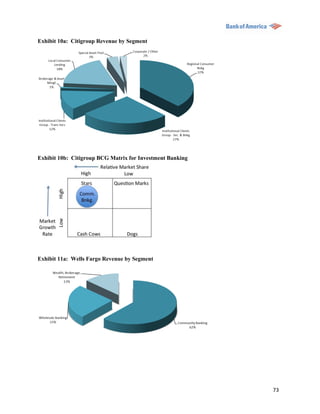
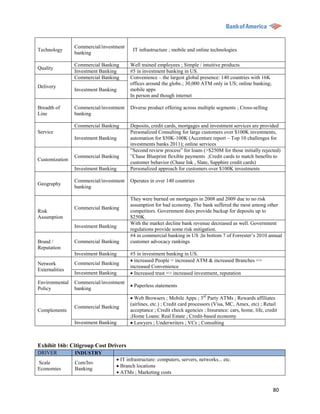
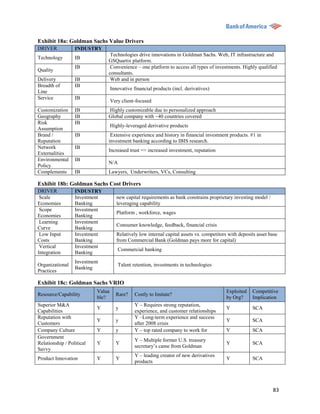
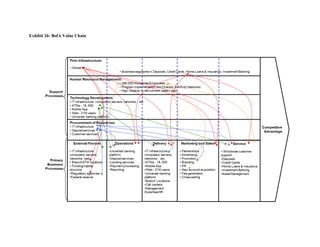
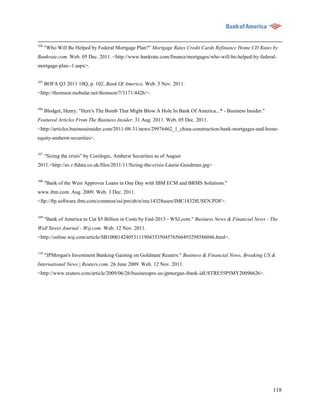
Exhibit 14b: Bank of America Value Drivers
DRIVER INDUSTRY
Technology CB IT infrastructure; Deposit-image ATMs;Mobile App;Web (21M users); SMS
banking; Unified, usable interface for customers across platforms
IB Integrated platform for wealth, commercial, corporate, investment products
Quality CB 24/7 customer service; Product usability (e.g. Clarity Commitment statements
describing products in „plain English‟);One stop shop;
Terms and conditions, Low interest rates; High customer retention
IB Convenience (easy access to capital/capital markets) ; Product usability (e.g.
Merrill Edge allowing banking + investing activity on same platform) High
customer retention
Delivery CB Convenience - large physical branch (700) and ATM (18,000) footprint, much
of the U.S. (32 states) ; Web and mobile device accessibility for many of the
most popular core products ; Integrated product delivery
IB ; Convenience ; Integrated product delivery/platform (wealth mgmt. +
commercial / corporate / investment banking services)
Breadth of CB ; Comprehensive & diverse commercial product offerings across consumer,
Line business, and institutional clients (one-stop shop)
; “We run the franchise in full, delivering all of the services [customers] may
have traditionally sought separately from a retail bank, commercial bank, an
investment bank, a wealth management firm, a brokerage or a private bank.”
(BOA Annual Report, 21010)
IB Large investment banking product line breadth; Specialized research of
investment opportunities
76](https://image.slidesharecdn.com/missionpeaksuperstarsbofa-130310235519-phpapp01/85/Bank-of-America-s-Project-New-BAC-For-Good-or-for-Bad-76-320.jpg)


The document discusses Bank of America's (BofA) strategic challenges, detailing a plan called 'Project New BAC' aimed at cutting costs by $5 billion through significant layoffs and asset divestitures to stabilize profitability amidst economic pressures and litigation risks. It provides an in-depth analysis of the banking industry's competitive landscape, highlighting BofA's primary competitors and assessing the low attractiveness of various banking segments due to several market dynamics. The document emphasizes the need for BofA to restructure and adapt its operations to remain viable and regain investor confidence.