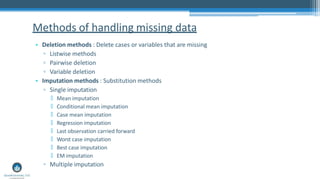
Missing data
• Dealing with missing data, has been always a challenge in data analysis context.
• We need methods in missing data analysis that:
▫ Minimize the bias
▫ Maximize use of available information, and
▫ Get good estimates of uncertainty e.g., p-value, confidence interval, etc.
Rec No Variable n
1 Unit non-response Unobserved/Latent
variable
2
3 Missing data
4 Item-non-
response
Assumptions (MCAR, MAR, NMAR)
• When values are missing completely at random (MCAR), the probability of
missingness is unrelated to the values of any variable
• Data are missing at random (MAR) if missingness is unrelated to the value that
is missing, but is related to the values of other variables
• E.g., a question about typical number of hours spent browsing the internet
might be missing more often for married than unmarried participants; BUT
among the married subset, missingness is completely random—Not related
to how many hours the person browses
• Data are missing not at random (MNAR) if missingness is related to the value
that is missing, and often to the values of other variables as well
• E.g. missing values are more prevalent among those who typically browse
more than among those who browse less
• Deletion methods : Delete cases or variables that are missing
▫ Listwise methods
▫ Pairwise deletion
▫ Variable deletion
• Imputation methods : Substitution methods
▫ Single imputation
🞄 Mean imputation
🞄 Conditional mean imputation
🞄 Case mean imputation
🞄 Regression imputation
🞄 Last observation carried forward
🞄 Worst case imputation
🞄 Best case imputation
🞄 EM imputation
▫ Multiple imputation
Methods of handling missing data
List wise deletion
• A good method when the proportion of
missing data is less than 15%.
• Advantages:
▫ It can be used for any type of statistical
analysis.
▫ No special computations are required.
▫ The parameters estimations are
unbiased.
▫ The standard errors are appropriate
compare to original data.
• Disadvantages:
▫ May remove a considerable fraction of
data
Pair wise deletion
• Pairwise deletion involves dropping cases
with missing values on an analysis-by-
analysis basis
• Advantages:
▫ Using all available non-missing data
• Disadvantages:
▫ Estimated standard errors and test
statistics are biased
Variable deletion
• Variable deletion involves dropping
variables with missing values on an case -
by-case basis
• Advantages:
▫ Makes sense when lot of missing values in
a variable and if the variable is of relatively
less importance
• Disadvantages:
▫ Loss of information regarding the variable
Mean imputation
• Replace missing values with the mean of
that variable Case Var1 Var2 Var3
1 9 8 8
2 7.44 7 6
3 8 5 6
4 7 4 5
5 9 5 7
6 8 8 9
7 6 7 6
8 5 9 7
9 7 8 ?
10 8 8 7
Conditional Mean imputation
• Replace missing values with value of the
variable mean for a relevant subgroup
Case Var1 Sex Var2 Var3
1 9 F 8 8
2 8.25 F 7 6
3 8 F 5 6
4 7 F 4 5
5 9 F 5 7
6 8 M 8 9
7 6 M 7 6
8 5 M 9 7
9 7 M 8 ?
10 8 M 8 7
Case Mean imputation
• Replace missing values using information
from other variables for the same case to
impute the missing value
Case Var1 Var2 Var3
1 9 8 8
2 6.50 7 6
3 8 5 6
4 7 4 5
5 9 5 7
6 8 8 9
7 6 7 6
8 5 9 7
9 7 8 ?
10 8 8 7
• Imputes the missing value as a
value on the same outcome the
most recent time it was observed
• Variants :
• Average of T1 and T2
Last observation carried forward
Case T1 T2 T3
1 9 8 8
2 ? 7 6
3 8 5 6
4 7 4 5
5 9 5 7
6 8 8 9
7 6 7 6
8 5 9 7
9 7 8 8
10 8 8 7
• Use interpolation to fill in missing
values
• Useful for longitudinal datasets
Interpolation
• Worst case replaces a missing value with the worst case scenario for a
categorical outcome
• Best case replaces a missing value with the best case scenario for a
categorical outcome
Worst case and Best case imputation
• Substitute best missing values using
a ML imputation
• In the E-step, expected values are
calculated based on all complete
data points
• In the M-step, the procedure
imputes the expected values from
the E-step and then maximizes the
likelihood function to obtain new
parameter estimates
Expectation-Maximization
• Multiple imputation is quickly
becoming the “gold standard”
approach to handling missing
values
• Computationally complex
Multiple imputation

missingdatahandling-160923201313.pptx

  • 1.
    Missing data • Dealingwith missing data, has been always a challenge in data analysis context. • We need methods in missing data analysis that: ▫ Minimize the bias ▫ Maximize use of available information, and ▫ Get good estimates of uncertainty e.g., p-value, confidence interval, etc. Rec No Variable n 1 Unit non-response Unobserved/Latent variable 2 3 Missing data 4 Item-non- response
  • 2.
    Assumptions (MCAR, MAR,NMAR) • When values are missing completely at random (MCAR), the probability of missingness is unrelated to the values of any variable • Data are missing at random (MAR) if missingness is unrelated to the value that is missing, but is related to the values of other variables • E.g., a question about typical number of hours spent browsing the internet might be missing more often for married than unmarried participants; BUT among the married subset, missingness is completely random—Not related to how many hours the person browses • Data are missing not at random (MNAR) if missingness is related to the value that is missing, and often to the values of other variables as well • E.g. missing values are more prevalent among those who typically browse more than among those who browse less
  • 4.
    • Deletion methods: Delete cases or variables that are missing ▫ Listwise methods ▫ Pairwise deletion ▫ Variable deletion • Imputation methods : Substitution methods ▫ Single imputation 🞄 Mean imputation 🞄 Conditional mean imputation 🞄 Case mean imputation 🞄 Regression imputation 🞄 Last observation carried forward 🞄 Worst case imputation 🞄 Best case imputation 🞄 EM imputation ▫ Multiple imputation Methods of handling missing data
  • 5.
    List wise deletion •A good method when the proportion of missing data is less than 15%. • Advantages: ▫ It can be used for any type of statistical analysis. ▫ No special computations are required. ▫ The parameters estimations are unbiased. ▫ The standard errors are appropriate compare to original data. • Disadvantages: ▫ May remove a considerable fraction of data
  • 6.
    Pair wise deletion •Pairwise deletion involves dropping cases with missing values on an analysis-by- analysis basis • Advantages: ▫ Using all available non-missing data • Disadvantages: ▫ Estimated standard errors and test statistics are biased
  • 7.
    Variable deletion • Variabledeletion involves dropping variables with missing values on an case - by-case basis • Advantages: ▫ Makes sense when lot of missing values in a variable and if the variable is of relatively less importance • Disadvantages: ▫ Loss of information regarding the variable
  • 8.
    Mean imputation • Replacemissing values with the mean of that variable Case Var1 Var2 Var3 1 9 8 8 2 7.44 7 6 3 8 5 6 4 7 4 5 5 9 5 7 6 8 8 9 7 6 7 6 8 5 9 7 9 7 8 ? 10 8 8 7
  • 9.
    Conditional Mean imputation •Replace missing values with value of the variable mean for a relevant subgroup Case Var1 Sex Var2 Var3 1 9 F 8 8 2 8.25 F 7 6 3 8 F 5 6 4 7 F 4 5 5 9 F 5 7 6 8 M 8 9 7 6 M 7 6 8 5 M 9 7 9 7 M 8 ? 10 8 M 8 7
  • 10.
    Case Mean imputation •Replace missing values using information from other variables for the same case to impute the missing value Case Var1 Var2 Var3 1 9 8 8 2 6.50 7 6 3 8 5 6 4 7 4 5 5 9 5 7 6 8 8 9 7 6 7 6 8 5 9 7 9 7 8 ? 10 8 8 7
  • 11.
    • Imputes themissing value as a value on the same outcome the most recent time it was observed • Variants : • Average of T1 and T2 Last observation carried forward Case T1 T2 T3 1 9 8 8 2 ? 7 6 3 8 5 6 4 7 4 5 5 9 5 7 6 8 8 9 7 6 7 6 8 5 9 7 9 7 8 8 10 8 8 7
  • 12.
    • Use interpolationto fill in missing values • Useful for longitudinal datasets Interpolation
  • 13.
    • Worst casereplaces a missing value with the worst case scenario for a categorical outcome • Best case replaces a missing value with the best case scenario for a categorical outcome Worst case and Best case imputation
  • 14.
    • Substitute bestmissing values using a ML imputation • In the E-step, expected values are calculated based on all complete data points • In the M-step, the procedure imputes the expected values from the E-step and then maximizes the likelihood function to obtain new parameter estimates Expectation-Maximization
  • 15.
    • Multiple imputationis quickly becoming the “gold standard” approach to handling missing values • Computationally complex Multiple imputation