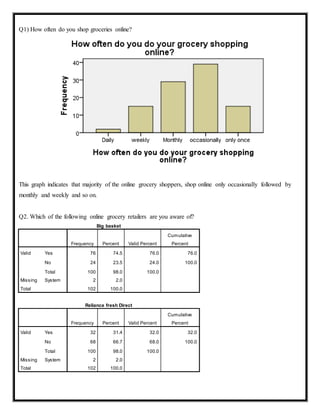
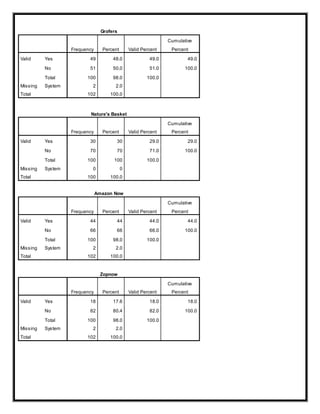
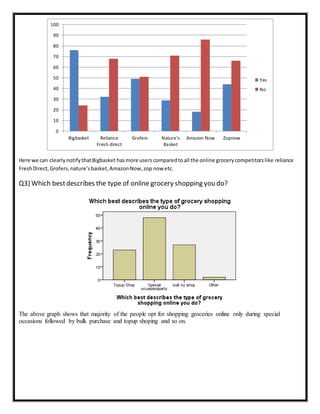
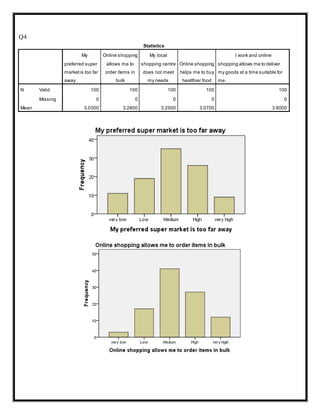
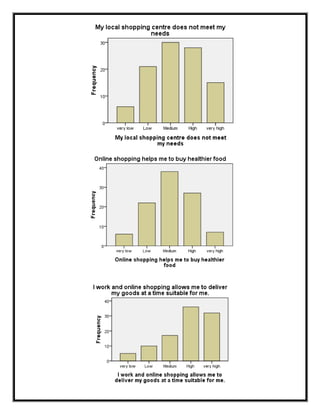
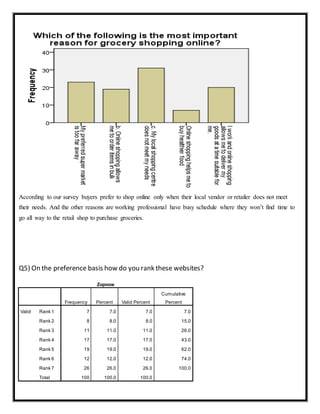
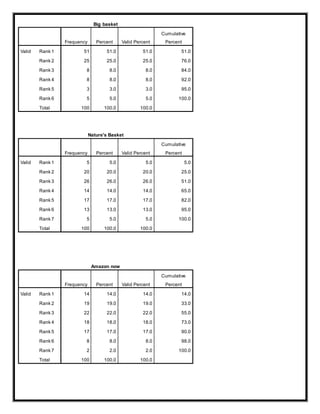
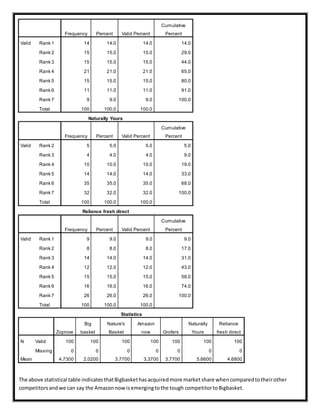
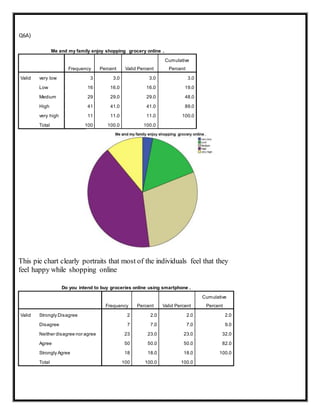
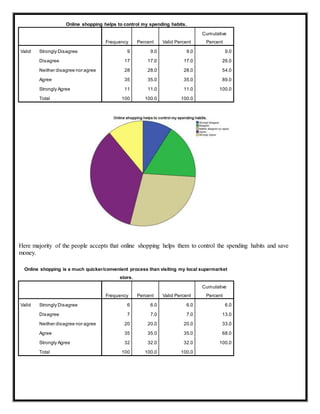
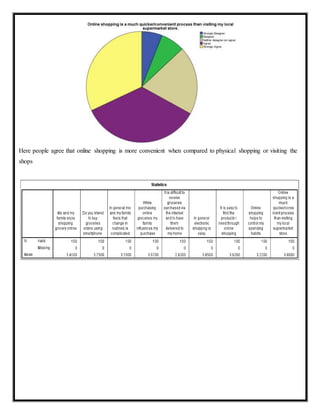
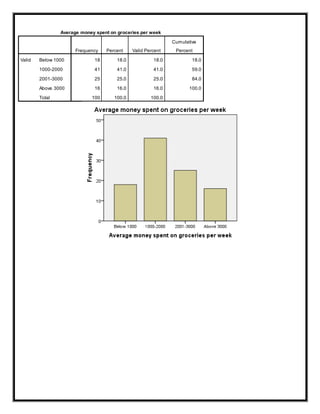
Best VIP Call Girls Noida Sector 50 Call Me: 8448380779
Online Grocery Shopping Attitudes
1. BMS College of Engineering
Marketing Research
Project Report on
ONLINE GROCERY SHOPPING
Submitted To: Submitted By:
Dr.Manoharan GROUP 6
Associate Professor Kumari Tejaswita (1BM15MBA38)
Banupriya(1BM15MBA13)
Rakshit P Neelappagol(1BF15MBA11
Pruthvi Kashi(1BF15MBA06)
2. Abstract
Purpose: The aim of this research is to investigate if positive attitudes influence the intentions to purchase
groceries online.
Background: The e-commerce market in India is regarded as one of the developing e-commerce markets in
Asia, however the grocery market is still striving for an online breakthrough. One of the largest obstacles for the
online grocery market is the lack of consumer adoption.
The e-commerce adoption is constantly growing, even to this present day. In many nations today a majority
close to 90% of the national firms have a website and even if all of them does not offer e-commerce solutions
this shows the importance of a firm being available online. The rapid growth of e-commerce can be derived
from the new consumer need for convenience and comfort in their purchasing process.
Even if a significant portion of the population today chooses to purchase their products online, there are still
specific markets that struggle to get the consumer to adapt and shift behaviour. Within e-commerce in India,
one of the markets that still experience this struggle is the online grocery market. There are two possible aspects
of what is causing this.
First, there could be a lack of willingness from the grocers, since the business model is not yet profitable
enough to implement .The technical aspects within the business model that challenge the grocer is how to
manage the stock of goods, present the groceries, how and at what times to deliver the goods and how to
manage returns of goods. Secondly, it could be a problem within consumer attitudes, which directly influences
consumer intentions and behaviour. There is however still believed that the market has great potential for
growth, due to the traditional grocery market’s size.
This research will focus on the consumers’ perspective since it is believed that they are the key to a more rapid
and sustainable development in the online grocery market. Altering how consumers purchase groceries involves
a change in behaviour, which is derived from a change in attitudes. This emphasizes how attitude theory and
models can aid when explaining consumer adoption towards e-commerce. Furthermore highlights the
importance of understanding how consumer attitudes influence the adoption of IT, especially e-commerce.
Purpose
The purpose of this research is to investigate the consumers’ attitude-intention relationship regarding online
grocery shopping in India. This research focuses on positive attitudes whether there is an influence on the
consumer intentions to purchase groceries online. It is the change in purchasing pattern from going to a physical
store to an online store. Therefore, it focuses on the shoppers’ intentions and adoption of whether or not to use
online grocery shopping. It is believed that this research is needed and has high relevance since the online
grocery market only represents 1% of the total grocery market in India and this implies a low consumer
adoption. This research will contribute with knowledge of positive attitudes and if they influence the intention
to purchase groceries online, furthermore this will lead to a better understanding within the area of research.
3. Definitions
E-commerce
The term e-commerce refers to the action of electronically mediated financial transactions between two parties.
This commercial interchange can be between organizations, individuals or a mixture of both. In this report it
refers to the action between organizations and individuals, so called business-to-consumers (B2C).
Attitude
According to Smith and Stevens (2008) an attitude is someone’s tendency to evaluate an object either for the
positive or the negative. A positive attitude is a learned tendency to evaluate an object as being favorable.
Online Grocery Shopping
Within this research online grocery shopping is referred to the act of purchasing single items of groceries just as
one would in a physical store, however this is done online.
Online Consumer Behavior
Online consumer behaviour differs slightly from traditional, offline consumer behaviour. According to Ba and
Pavlou (2002) trust is one of the major concerns for consumers when purchasing items online. The trust issue in
a buyer-selling relationship is based on information asymmetry, which is explained as a relationship where one
party, usually the seller, possess more information than the buyer about the product or service quality (Ba &
Pavlou, 2002). It can also be seen that technology acceptance and adoption is an important aspect regarding
consumer e-commerce behaviour (Pavlou, 2003). There are several aspects and motives to consumers’ adoption
of e-commerce; according to Tauber (1972) these motives are primarily personal (self-gratification, physical
activity and sensory stimulation) and social (communication with others, peer group attraction and
status/authority). Personal and social needs are both related to the hedonic aspect of purchasing items, the
shopping enjoyment. The market research conducted by Svensk Digital Mathandel (2014) presents an increased
use of online grocery shopping and that the consumers tend to continue to purchase their groceries online after
trying it.
Questionnaire Design
The design of this questionnaire is based on the scale method called the Likert Scale Approach, which is a well-
known approach for measuring attitudes (Brill, 2008). The main focus for this research is to find whether
positive attitudes have an influence on consumer intention within online grocery shopping. There are several
scale approaches which one can use to measure attitudes. The Likert Scale Approach implements a statement
approach, which will be implemented in this research. This means that a statement will be expressed in the
survey and the respondent will be asked to answer to what extent they agree to the statement (Brill, 2008).
Data Analysis
Due to the quantitative Likert Scale Approach used when collecting the data, the data is ranked, which can also
be called ordinal data. This type of data is along with the quantitative data is required to be processed and
compiled before it is interpreted and analyzed. This is done so that the data is accessible and useful for its
purpose (Saunders et al., 2012). The data processing and analyzing program used for this research was IBM
SPSS Statistics, which is a well-known program used to compile, process and analyze data collected for
research (IBM SPSS Statistics, 2015).
4. Q1) How often do you shop groceries online?
This graph indicates that majority of the online grocery shoppers, shop online only occasionally followed by
monthly and weekly and so on.
Q2. Which of the following online grocery retailers are you aware of?
Big basket
Frequency Percent Valid Percent
Cumulative
Percent
Valid Yes 76 74.5 76.0 76.0
No 24 23.5 24.0 100.0
Total 100 98.0 100.0
Missing System 2 2.0
Total 102 100.0
Reliance fresh Direct
Frequency Percent Valid Percent
Cumulative
Percent
Valid Yes 32 31.4 32.0 32.0
No 68 66.7 68.0 100.0
Total 100 98.0 100.0
Missing System 2 2.0
Total 102 100.0
5. Grofers
Frequency Percent Valid Percent
Cumulative
Percent
Valid Yes 49 48.0 49.0 49.0
No 51 50.0 51.0 100.0
Total 100 98.0 100.0
Missing System 2 2.0
Total 102 100.0
Nature's Basket
Frequency Percent Valid Percent
Cumulative
Percent
Valid Yes 30 30 29.0 29.0
No 70 70 71.0 100.0
Total 100 100 100.0
Missing System 0 0
Total 100 100.0
Amazon Now
Frequency Percent Valid Percent
Cumulative
Percent
Valid Yes 44 44 44.0 44.0
No 66 66 66.0 100.0
Total 100 98.0 100.0
Missing System 2 2.0
Total 102 100.0
Zopnow
Frequency Percent Valid Percent
Cumulative
Percent
Valid Yes 18 17.6 18.0 18.0
No 82 80.4 82.0 100.0
Total 100 98.0 100.0
Missing System 2 2.0
Total 102 100.0
6. Here we can clearlynotifythatBigbasket hasmore userscomparedtoall the online grocerycompetitorslike reliance
FreshDirect, Grofers,nature’sbasket,AmazonNow,zop now etc.
Q3) Which bestdescribes the type of online grocery shopping you do?
The above graph shows that majority of the people opt for shopping groceries online only during special
occasions followed by bulk purchase and topup shoping and so on.
0
10
20
30
40
50
60
70
80
90
100
Bigbasket Reliance
Fresh direct
Grofers Nature's
Basket
Amazon Now Zopnow
Yes
No
7. Q4
Statistics
My
preferred super
marketis too far
away
Online shopping
allows me to
order items in
bulk
My local
shopping centre
does not meet
my needs
Online shopping
helps me to buy
healthier food
I work and online
shopping allows me to deliver
my goods at a time suitable for
me.
N Valid 100 100 100 100 100
Missing 0 0 0 0 0
Mean 3.0300 3.2800 3.2500 3.0700 3.8000
8.
9. According to our survey buyers prefer to shop online only when their local vendor or retailer does not meet
their needs. And the other reasons are working professional have busy schedule where they won’t find time to
go all way to the retail shop to purchase groceries.
Q5) On the preference basis how do you rank these websites?
Zopnow
Frequency Percent Valid Percent
Cumulative
Percent
Valid Rank 1 7 7.0 7.0 7.0
Rank 2 8 8.0 8.0 15.0
Rank 3 11 11.0 11.0 26.0
Rank 4 17 17.0 17.0 43.0
Rank 5 19 19.0 19.0 62.0
Rank 6 12 12.0 12.0 74.0
Rank 7 26 26.0 26.0 100.0
Total 100 100.0 100.0
12. Q6A)
Me and my family enjoy shopping grocery online .
Frequency Percent Valid Percent
Cumulative
Percent
Valid very low 3 3.0 3.0 3.0
Low 16 16.0 16.0 19.0
Medium 29 29.0 29.0 48.0
High 41 41.0 41.0 89.0
very high 11 11.0 11.0 100.0
Total 100 100.0 100.0
This pie chart clearly portraits that most of the individuals feel that they
feel happy while shopping online
Do you intend to buy groceries online using smartphone .
Frequency Percent Valid Percent
Cumulative
Percent
Valid Strongly Disagree 2 2.0 2.0 2.0
Disagree 7 7.0 7.0 9.0
Neither disagree nor agree 23 23.0 23.0 32.0
Agree 50 50.0 50.0 82.0
Strongly Agree 18 18.0 18.0 100.0
Total 100 100.0 100.0
13. Here, clearly it’s seen that individuals feel that smart phone usage is more convenient way to
shop groceries online
In general me and my family feels that change in routines is complicated.
Frequency Percent Valid Percent
Cumulative
Percent
Valid Strongly Disagree 2 2.0 2.0 2.0
Disagree 19 19.0 19.0 21.0
Neither disagree nor agree 45 45.0 45.0 66.0
Agree 30 30.0 30.0 96.0
Strongly Agree 4 4.0 4.0 100.0
Total 100 100.0 100.0
14. It shows that Indian population has diversified groups where few feel online
grocery shopping helps them save their time, energy and money too, where some
are not still comfortable to opt purchasing their groceries online instead they prefer
their regular retail stores as they feel that is more safe for them.
While purchasing online groceries my family influences my purchase
Frequency Percent Valid Percent
Cumulative
Percent
Valid Strongly Disagree 3 3.0 3.0 3.0
Disagree 12 12.0 12.0 15.0
Neither disagree nor agree 22 22.0 22.0 37.0
Agree 51 51.0 51.0 88.0
Strongly Agree 12 12.0 12.0 100.0
Total 100 100.0 100.0
This pie chart clearly portraits that most of the individuals feelhappy to have family concern while shopping online.
15. It is difficult to receive groceries purchased via the internet and to have them delivered to my
home
Frequency Percent Valid Percent
Cumulative
Percent
Valid Strongly Disagree 6 6.0 6.0 6.0
Disagree 35 35.0 35.0 41.0
Neither disagree nor agree 27 27.0 27.0 68.0
Agree 25 25.0 25.0 93.0
Strongly Agree 7 7.0 7.0 100.0
Total 100 100.0 100.0
In this chart we can see that there is no much difference between the proportion of the people who agree and
disagree for timely delivery of groceries when they placed order online so people are still in dilemma and they
are not sure that how exactly they receive the preferred product.
In general electronic shopping is easy.
Frequency Percent Valid Percent
Cumulative
Percent
Valid Disagree 9 9.0 9.0 9.0
Neither disagree nor agree 20 20.0 20.0 29.0
Agree 48 48.0 48.0 77.0
Strongly Agree 23 23.0 23.0 100.0
Total 100 100.0 100.0
16. In general people are convenient in E-shopping but when it comes to the groceries
they become stereotype
It is easy to find the products I need through online shopping.
Frequency Percent Valid Percent
Cumulative
Percent
Valid Strongly Disagree 3 3.0 3.0 3.0
Disagree 3 3.0 3.0 6.0
Neither disagree nor agree 19 19.0 19.0 25.0
Agree 49 49.0 49.0 74.0
Strongly Agree 26 26.0 26.0 100.0
Total 100 100.0 100.0
As the pie chart states, the survey has revealed that people are able to find few grocery products in online,
which not available in their nearby retail stores. So most of them have agree to it and acceptance level is high in
this case.
17. Online shopping helps to control my spending habits.
Frequency Percent Valid Percent
Cumulative
Percent
Valid Strongly Disagree 9 9.0 9.0 9.0
Disagree 17 17.0 17.0 26.0
Neither disagree nor agree 28 28.0 28.0 54.0
Agree 35 35.0 35.0 89.0
Strongly Agree 11 11.0 11.0 100.0
Total 100 100.0 100.0
Here majority of the people accepts that online shopping helps them to control the spending habits and save
money.
Online shopping is a much quicker/convenient process than visiting my local supermarket
store.
Frequency Percent Valid Percent
Cumulative
Percent
Valid Strongly Disagree 6 6.0 6.0 6.0
Disagree 7 7.0 7.0 13.0
Neither disagree nor agree 20 20.0 20.0 33.0
Agree 35 35.0 35.0 68.0
Strongly Agree 32 32.0 32.0 100.0
Total 100 100.0 100.0
18. Here people agree that online shopping is more convenient when compared to physical shopping or visiting the
shops
19. Q8) Demography
Gender
Frequency Percent Valid Percent
Cumulative
Percent
Valid Male 45 45.0 45.0 45.0
Female 55 55.0 55.0 100.0
Total 100 100.0 100.0
Age
Frequency Percent Valid Percent
Cumulative
Percent
Valid 18-30 62 62.0 62.0 62.0
31-40 32 32.0 32.0 94.0
41-50 6 6.0 6.0 100.0
Total 100 100.0 100.0
20. Family Status
Frequency Percent Valid Percent
Cumulative
Percent
Valid single 55 55.0 55.0 55.0
Married 45 45.0 45.0 100.0
Total 100 100.0 100.0
Income Level
Frequency Percent Valid Percent
Cumulative
Percent
Valid Below 1lakh 15 15.0 15.0 15.0
1 lakh-5lakhs 33 33.0 33.0 48.0
5lakhs-10lakhs 38 38.0 38.0 86.0
Above 10 lakhs 14 14.0 14.0 100.0
Total 100 100.0 100.0
21. Average money spent on groceries per week
Frequency Percent Valid Percent
Cumulative
Percent
Valid Below 1000 18 18.0 18.0 18.0
1000-2000 41 41.0 41.0 59.0
2001-3000 25 25.0 25.0 84.0
Above 3000 16 16.0 16.0 100.0
Total 100 100.0 100.0
22. Conclusion:
In this Marketing research which we conducted with the topic of, positive attitude and
buying behavior of the online shoppers has revealed various facts,
As the survey was conducted in Bengaluru, Most of the Bangalorian optfor purchasing
groceries online occasionally, among all the grocery website the most familiar website is known
to be Bigbasket followed by Amazon Now who is tough competitor for them in the present
scenario.
Now there is a huge competition in E-tailing because people are more fond of purchasing the
goods online specially like electronic gadgets, apparels, stationeries and other physically used
products, When coming to groceries, where people are more insight with the hygienic factors
and hence they are much comfortable in purchasing with retailer as they can see and feel them,
and purchase them only after they are happy with it.
we can conclude that never the less there is high scopefor the development to happen in future
as most of them shop groceries online lie under the category of middle age, hence they won’t
find time to visit the retail stores and buy the groceries when it is more convenient and easy to
get them delivered at their doorsteps.