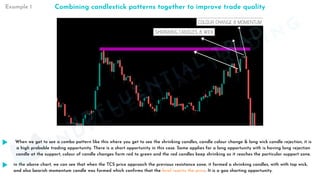
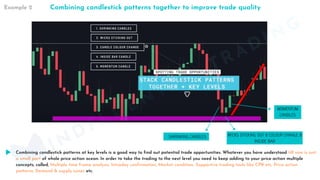
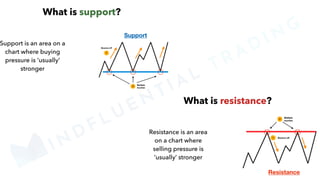
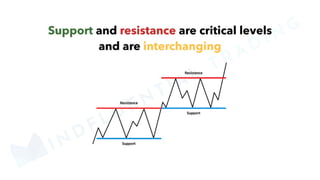
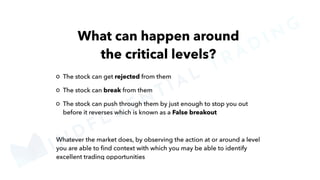
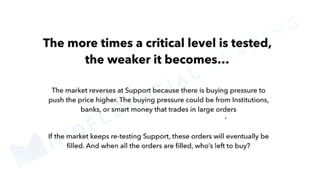
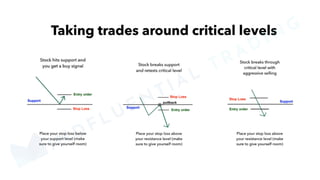
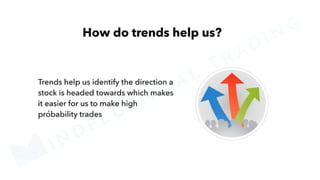
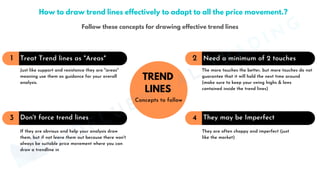
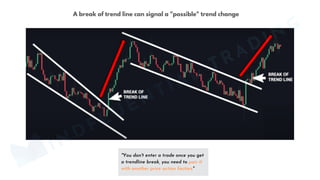
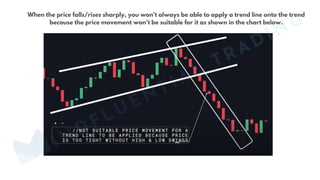
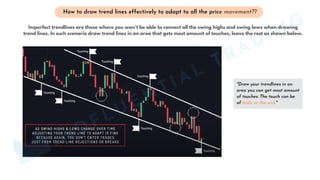
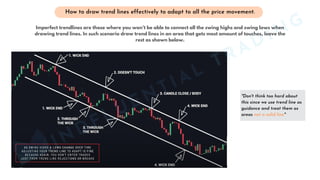
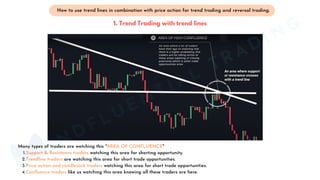
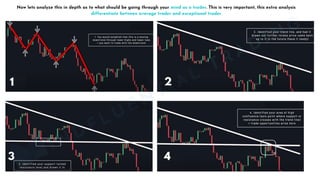
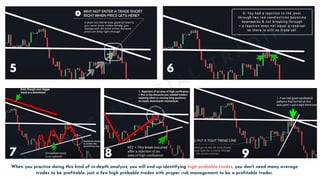
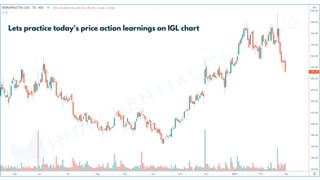
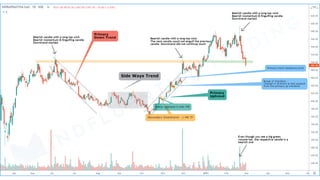
Mindfluential trading pdf for stock learning....
Session one ......candle formation
Trading rules
Core components of price action....support and resistance supply demand trendline
Call Girls Near Delhi Pride Hotel, New Delhi|9873777170
Mindfluential Trading (Session 1)....pdf
1. 5 AM Trading Club
W W W . M I N D F L U E N T I A L T R A D I N G . C O M
Day 1 Session
2. Contents
Day 1
14 Plotting important levels on the chart.
15 Understanding Trading View Tools & How to use the free trading view version in the
best way possible.
16 Central Pivot Range - CPR
17 EMA & SMA secrets
18 Entry / Exit Strategies
19 How to effectively place the stop loss & trail it.
8 GAPS
9 Effective Chart Patterns
10 Assignment Discussions
11 Master Breakouts & Breakdowns
12 How to identify Fakeouts & Trade Them
13 Playback Market Simulations
1 What is Price Action Trading
2 Anatomy of Candlesticks
3 Volume Analysis
4 All about Support & Resistances, Demand & Supply Zones
5 Trends & Trend Lines
6 Chart Phases
7 Putting it all together
Day 2
Day 3
MINDFLUENTIAL
TRADING
3. Contents
Contents
Day 4
30 How to use Institutional Zones to take up trades.
31 How to Maintain Effective Trading & Emotional Journal & very interactive way to review it. Explained using a
free web / mobile application called Notion.
32 Three Month Free Access to our Premium Discord Community / How it works
33 You will be getting our stock watchlist with around 200 stocks.
34 You will get 400+ pages of PDFs every day summarizing the concepts discussed in the sessions.
35 Recorded bonus session on F&O covering Basics, Option Chain Analysis, Premium Decay & more.
26 How to Select Stocks for trading.
27 Sector comparison with stocks & Index comparison.
28 Volume Profile Analysis
29 Divergence Concept
20 Risk Management - Risk Reward & Position Sizing.
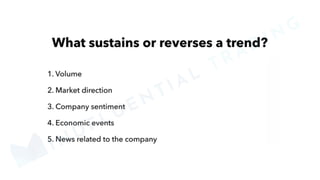
21 Trading Psychology.
22 In-depth Analysis & solutions on Trading with Emotions.
[ Fear / Greed / Regret / Hope / Frustration / Happiness ]
23 Bias Trading - An underrated concept.
24 Why most of the traders have a hard time becoming profitable & How to gain trading Edge in Trading.
25 Trade Like a Monk: Trading Affirmations & Trading Meditation
Day 5
Bonuses
MINDFLUENTIAL
TRADING
4. What is Price Action
Trading?
1
MINDFLUENTIAL
TRADING
14. Candlestick Analysis
Candlesticks are the soul of price action as these patterns that forms tell you a lot about what is going on in that specific time
period in terms of buying and selling in the market.
Understanding the Structure of the Candlesticks
Topic
MINDFLUENTIAL
TRADING
18. MINDFLUENTIAL
TRADING
On looking at a candlestick we need to identify 2 things. One is
which kind of candle it is and how much intensity it has.
19. Candlesticks tells a story and are reflection of what "buyers" and "sellers" are doing
Combining candlestick patterns with key levels
MINDFLUENTIAL
TRADING
Long top wick with respect to Price Action tells us that "buyers tried to push the price higher but failed, causing the wick to stick out"
Candlestick patterns form at key levels as a result of profit-taking, new positions being opened, or a combination of both.
Here the key level is the purple zone which has acted as a resistance (meaning sellers are present at that zone) previously and once the price tries
to reach that point again, we need a confirmation candle to short, a good confirmation is shown by forming a long red top wick candle as shown
in the image. It is an indication of a shorting opportunity. The same applies to a long opportunity at a support zone with a long bottom green wick
Candlestick Analysis
Pattern 1 - Long wick candlestick
Our Focus
20. Inside Candle with respect to Price Action tells us that "Price failed to make a higher high (in an uptrend) which shows momentum loss occurring"
Here the key level is the grey zone which has acted as a resistance and buyers have no power to fight with the sellers means still the sellers are
active and the inside candle confirms the bearish situation. It is an indication of a shorting opportunity. The same applies to a long opportunity at
a support zone with a long bottom wick
MINDFLUENTIAL
TRADING
High & Low of the Inside
candle is completely covered
by the Preceding candle high
and Low
Pattern 2 - Inside Bar Candle Wicks Sticking Out Inside Bar Candle
21. Momentum candle with respect to Price Actions tells us that "either new buyers or new sellers entered at the support / resistance zones which
provides a additional confirmation for the price reversal, or trend reversal"
Use the momentum candle after any rejection candle, such as after a long wick candle or after inside
In the above image, after the long wick candle rejections, a momentum candle gives the confirmation for shorting opportunity. Same applies for a
long opportunity at a support zone with long green body after rejection candle.
Pattern 3 - Momentum Candle & Engulfing Candles
MINDFLUENTIAL
TRADING
22. Multiple Candlestick rejections with respect to Price Action tells us that "price tried over and over again to push through the level but failed"
One should always look at the candlesticks from both buyer's and sellers' perspectives. Let's analyze the above-highlighted area in the chart from
both perspectives.
a) Sellers who shorted before noticed that it is a key level of support is good to close their position because of price failing to push lower due to
the multiple rejections.
b) Buyers noticed that this level is holding the price strong and thinks "this is a good level to long due to sellers failing to push price lower"
Double action triggers reversal, which means the combination of sellers closing their positions & buyers opening new positions causes a reversal to
occur.
MINDFLUENTIAL
TRADING
Pattern 4 - Multiple Rejections
23. Shrinking candles with respect to Price Action tells us that "the buyers number of buyers keep reducing as the price goes up and it indicates that
there could be a price reversal happening"
Shrinking candle followed by a long wick candle is a indication that price cannot passthrough the level and is having more chance of getting
reversed.
Pattern 5 - Shrinking Candles
MINDFLUENTIAL
TRADING
24. in the above chart, we can see that when the TCS price approach the previous resistance zone, it formed a shrinking candles, with with top wick,
and also bearish momentum candle was formed which confirms that the level rejects the price. It is a goo shorting opportunity.
Combining candlestick patterns together to improve trade quality
MINDFLUENTIAL
TRADING
Example 1
When we get to see a combo pattern like this where you get to see the shrinking candles, candle colour change & long wick candle rejection, it is
a high probable trading opportunity. There is a short opportunity in this case. Same applies for a long opportunity with is having long rejection
candle at the support, colour of candle changes form red to green and the red candles keep shrinking as it reaches the particular support zone.
25. Combining candlestick patterns at key levels is a good way to find out potential trade opportunities. Whatever you have understood till now is just
a small part of whole price action ocean. In order to take the trading to the next level you need to keep adding to your price action multiple
concepts, called, Multiple time frame analysis, Intraday confirmation, Market condition, Supportive trading tools like CPR etc, Price action
patterns, Demand & supply zones etc.
Combining candlestick patterns together to improve trade quality
Example 2
WICKS STICKING OUT & COLOUR CHANGE &
INSIDE BAR
MOMENTUM
CANDLES
SHRINKING CANDLES
MINDFLUENTIAL
TRADING
47. Every moment is unique in the market
You should not trade just based on support and
resistance levels. There are more factors to look into.
MINDFLUENTIAL
TRADING
59. In a ideal uptrend, price makes higher highs and higher lows
"Price wont always move smoothly in trending
markets but this is what you can look for a
reference for an ideal trend movement"
70. Trend Lines
"You don't enter trades blindly
just because price has touched
a trend line, you always wait
for price action"
MINDFLUENTIAL
TRADING
Trend lines are drawn connecting the swing highs & swing lows. They act as support &
resistance but also a break in trendline can signal a possible trend change
71. Just like support and resistance they are "areas"
meaning use them as guidance for your overall
analysis.
The more touches the better, but more touches do not
guarantee that it will hold the next time around
(make sure to keep your swing highs & lows
contained inside the trend lines)
Treat Trend lines as "Areas"
If they are obvious and help your analysis draw
them, but if not leave them out because there won't
always be suitable price movement where you can
draw a trendline in
They are often choppy and imperfect (just
like the market)
1 Need a minimum of 2 touches
2
Don't force trend lines
3 They may be Imperfect
4
TREND
LINES
Concepts to follow
MINDFLUENTIAL
TRADING
How to draw trend lines effectively to adapt to all the price movement.?
Follow these concepts for drawing effective trend lines
72. "You don't enter a trade once you get
a trendline break, you need to pair it
with another price action factors"
MINDFLUENTIAL
TRADING
A break of trend line can signal a "possible" trend change
73. MINDFLUENTIAL
TRADING
When the price falls/rises sharply, you won't always be able to apply a trend line onto the trend
because the price movement won't be suitable for it as shown in the chart below.
74. "Draw your trendlines in an
area you can get most amount
of touches. The touch can be
of body or the wick"
MINDFLUENTIAL
TRADING
How to draw trend lines effectively to adapt to all the price movement??
Imperfect trendlines are those where you won't be able to connect all the swing highs and swing lows when drawing
trend lines. In such scenario draw trend lines in an area that gets most amount of touches, leave the rest as shown below.
75. "Don't think too hard about
this since we use trend line as
guidance and treat them as
areas not a solid line"
How to draw trend lines effectively to adapt to all the price movement.
MINDFLUENTIAL
TRADING
Imperfect trendlines are those where you won't be able to connect all the swing highs and swing lows when
drawing trend lines. In such scenario draw trend lines in an area that gets most amount of touches, leave the
rest as shown below.
76. Support & Resistance traders watching this area for shorting opportunity.
Trendline traders are watching this area for short trade opportunities.
Price action and candlestick traders watching this area for short trade opportunities.
Confluence traders like us watching this area knowing all these traders are here.
Many types of traders are watching this "AREA OF CONFLUENCE"
1.
2.
3.
4.
MINDFLUENTIAL
TRADING
How to use trend lines in combination with price action for trend trading and reversal trading.
1. Trend Trading with trend lines
77. Now lets analyze this in depth as to what should be going through your mind as a trader. This is very important, this extra analysis
differentiate between average trader and exceptional trader
MINDFLUENTIAL
TRADING
78. 5 6
When you practice doing this kind of in-depth analysis, you will end up identifying high probable trades, you don't need many average
trades to be profitable, just a few high probable trades with proper risk management to be a profitable trader.
MINDFLUENTIAL
TRADING
79. Look for key price action patterns that have formed "Right Before" a trendline break.
Reversal Trading in An Uptrend
"In a downtrend - look for double bottom at key support"
There are many kinds of price action patterns you can look for such as top & bottoms, wedges, triangles, candlestick analysis, etc.
MINDFLUENTIAL
TRADING
2. Reversal Trading with trend lines
80. "The reason we look for price
action patterns right before a
trend line break is because we
are going against trend and
we must see momentum loss"
MINDFLUENTIAL
TRADING
Reversal Trading in a Downtrend
92. End of Day 1 Session
Thank you so much for attending, share your genuine
feedback about the sessions over telegram / Instagram.
Your feedback helps many..!
MINDFLUENTIAL
TRADING
Mindfluential Trading