1. The document provides an overview of various learning modules for trading, organized into sections on risk management, candlesticks, trade size, margin trading, basics, trading psychology, entering trades, indicators, Fibonacci, channels, volume, footprint charts, tools and charts, patterns, and strategies.
2. The basics section covers key theory around developing a trading edge, risk management, trade planning, support and resistance levels, and daily routines.
3. Support and resistance levels are important to map on charts, and when they are broken, they flip to provide the opposite level of support or resistance. Market structure and key price levels dictate how markets move.


![134
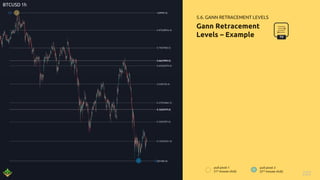
Average Directional Index –
Example
4.1. INDICATORS
BTCUSD 4h
In TradingView the ADX indicator is under the name
‘Average Directional Index with DI+ and DI-’
medium uptrend
medium-strong
downtrend
sideway action,
no strong trend
Check for trend confirmations
study("Average Directional Index with DI+ and DI-", shorttitle="ADX/DI+/DI-")
adxlen = input(14, title="ADX Smoothing")
dilen = input(14, title="DI Length")
dirmov(len) =>
up = change(high)
down = -change(low)
truerange = rma(tr, len)
plus = fixnan(100 * rma(up > down and up > 0 ? up : 0, len) / truerange)
minus = fixnan(100 * rma(down > up and down > 0 ? down : 0, len) / truerange)
[plus, minus]
adx(dilen, adxlen) =>
[plus, minus] = dirmov(dilen)
sum = plus + minus
adx = 100 * rma(abs(plus - minus) / (sum == 0 ? 1 : sum), adxlen)
adxHigh(dilen, adxlen) =>
[plus, minus] = dirmov(dilen)
plus
adxLow(dilen, adxlen) =>
[plus, minus] = dirmov(dilen)
minus
sig = adx(dilen, adxlen)
sigHigh = adxHigh(dilen, adxlen)
sigLow = adxLow(dilen, adxlen)
plot(sig, color=blue, title="ADX")
plot(sigHigh, color=green, title="DI+")
plot(sigLow, color=red, title="DI-")](https://image.slidesharecdn.com/tradingtechniquescc-221124005330-5f6d7e76/85/Trading-Techniques-CC-pdf-134-320.jpg)


![138
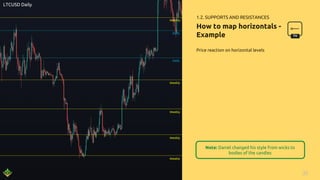
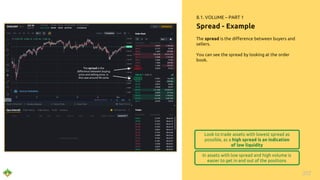
Advanced RSI – Example
4.1. INDICATORS
BTCUSD 5 min
Look for divergences and overbought/oversold signals
study(title="CM_Ultimate RSI MTF", shorttitle="CM_Ult_RSI_MTF", precision=0)
src = close
len = input(14, minval=1, title="Length")
upLine = input(70, minval=50, maxval=90, title="Upper Line Value?")
lowLine = input(30, minval=10, maxval=50, title="Lower Line Value?")
sml = input(true, title="Show Mid Line?")
sbh = input(true, title="Show Back Ground Highlights When RSI is Above/Below High/Low Lines?")
sch = input(true, title="Show Back Ground Highlights When RSI Cross?")
sl = input(true, title="Show 'B' and 'S' Letters When RSI Crosses High/Low Line?")
useCurrentRes = input(true, title="Use Current Chart Resolution?")
resCustom = input(title="Use Different Timeframe? Uncheck Box Above", type=resolution, defval="60")
ssRSI = input(false, title="Show 2nd RSI?")
resCustom2 = input(title="Use 2nd RSI? Check Box Above", type=resolution, defval="D")
useCurrentRes2 = input(false, title="Use 2nd RSI Plot On Samet Timeframe?")
len2 = input(14, minval=1, title="2nd RSI Length")
res = useCurrentRes ? period : resCustom
res2 = useCurrentRes2 ? period : resCustom2
up = rma(max(change(src), 0), len)
down = rma(-min(change(src), 0), len)
rsi = down == 0 ? 100 : up == 0 ? 0 : 100 - (100 / (1 + up / down))
outRSI = security(tickerid, res, rsi)
up2 = rma(max(change(src), 0), len2)
down2 = rma(-min(change(src), 0), len2)
rsi2 = down2 == 0 ? 100 : up2 == 0 ? 0 : 100 - (100 / (1 + up2 / down2))
outRSI2 = security(tickerid, res2, rsi2)
aboveLine = outRSI > upLine ? 1 : 0
belowLine = outRSI < lowLine ? 1 : 0
crossUp = outRSI[1] < lowLine and outRSI > lowLine ? 1 : 0
crossDn = outRSI[1] > upLine and outRSI < upLine ? 1 : 0
bgcolor(sbh and aboveLine ? red : na, transp=70)
bgcolor(sbh and belowLine ? green : na, transp=70)
bgcolor(sch and crossUp ? lime : na, transp=40)
bgcolor(sch and crossDn ? red : na, transp=40)
plot(outRSI, title="RSI", style=line, linewidth=3, color=aqua)
plot(ssRSI and outRSI2 ? outRSI2 : na, title="2nd RSI -
Different Time Frame?", style=linebr, linewidth=4, color=orange)
p1 = plot(upLine, title= "Upper Line", style=solid, linewidth=3, color=red)
p2 = plot(lowLine, title= "Lower Line", style=solid, linewidth=3, color=lime)
plot(sml and 50 ? 50 : na, title="Mid Line", style=linebr, linewidth=2, color=gray)
plotchar(sl and crossUp ? crossUp : na, title="Buy Signal", char='B', location=location.bottom,
color=lime, transp=0, offset=0)
plotchar(sl and crossDn ? crossDn : na, title="Sell Signal", char='S', location=location.top, color=red,
transp=0, offset=0)
fill(p1, p2, color=silver, transp=70)
Local RSI indicates oversold, but
the daily is still in overbought,
so the uptrend might not start
or persist less than expected
Overbought both in local
(5 min) RSI and in daily
RSI, confirmation of a
possible downtrend](https://image.slidesharecdn.com/tradingtechniquescc-221124005330-5f6d7e76/85/Trading-Techniques-CC-pdf-138-320.jpg)


![146
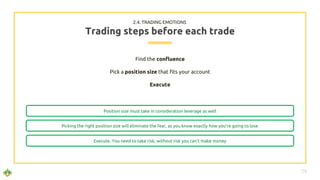
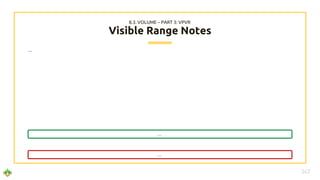
MFI – Example
4.1. INDICATORS
BTCUSD 4h
Look in particular for two consecutive green bars in
the 4hr time frame for a trend confirmation
study("Market Facilitation Index - MFI")
MFI = (high - low) / volume
PreMFI = (high[1] - low [1]) / volume[1]
greenbar = (MFI > PreMFI) and (volume > volume[1])
fadebar = (MFI < PreMFI) and (volume < volume[1])
fakebar = (MFI > PreMFI) and (volume < volume[1])
squatbar = (MFI < PreMFI) and (volume > volume[1])
bar_color = greenbar ? green : fadebar ? maroon : fakebar ? blue : squatbar ? fuchsia : na
plot(MFI, color=bar_color, style=columns)
two green bars in a row: probable
continuation of the uptrend
blue bars in uptrend: possible
local trend reversal](https://image.slidesharecdn.com/tradingtechniquescc-221124005330-5f6d7e76/85/Trading-Techniques-CC-pdf-146-320.jpg)


![Support and-resistance-simplified[1]](https://cdn.slidesharecdn.com/ss_thumbnails/support-and-resistance-simplified1-120113122100-phpapp01-thumbnail.jpg?width=640&height=640&fit=bounds)