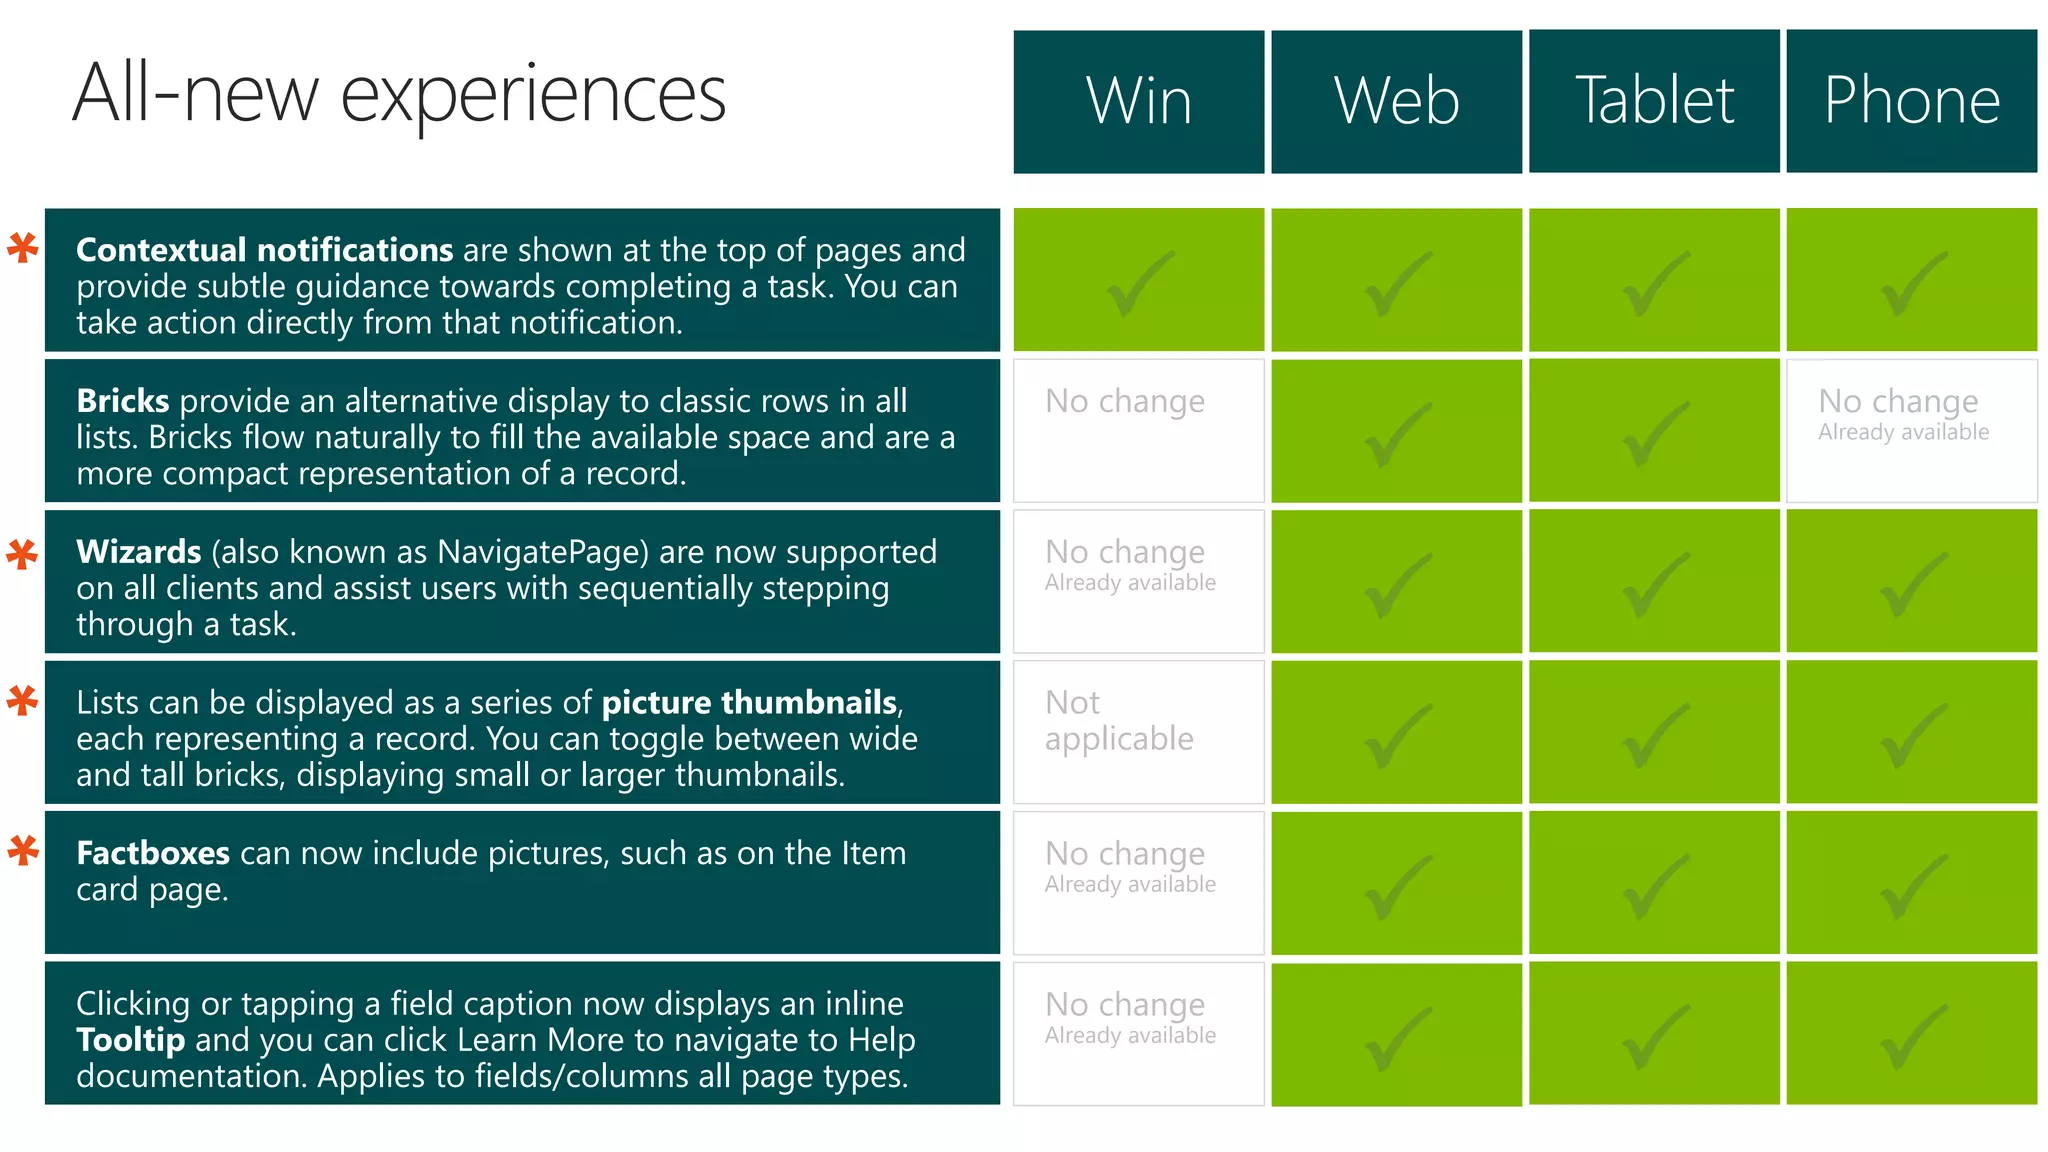
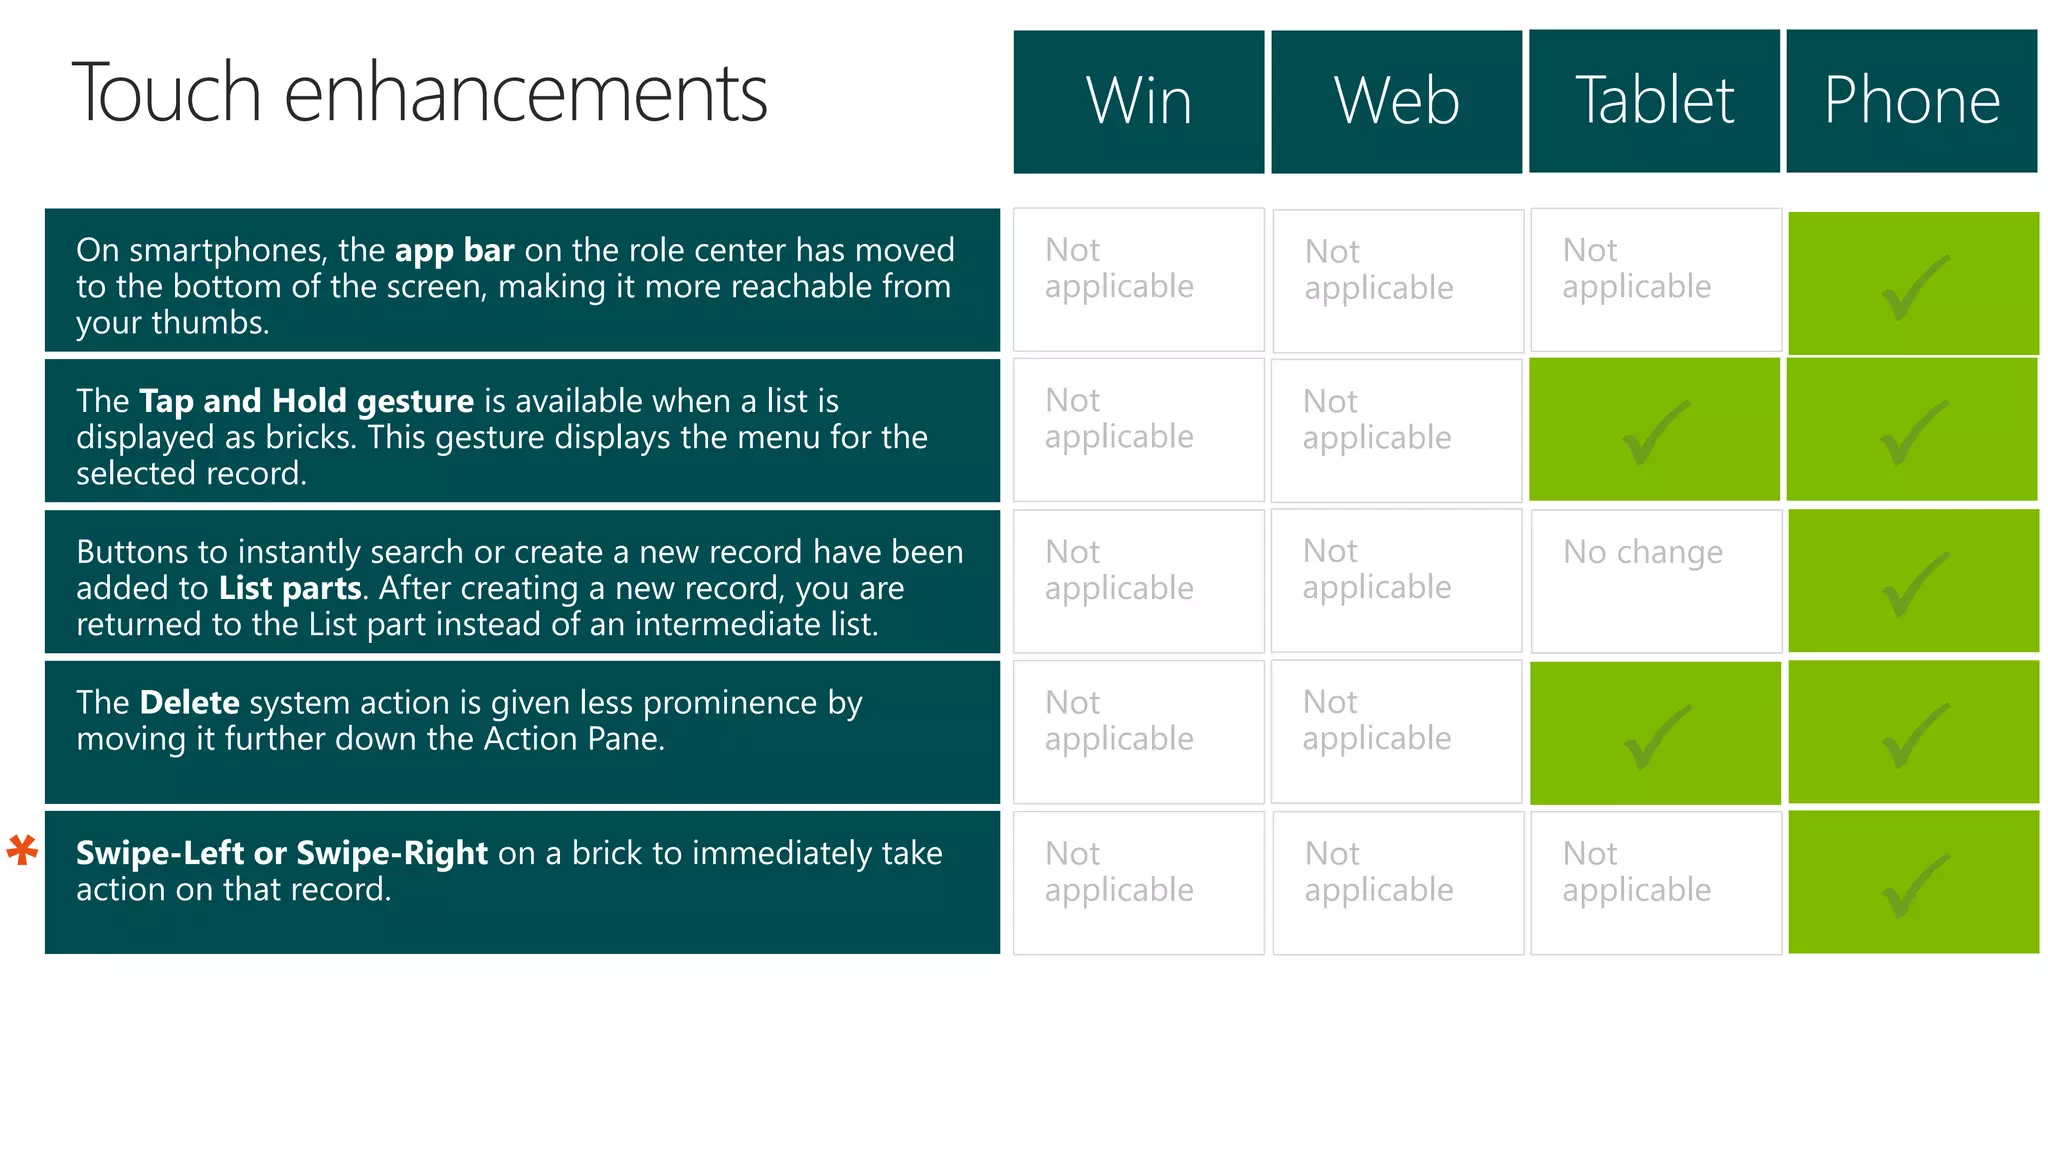
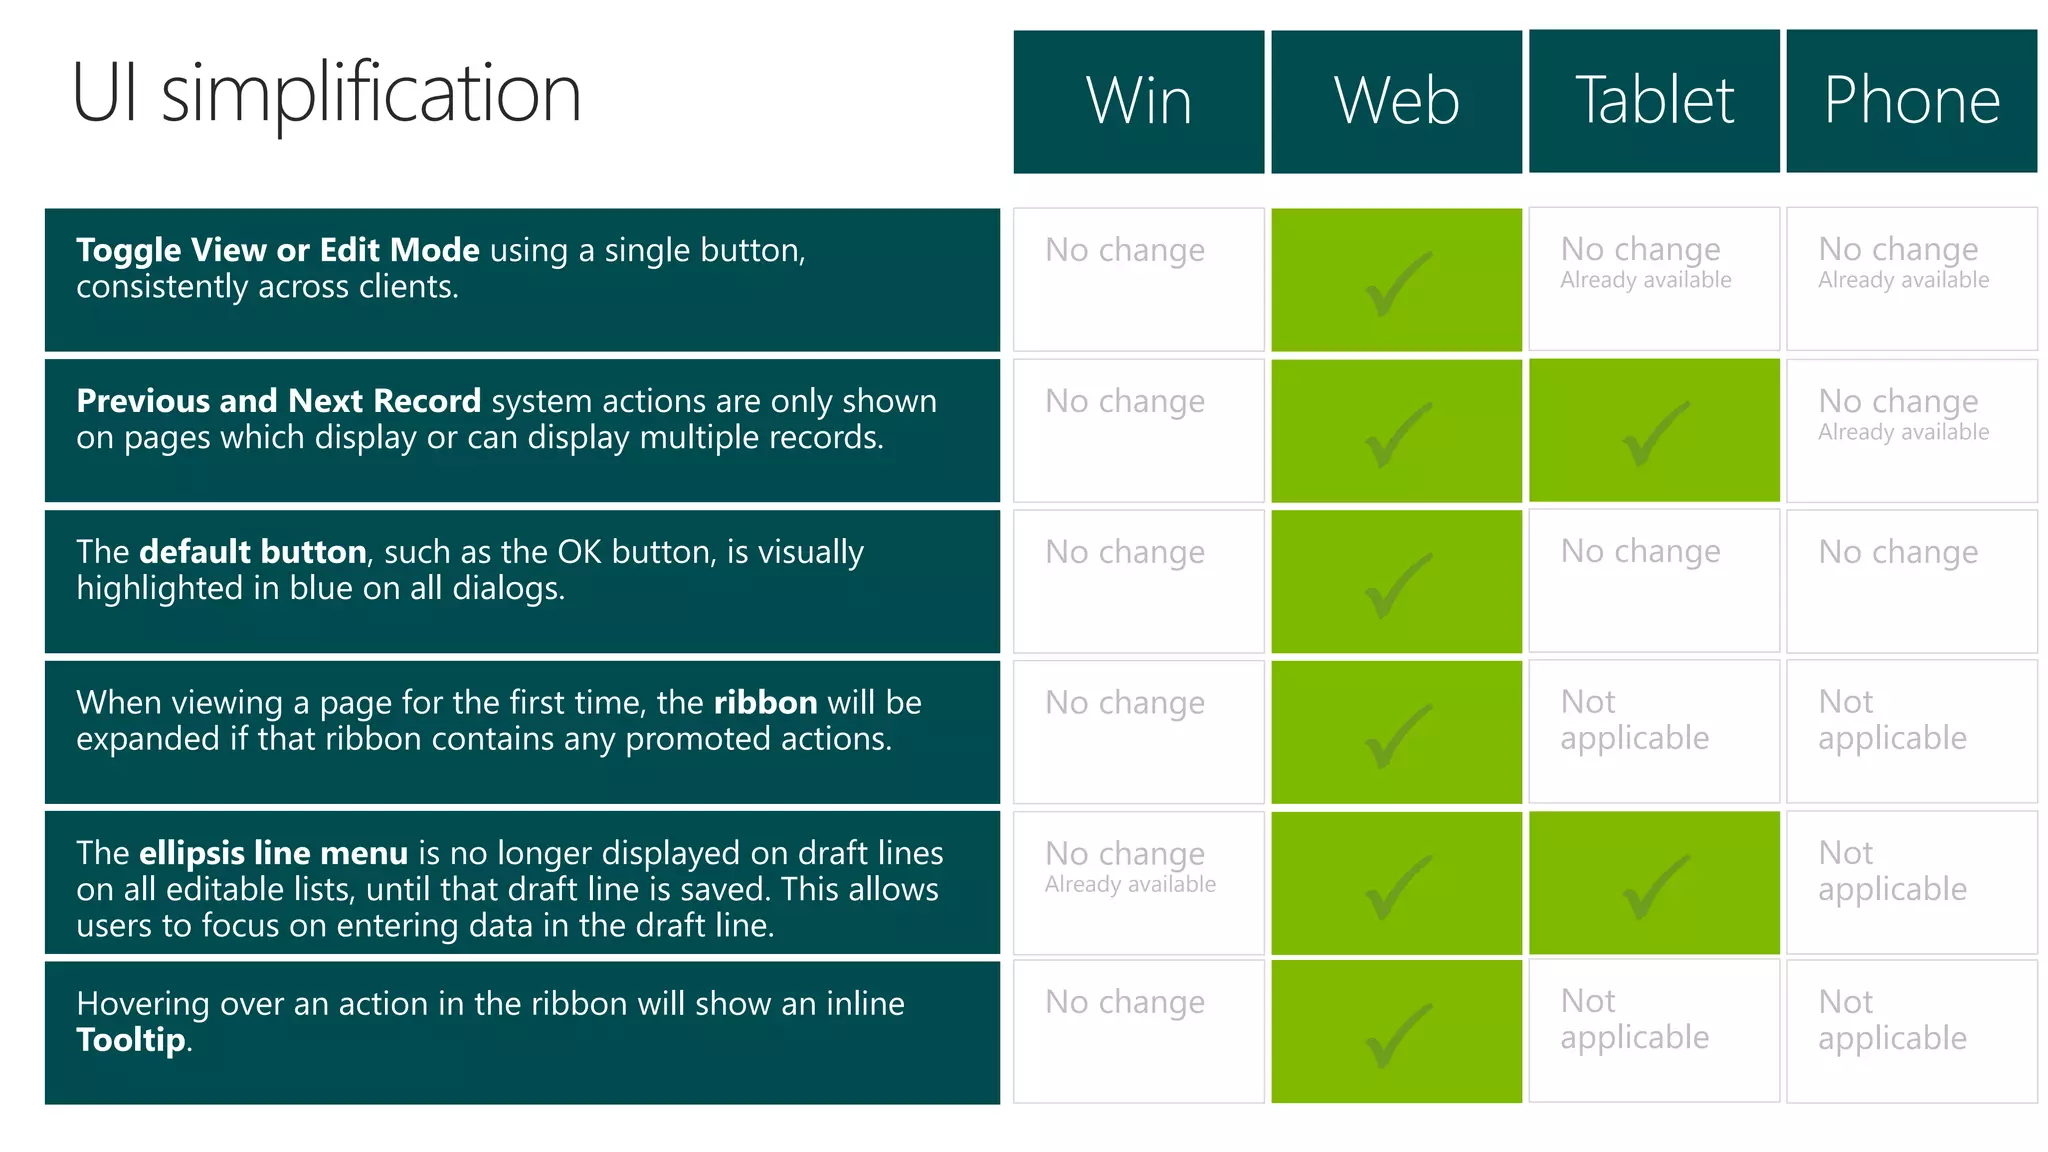
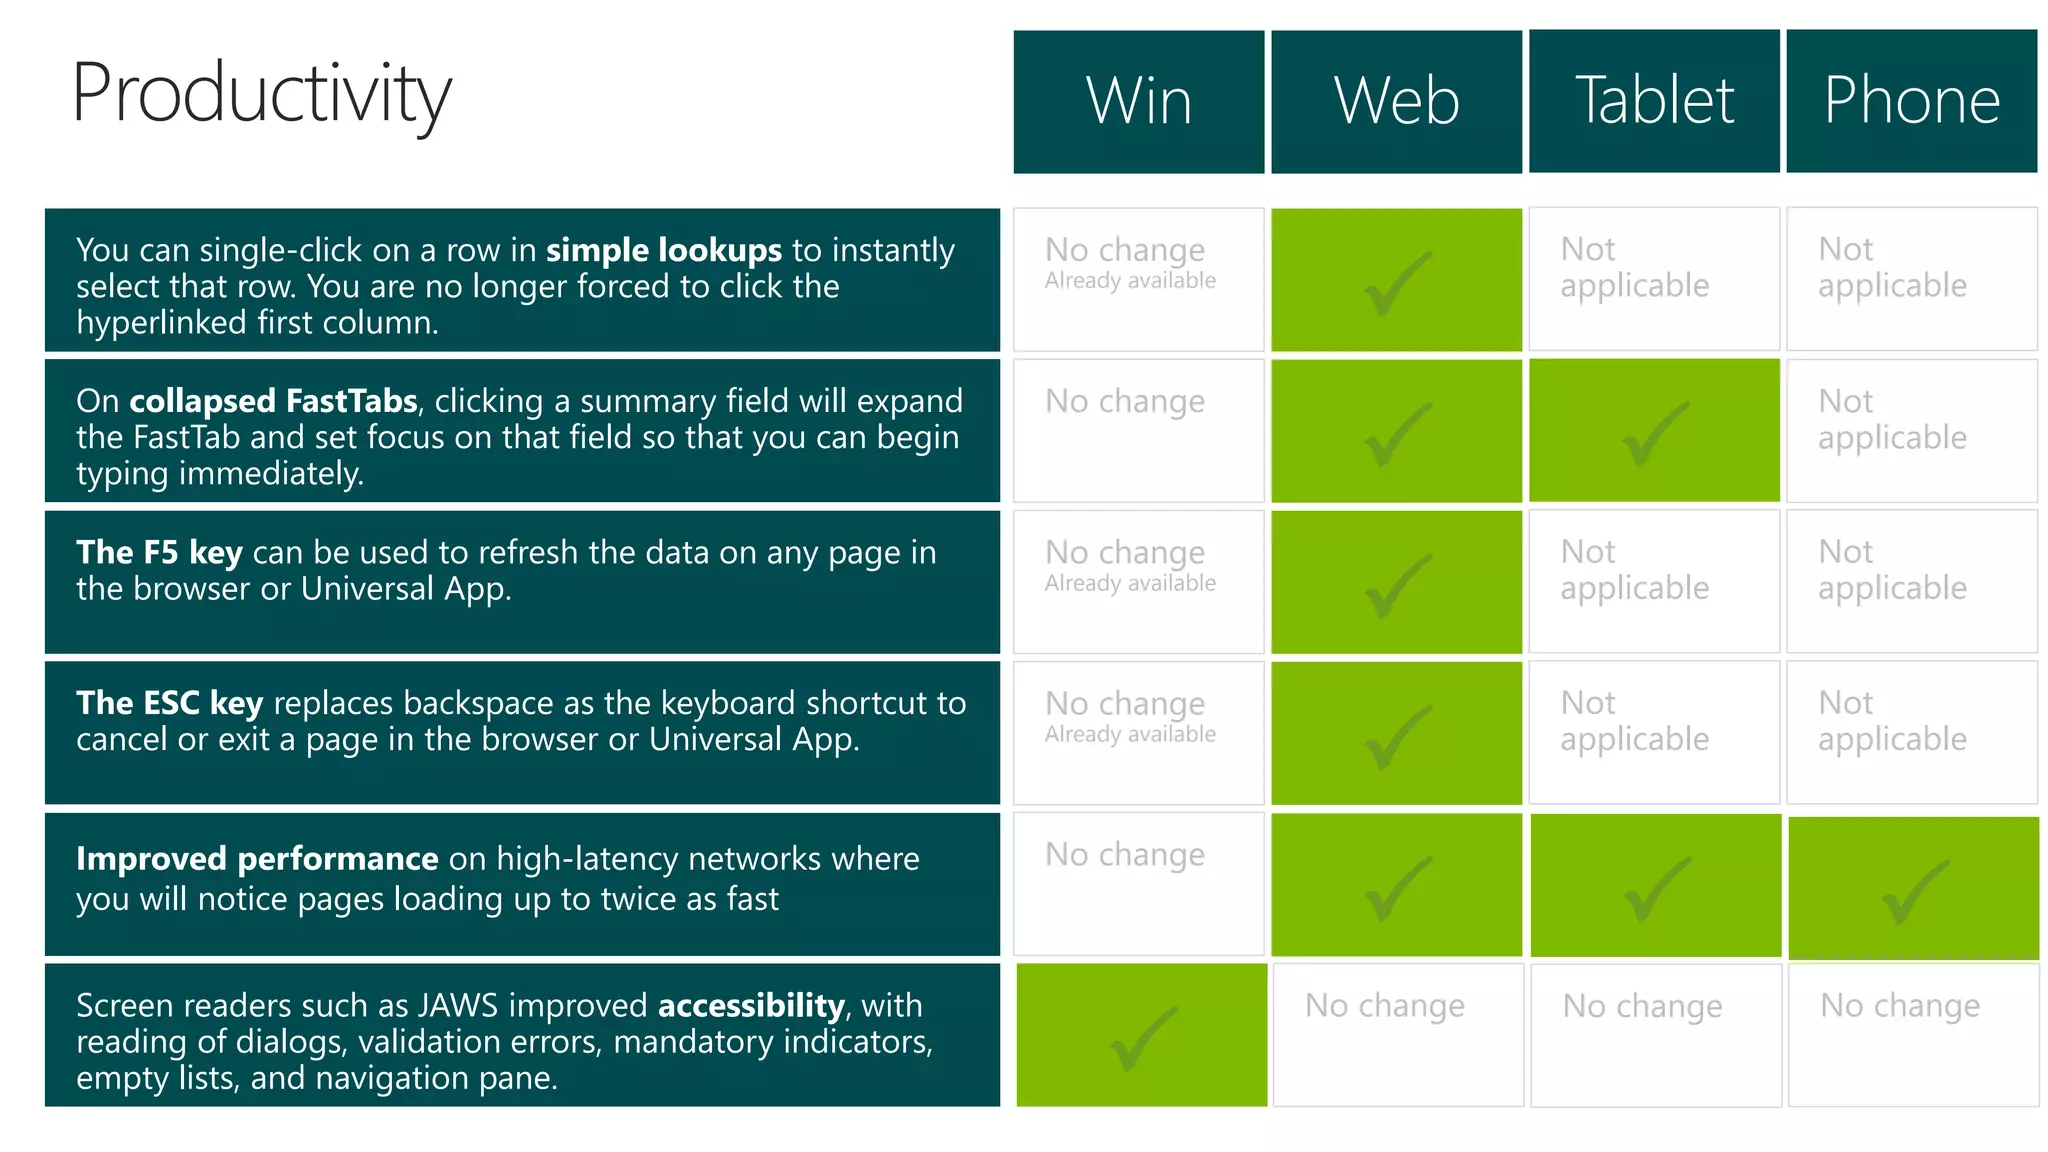
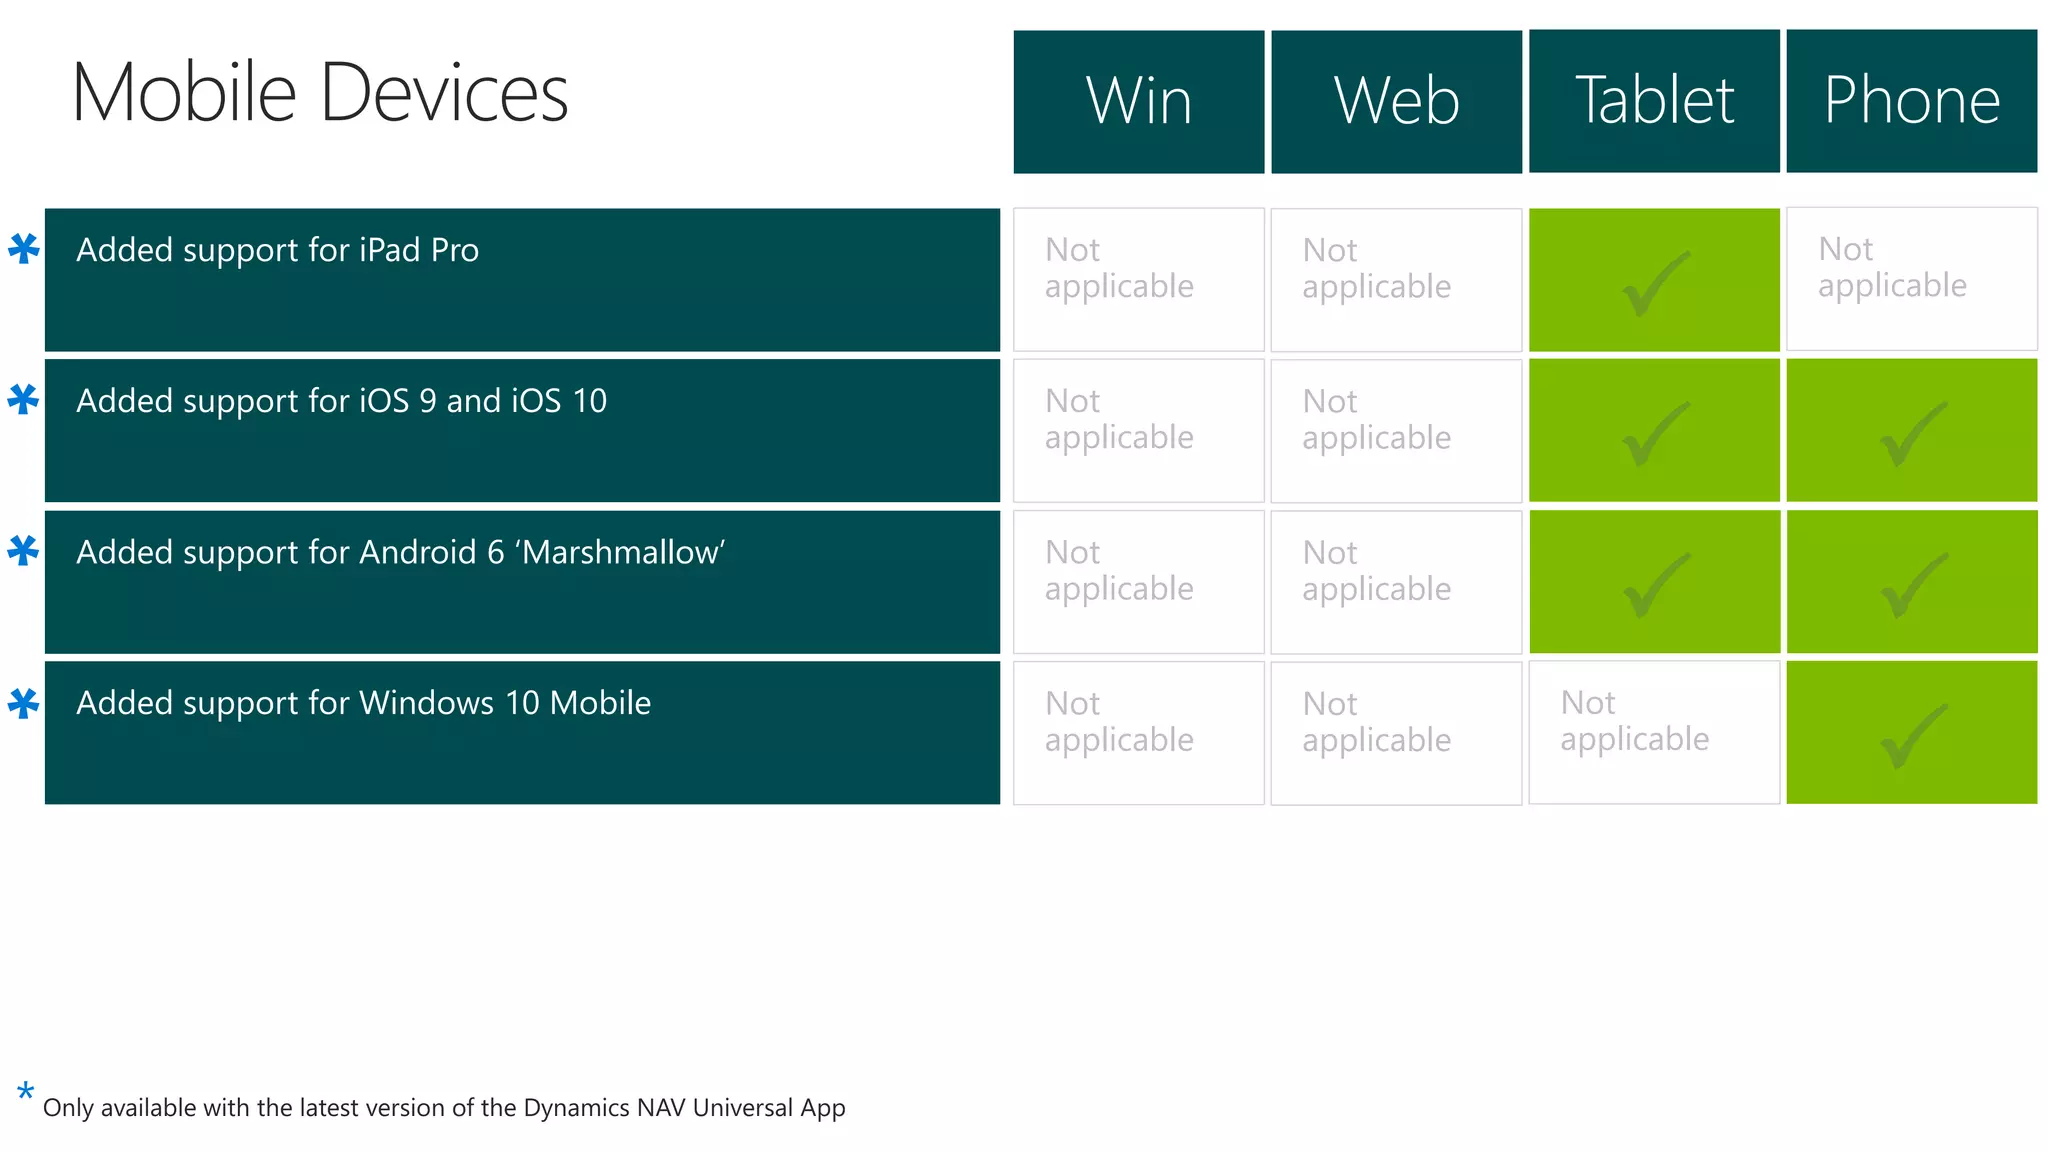
This document provides steps to create a simple spreadsheet in Excel. It instructs the user to open Excel, type a title in cell A1, enter table headings in cells A1 through C1, enter sample data as shown, select text to change font size or type, and select the entire table to apply borders. The purpose is to guide a user through basic spreadsheet formatting and data entry in 5 concise steps.
This document contains contact information for Ayebazibwe Kenneth, an IT trainer and web-based programmer based in Uganda, and provides brief instructions on how to modify various text formatting options in Microsoft Word, including font type, size, style, color, text effects, paragraph alignment, indentation, and text direction.
The document discusses various paragraph formatting options in Microsoft Word, including alignment, indentation, line spacing, tabs, and using the ruler and paragraph dialog box. It provides details on how to change formatting for entire paragraphs using tools on the formatting toolbar or paragraph dialog box to set options like alignment, numbering, bullets, borders and indentation. It also covers setting line spacing, paragraph spacing, tabs, and using the ruler to set tabs and indentation.
This document provides tips and shortcuts for navigating Oracle E-Business Suite more efficiently using keyboard shortcuts. It recommends setting favorites and top 10 preferences on the home page for frequently used forms. Navigation between responsibilities can be done using Alt+F+W. The folder feature allows customizing form displays and saving queries. Keyboard shortcuts exist for common tasks like bringing up the concurrent request form (Alt+V+R), submitting new requests (Alt+N), and moving between invoice lines (Alt+2). Learning these shortcuts makes interacting with Oracle E-Business Suite faster without using the mouse as much.
Word Chapter 2 - Formatting Characters and Paragraphsdpd
This document provides instructions for formatting characters and paragraphs in Microsoft Word 2007. It discusses how to change fonts, font styles, paragraph alignment, indentation, line spacing, and other formatting. Key topics covered include using formatting tools like the mini toolbar, font dialog box, paragraph dialog box, and format painter to apply styles and formatting. It also lists keyboard shortcuts for common formatting tasks.
Ms 2010 tutorial topic 4 editing a document (edit text_tutorial)JessicaRenslow
The document provides instructions for editing text fonts, sizes, colors, effects, alignment, and indentation in Microsoft Word 2010. It includes 28 steps describing how to:
1) Select text and change font type and size using buttons on the Home tab.
2) Change font color and apply text highlighting or effects using color and formatting buttons.
3) Align text left, center, right, or justify using alignment buttons or keyboard shortcuts.
4) Indent paragraphs or specific lines using indentation buttons or the Paragraph Dialog box.
The document discusses various paragraph formatting options in Microsoft Word including alignment, line spacing, bullets and numbering, indentation, borders, and shading. It provides details on how to use the alignment buttons, line spacing button, numbering and bullet options, increase/decrease indent buttons, customize borders using the borders and shading dialog box, and add shading to draw attention to text. The paragraph formatting tools are found on the home tab.
This document provides instructions for formatting text in Excel 2007. It describes how to bold, italicize, and underline text by selecting cells and clicking the corresponding formatting buttons. It also explains how to change font style, size, color, add borders, and apply fill colors. The final section discusses formatting numbers and dates by selecting number format options. The challenge at the end asks the reader to practice these formatting skills on a sample workbook.
Microsoft Dynamics NAV 2017: what's newChristiaens
Microsoft Dynamics NAV 2017 is a business solution from Microsoft that continues to be enhanced, quick to implement, easy to use and has the power to support your business ambitions.
Las nuevas iniciativas y mejoras
Entonces, ¿qué podemos esperar en el próximo lanzamiento? La última versión de Navision, Dynamics NAV 2017, sin duda, ofrece una serie de nuevas iniciativas y mejoras. En la actualidad Microsoft revela muy poco acerca de la próxima versión, pero sin embargo se ve muy prometedor:
Office 365
Una mayor integración con Office 365. Microsoft Dynamics NAV 2017 mejorará sustancialmente la vinculación con Office 365, lo que permitirá a los usuarios revisar, analizar y compartir datos relevantes en la empresa, mejorar el trabajo en equipo y la productividad . Y con la nueva interfaz de usuario mejorada Office 365 es aún más manejable y fácil de usar y funciona a la perfección y sin esfuerzo a través todas las soluciones.
Azure
Predefinida Azure ML servicios. Microsoft Azure es una plataforma en la nube desarrollada por Microsoft y está diseñada para permitir a los usuarios trabajar de manera más eficiente y por lo tanto ahorrar tiempo y recursos. La plataforma desarrollada por Microsoft permite el desarrollo, despliegue y gestión de aplicaciones y servicios a través de una red global de centros de datos de Microsoft
CRM Dynamics
Dynamics NAV2017 permitirá mejorar su capacidad para la gestión de ventas y clientes con Microsoft Dynamics CRM, que a partir de una configuración aún más simplificada, permitirá el uso del software desde la propia plataforma de Dynamics NAV con nuevas y mejoradas funcionalidades.
Micro vertical solutions. Las nuevas Apps, diponibles a traves de Microsoft AppSource permitirán acceder a una oferta global de soluciones verticales desarrolladas por los socios de Microsoft
This document introduces Microsoft Dynamics NAV 5.0, an ERP software. It highlights new features that improve business processes without complex implementations. These include enhanced integration with Microsoft Office, improved performance, and a focus on simplicity, ease of use, productivity and flexibility. The document also outlines the product roadmap and encourages customers and partners to upgrade to take advantage of increased opportunities through integration with other Microsoft products.
The document discusses developing a godly perspective. It provides three ways to do so:
1. Understand God's purpose by following His plan as shown through biblical figures like Moses and Joseph who endured hardship but God used for good.
2. Have faith in God's promises by believing what He has said, as seen in Romans where Abraham was convinced of God's promises.
3. Be assured of God's presence wherever you go, as God promised to be with Joshua as with Moses and as described in Psalm 23 with God's comfort during difficult times.
Extending Dynamics NAV 2016 with Power BI and Microsoft Office | Diana BirdKatie Elliott
In this session you'll discover how Dynamics NAV 2016 leverages Power BI to transform your company's data into rich visuals for you to collect and organize so you can focus on what matters to you. We'll also explore the seamless integration between Microsoft Dynamics NAV 2016 and Microsoft Office for reporting and data manipulation.
This document from Roberto Stefanetti welcomes the reader to help resources for Microsoft Dynamics NAV and provides links to pages covering an overview of the product and architecture, technical reference, system requirements, upgrading to the 2017 version, and deployment information. The document aims to introduce developers and IT professionals to documentation for Dynamics NAV.
Power BI for Dynamics - AJ Ansari - NAVUG Webinar -v3AJ Ansari
This document discusses Microsoft Power BI and how it can be used with Dynamics NAV. Power BI provides self-service business analytics tools for analyzing data and sharing insights. It has a freemium pricing model and works across devices. The document outlines how to connect Dynamics NAV to Power BI using the Dynamics NAV content pack in just four steps. It also discusses considerations for older NAV versions or non-internet facing deployments connecting to Power BI. The presenter demonstrates connecting NAV, working with reports and dashboards, and creating new datasets in Power BI Desktop.
Choosing the Right Microsoft BI Tool for the JobSenturus
The document discusses Microsoft's business intelligence (BI) tools and when to use each one. It provides an overview of Microsoft's BI offerings over time, from 2006 to the present. It then focuses on Power BI, demonstrating its features. The document compares tools like SQL Server, Power BI, and Excel and suggests which one to use depending on factors like the designer, audience, data size, and available resources. It concludes by sharing additional resources on Microsoft BI.
Introducing SNAP Portal: A modern intranet portal built on Office 365
Does your business have an old intranet that is infrequently used? You are not alone; the evolving workforce of today expects more from an intranet than just some news, announcements and a weather web part.
Empired’s SNAP Portal can help you rapidly challenge this all-too-familiar status quo, by delivering a modern, customised intranet portal which leverages the pieces of the Office 365 stack that are relevant for your workforce, creating a single source of truth for your business and its people and enabling swift return on investment.
This slide deck explores how Empired designs and builds a modern portal leveraging Office 365, and showcases Empired’s own SNAP Portal; which pulls the disparate features of Office 365 together into a single, cohesive workspace. It will also include a discussion about tools, such as Yammer vs. Office 365 Groups vs. Teams, how they can all fit and which ones are right for your business.
This document discusses various topics related to material design patterns, including selection, gestures, promoted actions, imagery treatment, and search. It covers text and item selection techniques on mobile platforms. It describes touch mechanics and activities for gestures. Promoted actions are discussed for floating action buttons. Guidelines are provided for imagery loading and treatment. Finally, it outlines in-app and persistent search patterns versus expandable search.
Course 6 (part 2) data visualisation by toon vanagtBetacowork
For more info about our Big Data courses, check out our website ➡️ https://www.betacowork.com/big-data/
---------
"Data is the new oil" - Many companies and professionals do not know how to use their data or are not aware of the added value they could gain from it.
It is in response to these problems that the project “Brussels: The Beating Heart of Big Data” was born.
This project, financed by the Region of Brussels Capital and organised by Betacowork, offers 3 training cycles of 10 courses on big data, at both beginner and advanced levels. These 3 cycles will be followed by a Hackathon weekend.
No prerequisites are required to start these courses. The aim of these courses is to familiarize participants with the principles of Big Data.
------
For more info about our Big Data courses, check out our website ➡️ https://www.betacowork.com/big-data/
ACTG Tableau intro labDownload the TableauLab file and look ov.docxnettletondevon
ACTG Tableau intro lab
Download the TableauLab file and look over the fields. These are the fields from the FoodiesNW file you’ll use for your individual dashboard project. I created this file by selecting all fields in all the files in Access, so there are duplicates. I also added some calculations fields to the file:
Ext Gross is the extension of price X quantity; Ext Net is the extension of price X quantity, net of discount
Open Tableau and connect to Excel data. Select the TableauLab file and drag the file to the location that says Drag Files Here. Select Extract in the upper right so that Tableau will make a copy of your data. Click on the tab at the bottom that says Sheet1 to begin your first visualization.
How much is your total sales for the past 3 years?
Move the ExtNet field to the center of the sheet (similar to the values area in a pivot table). Then move it to the Rows and Columns shelves to see what happens. Then click on the first icon in the show me area – it looks like a worksheet. That icon turns your graph back into a tabular format and moves the ExtNet field over to the Marks section and lables it as text.
SHEET 1: In which time period did you sell most?
Move the Order Date field to the Rows shelf and then to the Columns shelf. Click on various graph types on the right hand side to see what happens, and then return to a tabular format.
**To create a vertical bar chart, you may need to use the Swap Rows and Columns icon in the toolbar – it has a curved arrow.
**You can sort the fields in a graph from high to low, low to high, and back to the starting position, by clicking on the icon right next to the Ext Net label on your graph
In which quarter did you sell most? Month?
Click on the drop down menu on the Order Date field in the Columns shelf and select Quarter and then Month. View this data in charts and tabular format. Change it to a line graph.
** To zoom in and out on a part of the graph, double-click, or hold Shift and double-click. Or, click the table Icon, and then
Now move a second copy of the Order Date field to the Columns shelf, so that you have years first, and then quarters or months. Return to a bar graph. Does this change your perspective on yearly sales?
** Now filter out dates so that your range ends at the end of the last quarter, on 3/31/18 by moving a copy of the Order Date field to the Filters area and selecting Range of dates.
Double click on Sheet 1 and change its name to Sales by Quarter. Notice that the title above the graph changes too.
SHEET 2: Which product categories and products have you sold most of?
Click on the symbol next to the Sheet 1 tab to add another sheet. Move the Ext Net field to the Label icon in the Marks section. Then move Category Name to the Rows Shelf. Which is the most popular category?
How has that changed over the quarters? Filter the Order Dates so they end at 3/31/18. Move Order Date to the Columns shelf and select Quarter. Select the .
This document provides a summary of the Amaya User Manual. It describes the main features of the Amaya editor, including browsing capabilities, viewing and selecting documents, creating and opening documents, and using forms. The manual is organized as a book that can be printed. It focuses only on the specific aspects of Amaya rather than common functions in other programs.
The document describes the various parts of the Microsoft Word interface, including:
1) The Ribbon, which contains tabs, groups, and commands organized by function.
2) Other interface elements like the Office Button, rulers, task bar, and status bar, which allow accessing commands and viewing document properties.
3) The uses of Microsoft Word, which include creating business and personal documents like letters, reports, and books.
4) Exercises that test the reader's understanding of Word parts and functions by matching terms and identifying labeled diagrams.
This document contains UI elements and interaction patterns for an iPhone mockup app. It includes common interface elements like status bars, navigation bars, tab bars, as well as lists, tables, pickers, and keyboard designs. The file is intended to provide reusable vector graphics and guidelines for mockups, while deferring to Apple's official guidelines for final designs.
The document provides guidance on various iPhone user interface elements including status bars, navigation bars, tab bars, toolbars, search bars, action sheets, alerts, and table views. It explains what each element is used for and includes vector graphic representations that can be copied and pasted. It also notes that the definitive guide is Apple's official iPhone Interface Guidelines document.
This document describes the parts and functions of Microsoft Word. It includes 20 items such as the Office Button, Ribbon, document area, status bar, rulers, scroll bars, and indentation controls. The Office Button provides access to common commands like open, save and print. The Ribbon contains tabs with groups of related commands. Rulers, scroll bars and indentation controls help with formatting and layout. The status bar displays information about the document and view options.
The document discusses various page formatting options in Microsoft Word, including setting margins, page size and orientation, headers and footers, section breaks, columns, and printing. Key points covered include using the Page Setup dialog box to adjust margins and orientation; inserting section breaks to change formatting between sections; and using the Print Preview and Print dialog boxes to preview and adjust printing settings before printing a document.
89 identify the parts of a window desktop and common desktop iconsPaul Gonzales
This document discusses the basic parts and functions of the Windows user interface. It describes the title bar, status bar, document area, scroll bars, and buttons that are commonly found in windows. It also explains how to use a mouse, including clicking, double-clicking, right clicking, dragging, and scrolling. Basic keyboard functions are covered as well, such as the spacebar, escape key, caps lock, shift key, arrow keys, menu key, and alphanumeric keyboard.
89 identify the parts of a window desktop and common desktop iconsPaul Gonzales
This document discusses the basic parts and functions of the Windows user interface. It describes the title bar, status bar, document area, scroll bars, and buttons that are commonly found in windows. It also explains how to use a mouse, including clicking, double-clicking, right clicking, dragging, and scrolling. Basic keyboard functions are introduced, such as the spacebar, escape key, caps lock, shift key, arrow keys, menu key, and alphanumeric keyboard.
Microsoft Word allows users to perform mail merges to combine a main document with a data source to automatically populate fields. The steps are:
1. Create the main document with consistent text and insert merge fields where variable data is needed.
2. Select the data source which contains the variable fields like names and addresses.
3. Preview the merged documents before printing the final versions with the variable data inserted in the correct fields.
This document provides an overview of the basic terminology and tools in Microsoft PowerPoint. It discusses how to get started with PowerPoint and open a new presentation. It then summarizes the main menus and tools for formatting text, inserting images, tables, charts and other objects. The tools covered include changing fonts, formatting text, inserting slides, tables, pictures, and shapes. The document aims to accelerate learning PowerPoint through understanding its menus and ribbon interface.
This document provides an overview of the key features and tools in Microsoft Word, including:
1) It describes the various parts of the Word interface such as the title bar, menu bar, toolbars, rulers, and status bar.
2) It explains how to perform common tasks like opening and saving documents, cutting/copying/pasting text, formatting text styles and paragraphs, adding tables and pictures, and working with headers and footers.
3) It provides instructions for using many of the formatting and layout tools in Word for adjusting fonts, colors, alignments, margins, columns, and more.
Quickword allows you to open, view, edit, and save Microsoft Word documents on an iPad. It provides tools for zooming, scrolling, editing text and paragraph formatting, tracking changes, commenting, spelling checking, and printing or saving documents. Changes can be tracked and reviewed individually or bulk accepted/rejected.
The document provides an overview of Microsoft PowerPoint, including:
- PowerPoint allows users to create presentations consisting of slides, handouts, speaker notes, and outlines.
- The PowerPoint window includes tabs for inserting content and formatting slides, as well as tools for reviewing and presenting.
- Users can navigate between slides using the slide navigation pane or outline view.
Quickword allows you to open, view, edit, and save Microsoft Word documents on your iPad. It provides tools for zooming, scrolling, and following hyperlinks. You can format text with fonts, sizes, styles, colors and paragraphs properties. Tracking changes and comments can be reviewed and accepted or rejected. Spell check, dictionary, find and replace are also available. Documents can be printed using AirPrint or saved as a PDF.
Quickword allows you to open, view, edit, and save Microsoft Word documents on your iPad. It provides tools for zooming, scrolling, and following hyperlinks. You can format text with fonts, sizes, styles, colors and edit paragraphs. Tracking changes and comments can be reviewed, accepted or rejected. Spell check, dictionary, find and replace are also included. Documents can be printed or saved in various formats.
Similar to Microsoft Dynamics NAV 2017 - Complete list of client enhancements for end users (20)
Most organizations using Microsoft Dynamics NAV do not follow a regular upgrade pattern but most likely will upgrade at some point. This Powerpoint includes 5 things to consider when upgrading your NAV.
Three Most Common Realizations that it's Time to Upgrade Your Business SoftwareSolution Systems, Inc.
This presentation will discuss the three most common reasons small and medium sized businesses upgrade their existing business software and how Microsoft Dynamics 365 for Financials solves them.
Dynamics 365 for Financials offers faster deployment, easier use, and lower total costs than NetSuite. Dynamics 365 for Financials can be deployed within days using a simple installation process, while NetSuite deployments take weeks and require consultants. Dynamics 365 for Financials also saves time through features like processing tasks directly in Outlook and optical character recognition for invoices. In addition, Dynamics 365 for Financials has more affordable pricing, additional functionality for only $10 per user per month, and offers flexible payment options.
Dynamics 365 for Financials is a cloud-based ERP solution that includes modules for financial management, supply chain, inventory management, and more. It offers multi-currency, language, and company capabilities as well as data migration tools. Dynamics 365 is only available in the cloud and is sold directly from Microsoft. It deeply integrates with Microsoft offerings like Office 365, Power BI, PowerApps, and Flow. While it provides horizontal ERP capabilities, specific industry extensions are available from partners. Data migration from other financial systems can be assisted or use file uploads and Excel imports. Dynamics 365 for Financials is designed for smaller businesses, whereas Dynamics NAV and GP provide additional industry-specific functionality and can be deployed on-pre
Microsoft Dynamics NAV 2017 allows users to define attributes for items to track additional properties. Item attributes can store information like color, size, or other custom attributes. This helps users classify, filter, and report on items in more ways within the ERP system.
This document contains frequently asked questions (FAQs) about Microsoft Dynamics NAV answered by Michael Intravartolo of Solution Systems, Inc. The FAQs cover topics such as the length of item descriptions, whether production orders require bills of materials, the differences between global and shortcut dimensions, and more. Additional contact information is provided at the end.
Microsoft Dynamics NAV is an ERP software that can handle multiple companies with separate financial data. It allows undoing sales shipments, has no item copy function but item templates, and posts production activities to the general ledger by item and work center posting groups. It can also handle versions of production bills of materials and routings with one active version per date, and allows negative inventory for non-lot tracked items if configured. Customers can be deleted if they have no transactions in the current year and jobs.
Microsoft Dynamics NAV is an ERP software with the following key features:
- It uses the C/AL programming language which resembles Pascal.
- It offers object level permissions for controlling user access to tables, reports, and other objects.
- Licensed users are counted as concurrent users, so more named users can access the system than licensed seats as long as not all are connected at the same time.
- It supports features like undoing purchase receipts, creating quotes without customers, multi-currency handling, item tracking, deleting items if not used in transactions, optional use of routings for production orders, and reversing posted consumption.
This document contains frequently asked questions (FAQs) about Microsoft Dynamics NAV answered by Michael Intravartolo of Solution Systems. The FAQs cover topics such as implementation timelines (3-12 months), how to start learning NAV development, the purpose of closing dates in NAV, what drives prices and discounts, whether resources can be purchased, cost considerations, and that C/SIDE is the development environment. Contact information is provided for additional questions.
Michael Intravartolo, the marketing manager of Solution Systems, Inc., presented on whether controllers know that Microsoft Dynamics NAV can manage common finance processes like transactions, statements, accounts, costs. It asks if controllers know NAV enables managing all this information as well as inventory, manufacturing, and fixed assets costs. Contact information is provided for Michael Intravartolo to answer any questions.
In 3 sentences:
The document discusses whether company owners and CEOs are aware of the manufacturing capabilities within Microsoft Dynamics NAV, including managing production orders, bills of material, supply planning, and capacity requirements planning. It notes that these flexible processes and integrated information can help companies make accurate promises to customers, respond quickly to changes, and take advantage of new opportunities. Contact information is provided for Michael Intravartolo to discuss these capabilities further.
Microsoft Dynamics CRM integration with Microsoft Dynamics NAV enables users to access relevant business information from either system, optimizing the lead-to-cash process and facilitating informed decisions. The integration allows viewing and processing sales orders created in either CRM or NAV. It also makes navigating between the systems seamless, allowing increased sales and order accuracy as well as decreased time from lead to cash receipt.
The document discusses the top 3 time saving features of Microsoft Dynamics NAV 2016. The features include a mobile app that allows users to access Dynamics NAV 2016 from any device, resources for learning development in Dynamics NAV, and a cross column search feature on the web client that allows searching across columns in a list. The presentation was given by Michael Intravartolo from Solution Systems, Inc.
The document outlines new features in Microsoft Dynamics NAV 2016 including improvements to workflow, electronic documents, document sending profiles, posting preview, deferrals, integration with Microsoft Dynamics CRM, hiding and showing columns, freeze pane, lookups, social engagement, cross column search, navigation pane, entering dates, and control add-ins on mobile clients. It was presented by Michael Intravartolo from Solution Systems, Inc. at their Reimagine 2016 conference.
Microsoft's mission is to empower every person and every organization on the planet to achieve more. The company aims to have 60% of all employees and 90% of all companies using their cloud computing services by 2022. More information about Microsoft's cloud solutions can be found on their Madeira website and through Solution Systems Inc's social media channels and blog.
Microsoft Dynamics NAV (NAV) began at a small company in Denmark and has evolved into a global power-house being used by more than 110,000 organizations world-wide. NAV is an enterprise resource planning (ERP) software suite for mid-sized organizations that offers applications for financial management, human resources management, manufacturing, multiple and international sites, project management, sales and marketing, service management, supply chain management and business intelligence, with the functionality being particularly strong in manufacturing and distribution. Microsoft Dynamics NAV is also known for being highly customizable and partners have developed a long list of industry-specific configurations to serve various vertical markets.
Relative to Microsoft's other 3 ERP products, Dynamics NAV's sector is manufacturing and small distribution companies that want more than out-of-the-box functionality. Microsoft Dynamics NAV implemented by Solution Systems can add value to your business covering all operations and helping you...
The document discusses the benefits of exercise for mental health. Regular physical activity can help reduce anxiety and depression and improve mood and cognitive functioning. Exercise causes chemical changes in the brain that may help protect against mental illness and improve symptoms.
The document discusses the benefits of exercise for mental health. Regular physical activity can help reduce anxiety and depression and improve mood and cognitive function. Exercise causes chemical changes in the brain that may help protect against mental illness and improve symptoms.
NIMA2024 | De toegevoegde waarde van DEI en ESG in campagnes | Nathalie Lam |...BBPMedia1
Nathalie zal delen hoe DEI en ESG een fundamentele rol kunnen spelen in je merkstrategie en je de juiste aansluiting kan creëren met je doelgroep. Door middel van voorbeelden en simpele handvatten toont ze hoe dit in jouw organisatie toegepast kan worden.
63662490260Kalyan chart, satta matta matka 143, satta matka jodi fix , matka boss OTC 420, Indian Satta, India matka, matka ank, spbossmatka, online satta matka game play, live satta matka results, fix fix fix satta namber, free satta matka games, Kalyan matka jodi chart, Kalyan weekly final anl matka 420
KALYAN CHART SATTA MATKA DPBOSS KALYAN MATKA RESULTS KALYAN MATKA MATKA RESULT KALYAN MATKA TIPS SATTA MATKA MATKA COM MATKA PANA JODI TODAY BATTA SATKA MATKA PATTI JODI NUMBER MATKA RESULTS MATKA CHART MATKA JODI SATTA COM INDIA SATTA MATKA MATKA TIPS MATKA WAPKA ALL MATKA RESULT LIVE ONLINE MATKA RESULT KALYAN MATKA RESULT DPBOSS MATKA 143 MAIN MATKA KALYAN MATKA RESULTS KALYAN CHART
AI Transformation Playbook: Thinking AI-First for Your BusinessArijit Dutta
I dive into how businesses can stay competitive by integrating AI into their core processes. From identifying the right approach to building collaborative teams and recognizing common pitfalls, this guide has got you covered. AI transformation is a journey, and this playbook is here to help you navigate it successfully.
SATTA MATKA DPBOSS KALYAN MATKA RESULTS KALYAN CHART KALYAN MATKA MATKA RESULT KALYAN MATKA TIPS SATTA MATKA MATKA COM MATKA PANA JODI TODAY BATTA SATKA MATKA PATTI JODI NUMBER MATKA RESULTS MATKA CHART MATKA JODI SATTA COM INDIA SATTA MATKA MATKA TIPS MATKA WAPKA ALL MATKA RESULT LIVE ONLINE MATKA RESULT KALYAN MATKA RESULT DPBOSS MATKA 143 MAIN MATKA KALYAN MATKA RESULTS KALYAN CHART INDIA MATKA KALYAN SATTA MATKA 420 INDIAN MATKA SATTA KING MATKA FIX JODI FIX FIX FIX SATTA NAMBAR MATKA INDIA SATTA BATTA
L'indice de performance des ports à conteneurs de l'année 2023SPATPortToamasina
Une évaluation comparable de la performance basée sur le temps d'escale des navires
L'objectif de l'ICPP est d'identifier les domaines d'amélioration qui peuvent en fin de compte bénéficier à toutes les parties concernées, des compagnies maritimes aux gouvernements nationaux en passant par les consommateurs. Il est conçu pour servir de point de référence aux principaux acteurs de l'économie mondiale, notamment les autorités et les opérateurs portuaires, les gouvernements nationaux, les organisations supranationales, les agences de développement, les divers intérêts maritimes et d'autres acteurs publics et privés du commerce, de la logistique et des services de la chaîne d'approvisionnement.
Le développement de l'ICPP repose sur le temps total passé par les porte-conteneurs dans les ports, de la manière expliquée dans les sections suivantes du rapport, et comme dans les itérations précédentes de l'ICPP. Cette quatrième itération utilise des données pour l'année civile complète 2023. Elle poursuit le changement introduit l'année dernière en n'incluant que les ports qui ont eu un minimum de 24 escales valides au cours de la période de 12 mois de l'étude. Le nombre de ports inclus dans l'ICPP 2023 est de 405.
Comme dans les éditions précédentes de l'ICPP, la production du classement fait appel à deux approches méthodologiques différentes : une approche administrative, ou technique, une méthodologie pragmatique reflétant les connaissances et le jugement des experts ; et une approche statistique, utilisant l'analyse factorielle (AF), ou plus précisément la factorisation matricielle. L'utilisation de ces deux approches vise à garantir que le classement des performances des ports à conteneurs reflète le plus fidèlement possible les performances réelles des ports, tout en étant statistiquement robuste.
Tired of chasing down expiring contracts and drowning in paperwork? Mastering contract management can significantly enhance your business efficiency and productivity. This guide unveils expert secrets to streamline your contract management process. Learn how to save time, minimize risk, and achieve effortless contract management.
SATTA MATKA DPBOSS KALYAN MATKA RESULTS KALYAN CHART KALYAN MATKA MATKA RESULT KALYAN MATKA TIPS SATTA MATKA MATKA COM MATKA PANA JODI TODAY BATTA SATKA MATKA PATTI JODI NUMBER MATKA RESULTS MATKA CHART MATKA JODI SATTA COM INDIA SATTA MATKA MATKA TIPS MATKA WAPKA ALL MATKA RESULT LIVE ONLINE MATKA RESULT KALYAN MATKA RESULT DPBOSS MATKA 143 MAIN MATKA KALYAN MATKA RESULTS KALYAN CHART
Enhancing Adoption of AI in Agri-food: IntroductionCor Verdouw
Introduction to the Panel on: Pathways and Challenges: AI-Driven Technology in Agri-Food, AI4Food, University of Guelph
“Enhancing Adoption of AI in Agri-food: a Path Forward”, 18 June 2024
Enhancing Adoption of AI in Agri-food: Introduction
Microsoft Dynamics NAV 2017 - Complete list of client enhancements for end users
1.
2.
3. Bricks provide an alternative display to classic rows in all
lists. Bricks flow naturally to fill the available space and are a
more compact representation of a record.
Contextual notifications are shown at the top of pages and
provide subtle guidance towards completing a task. You can
take action directly from that notification.
Wizards (also known as NavigatePage) are now supported
on all clients and assist users with sequentially stepping
through a task.
P
Win Web Tablet
Lists can be displayed as a series of picture thumbnails,
each representing a record. You can toggle between wide
and tall bricks, displaying small or larger thumbnails.
Factboxes can now include pictures, such as on the Item
card page.
Clicking or tapping a field caption now displays an inline
Tooltip and you can click Learn More to navigate to Help
documentation. Applies to fields/columns all page types.
No change
P P
No change
Already available
P P
Not
applicable
P
No change
Already available
P
No change
Already available
*
Phone
P
No change
Already available
P P
P P P
*
*
P P
P P
*
P
4. The Tap and Hold gesture is available when a list is
displayed as bricks. This gesture displays the menu for the
selected record.
On smartphones, the app bar on the role center has moved
to the bottom of the screen, making it more reachable from
your thumbs.
Buttons to instantly search or create a new record have been
added to List parts. After creating a new record, you are
returned to the List part instead of an intermediate list.
Not
applicable
Win Web Tablet
The Delete system action is given less prominence by
moving it further down the Action Pane.
Swipe-Left or Swipe-Right on a brick to immediately take
action on that record.
Not
applicable
Not
applicable
Not
applicable
Phone
Not
applicable
Not
applicable
P
P
P P
P
Not
applicable
Not
applicable
P P
Not
applicable
Not
applicable
*
Not
applicable
Not
applicable
No change
5. Previous and Next Record system actions are only shown
on pages which display or can display multiple records.
Toggle View or Edit Mode using a single button,
consistently across clients.
The default button, such as the OK button, is visually
highlighted in blue on all dialogs.
No change
P
No change
Already available
Win Web Tablet
When viewing a page for the first time, the ribbon will be
expanded if that ribbon contains any promoted actions.
The ellipsis line menu is no longer displayed on draft lines
on all editable lists, until that draft line is saved. This allows
users to focus on entering data in the draft line.
Hovering over an action in the ribbon will show an inline
Tooltip.
No change
P P
No change
P
No change
P
Not
applicable
No change
Already available
P
No change
Already available
Phone
Not
applicable
Not
applicable
No change
Already available
No change No change
P
No change
P
Not
applicable
Not
applicable
6. On collapsed FastTabs, clicking a summary field will expand
the FastTab and set focus on that field so that you can begin
typing immediately.
You can single-click on a row in simple lookups to instantly
select that row. You are no longer forced to click the
hyperlinked first column.
No change
Already available
P
Not
applicable
Win Web Tablet
The F5 key can be used to refresh the data on any page in
the browser or Universal App.
The ESC key replaces backspace as the keyboard shortcut to
cancel or exit a page in the browser or Universal App.
No change
P P
No change
Already available
P
Not
applicable
No change
Already available
P
Not
applicable
Not
applicable
Phone
Not
applicable
Not
applicable
Not
applicable
Screen readers such as JAWS improved accessibility, with
reading of dialogs, validation errors, mandatory indicators,
empty lists, and navigation pane.
Improved performance on high-latency networks where
you will notice pages loading up to twice as fast
No change
P
No change No change
P
No change
P P
7. Added support for iOS 9 and iOS 10
Added support for iPad Pro Not
applicable
Win Web Tablet
Added support for Android 6 ‘Marshmallow’
Added support for Windows 10 Mobile
Not
applicable
P
Not
applicable
Not
applicable
Not
applicable
Not
applicable
Phone
P
P
P
P P
Not
applicable
Not
applicable
Not
applicable
Not
applicable
*
*
*
*
*