Downloaded 291 times


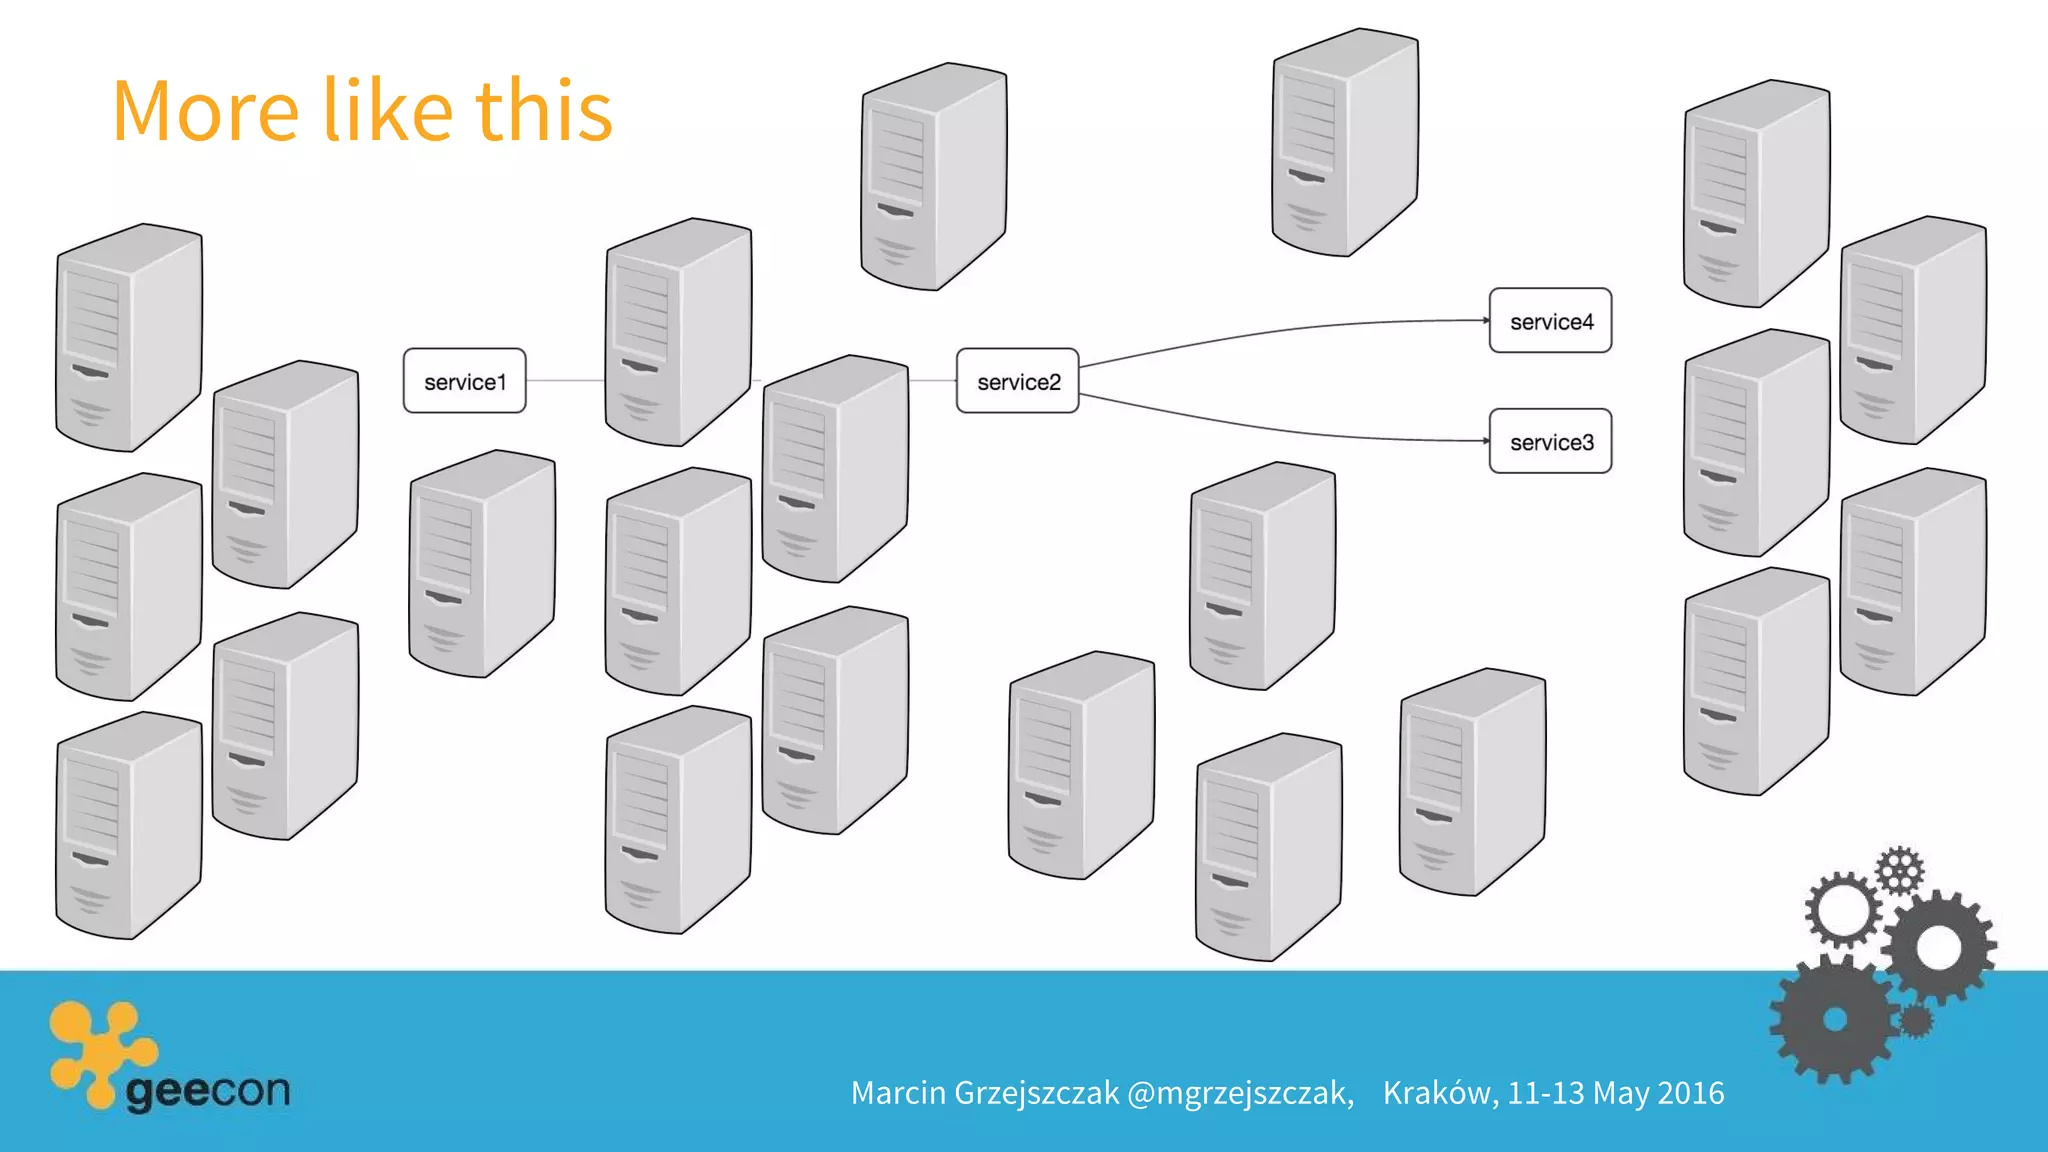


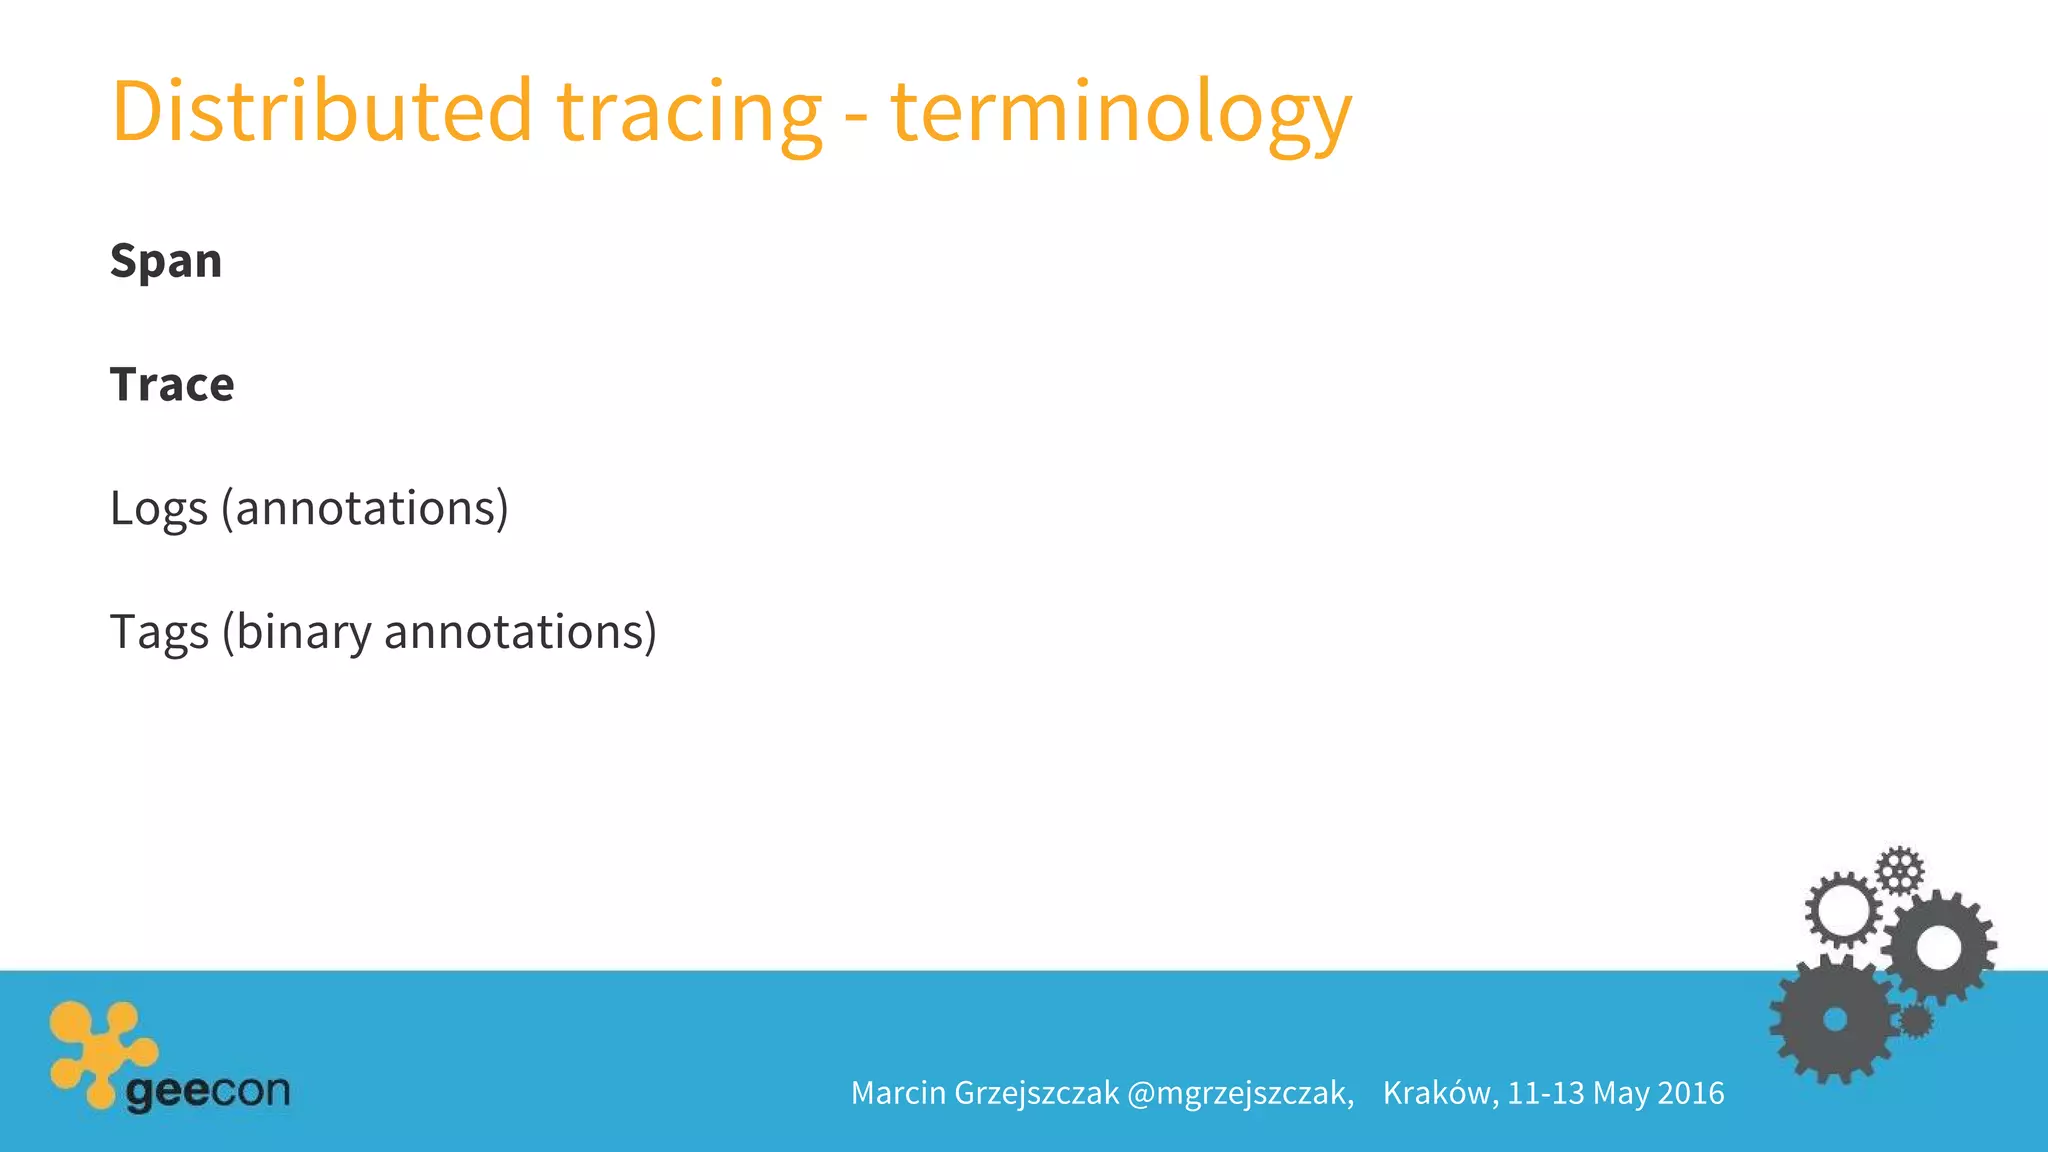

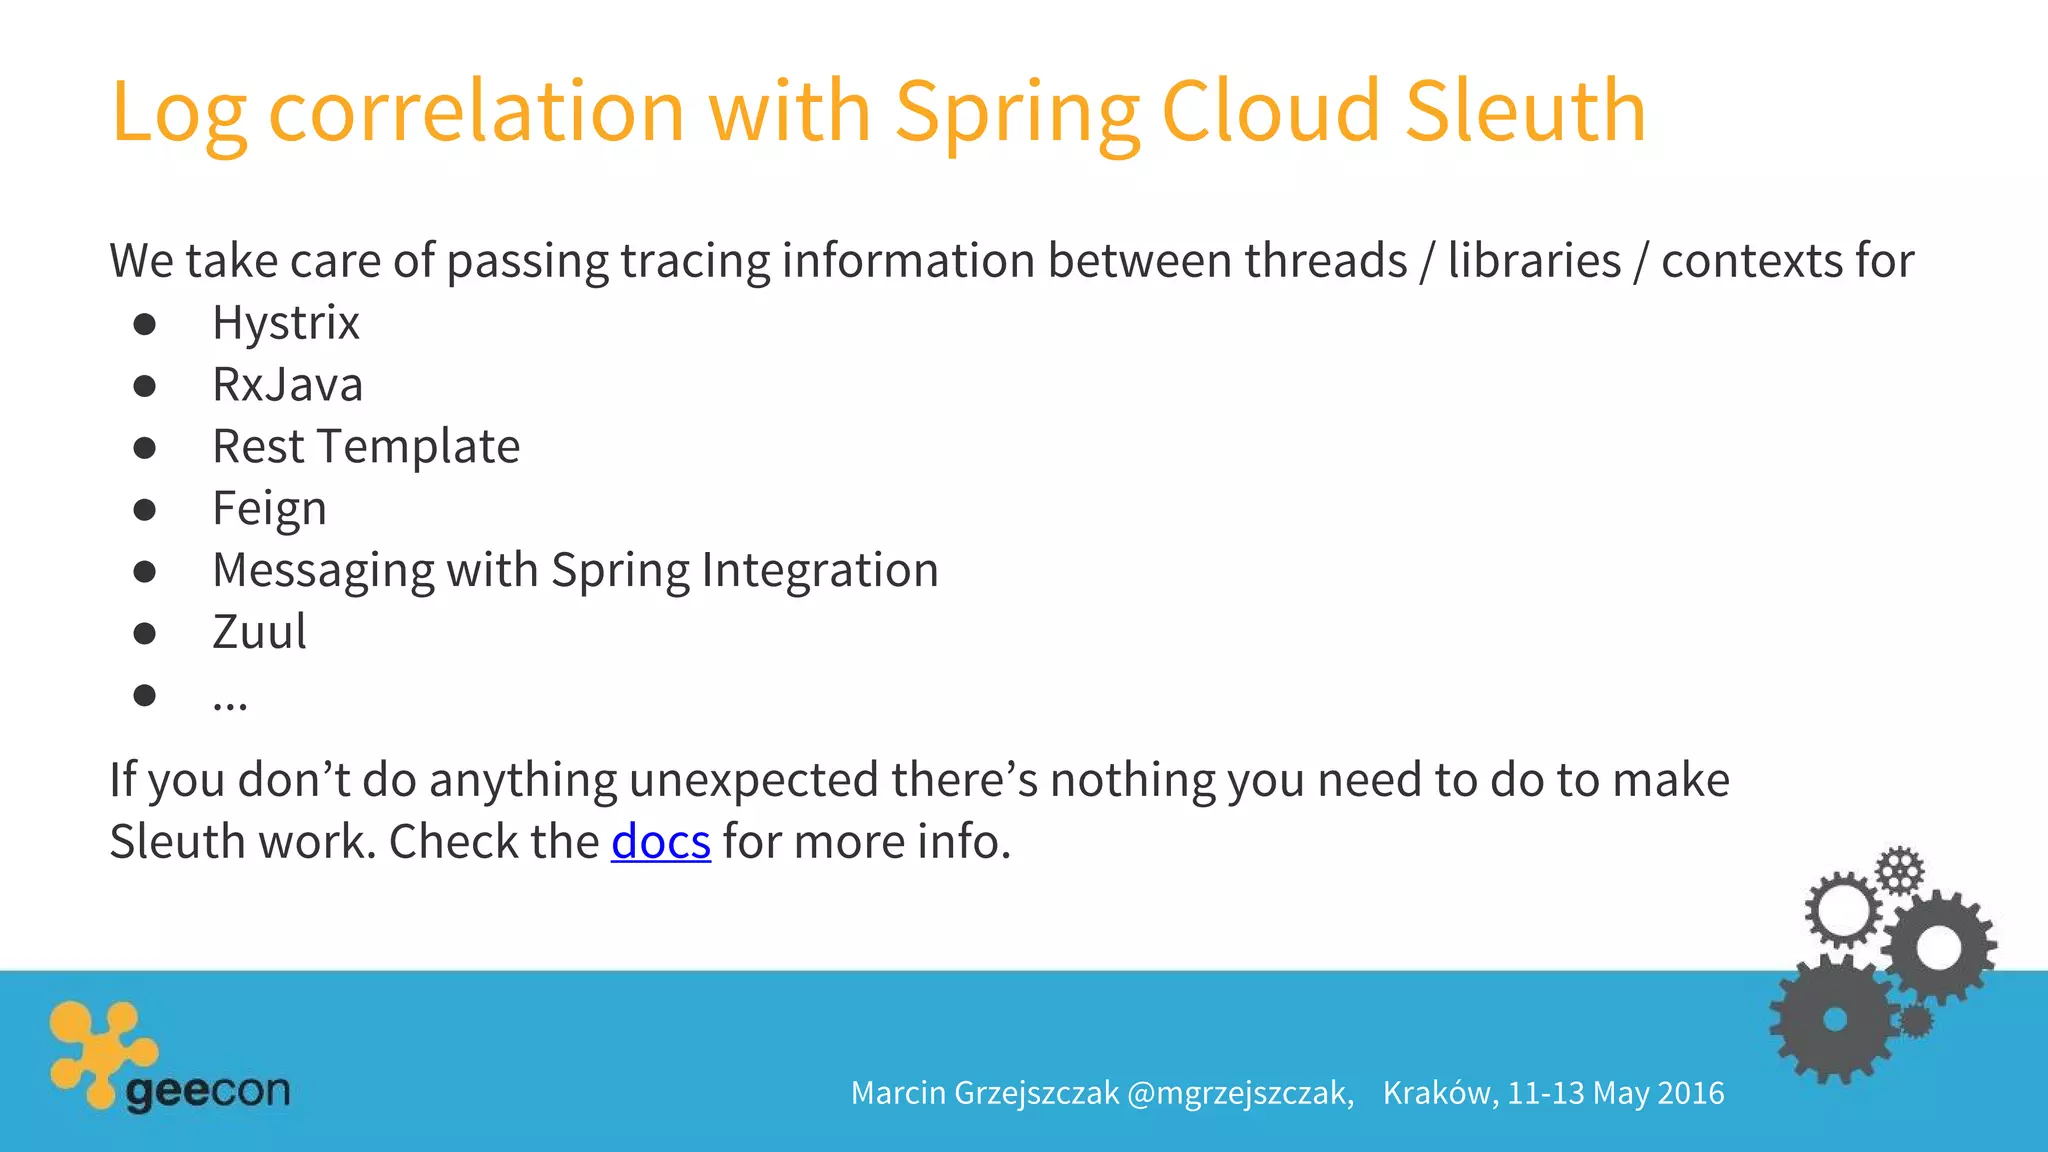
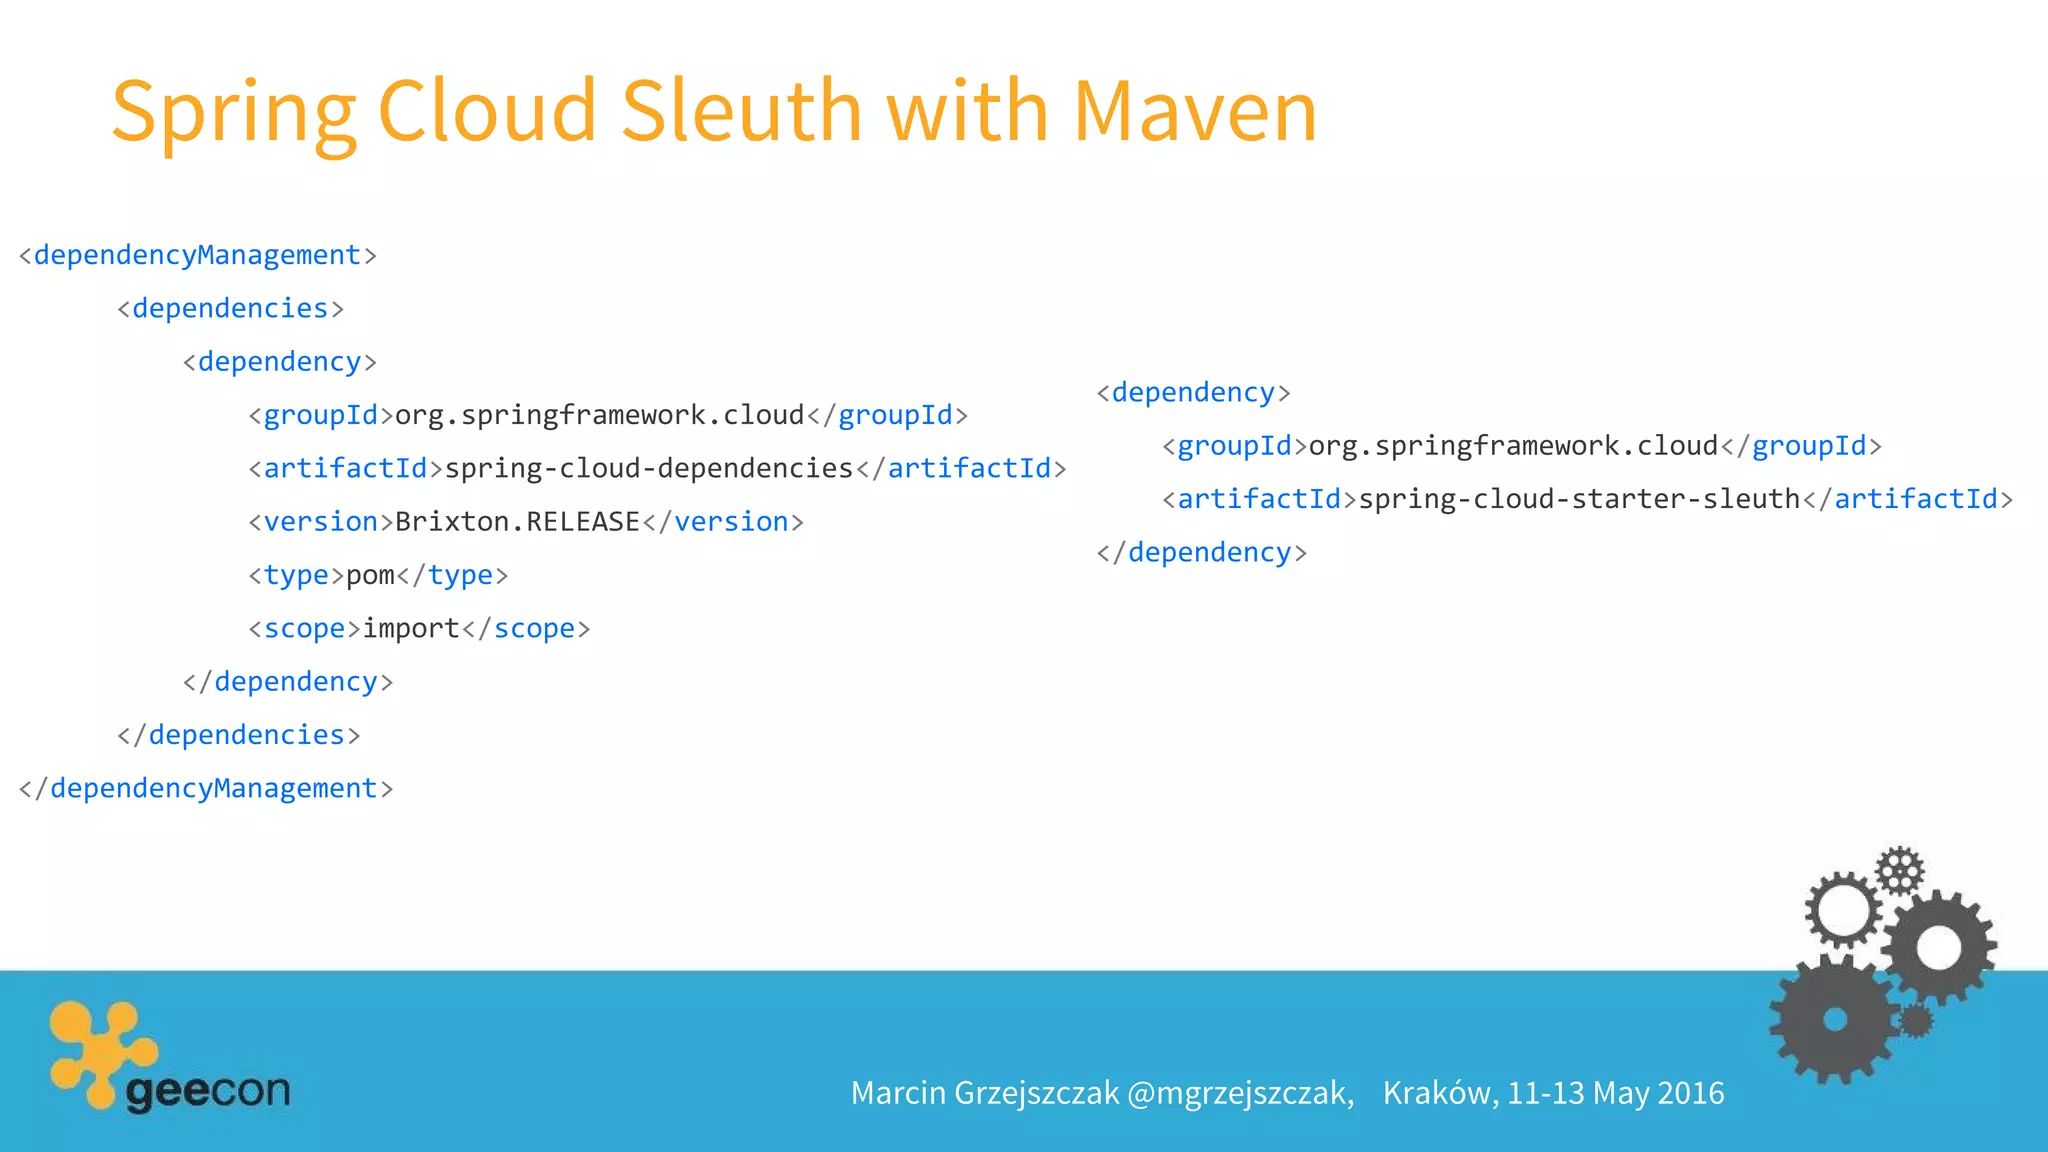
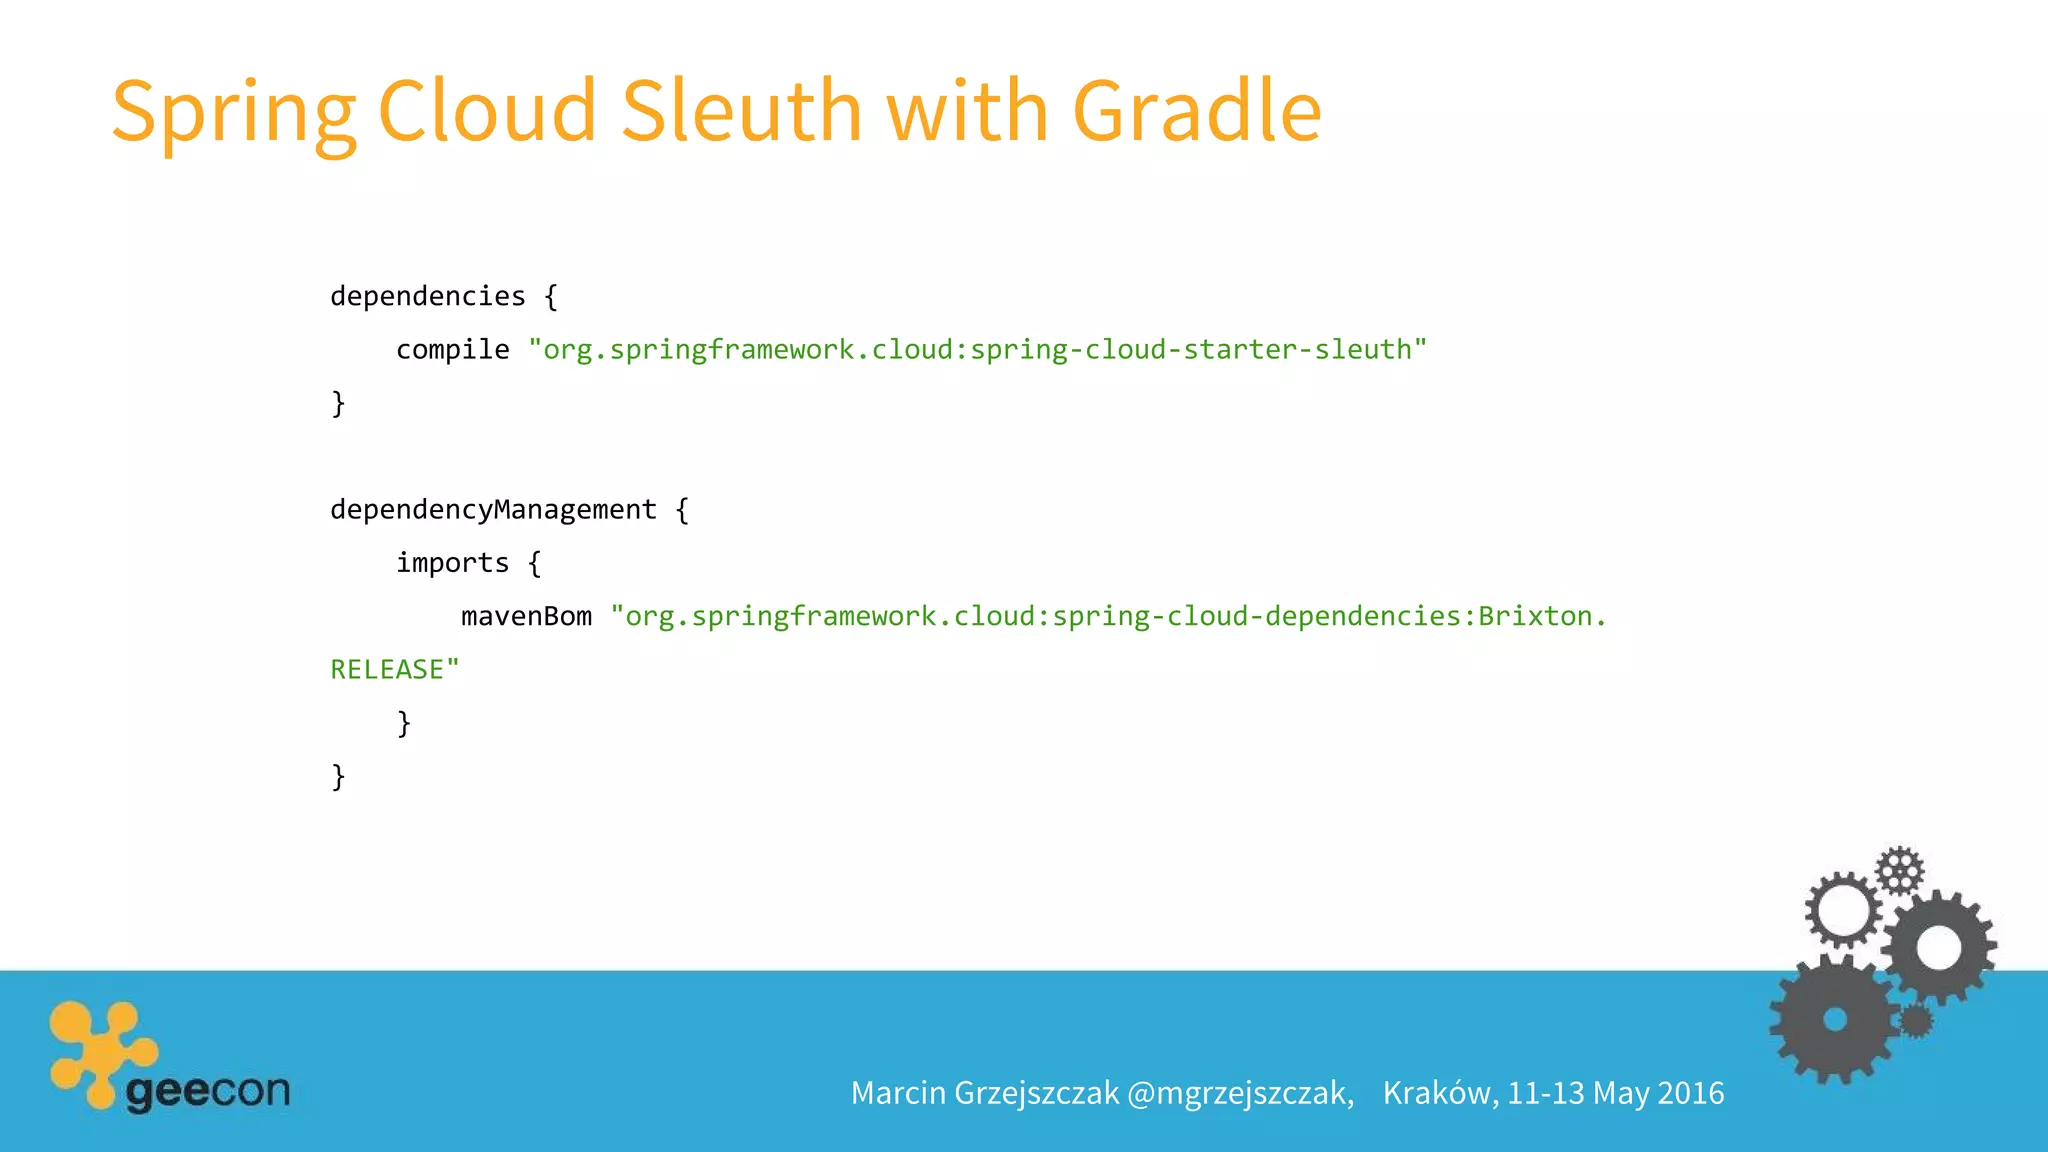

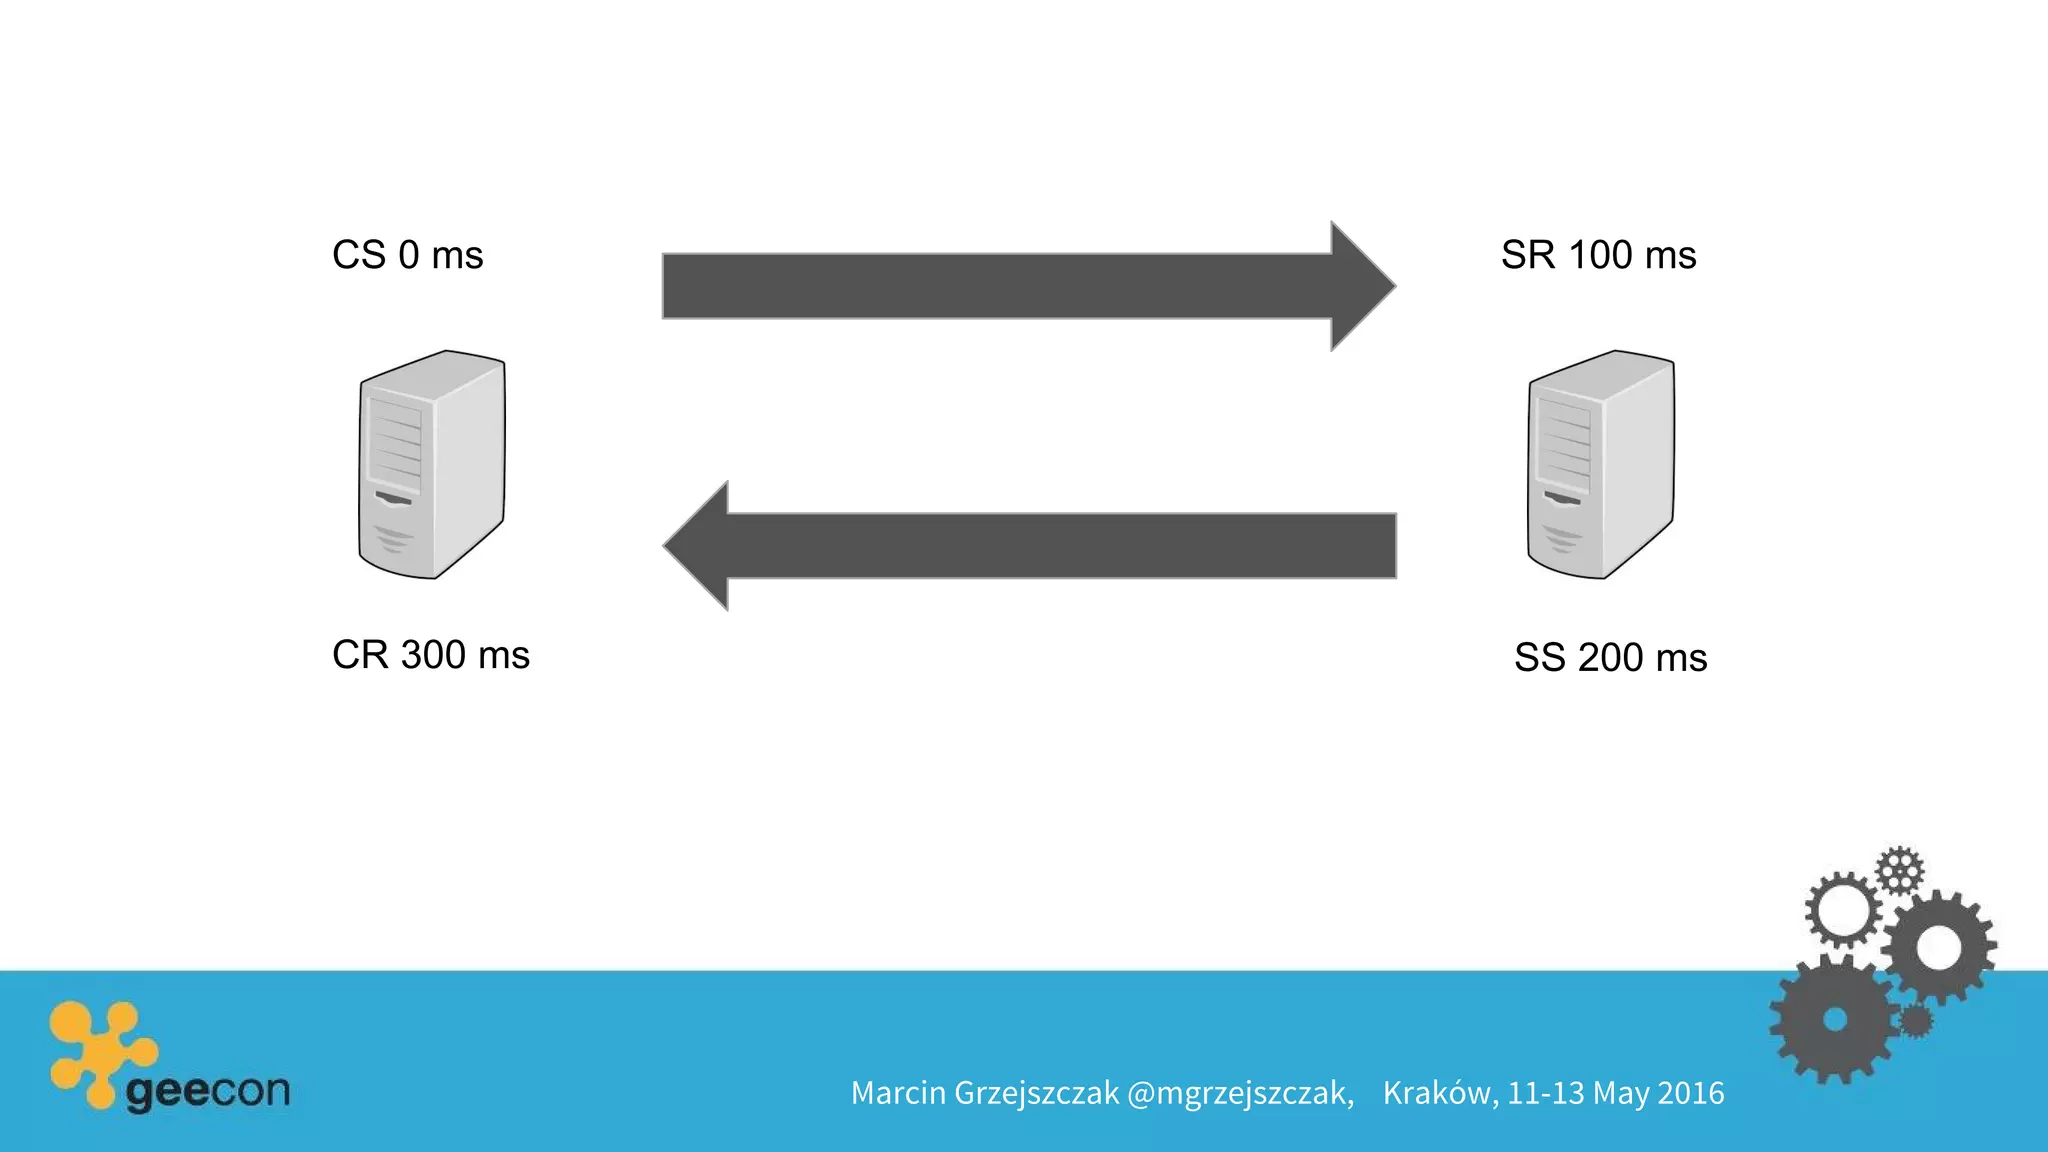
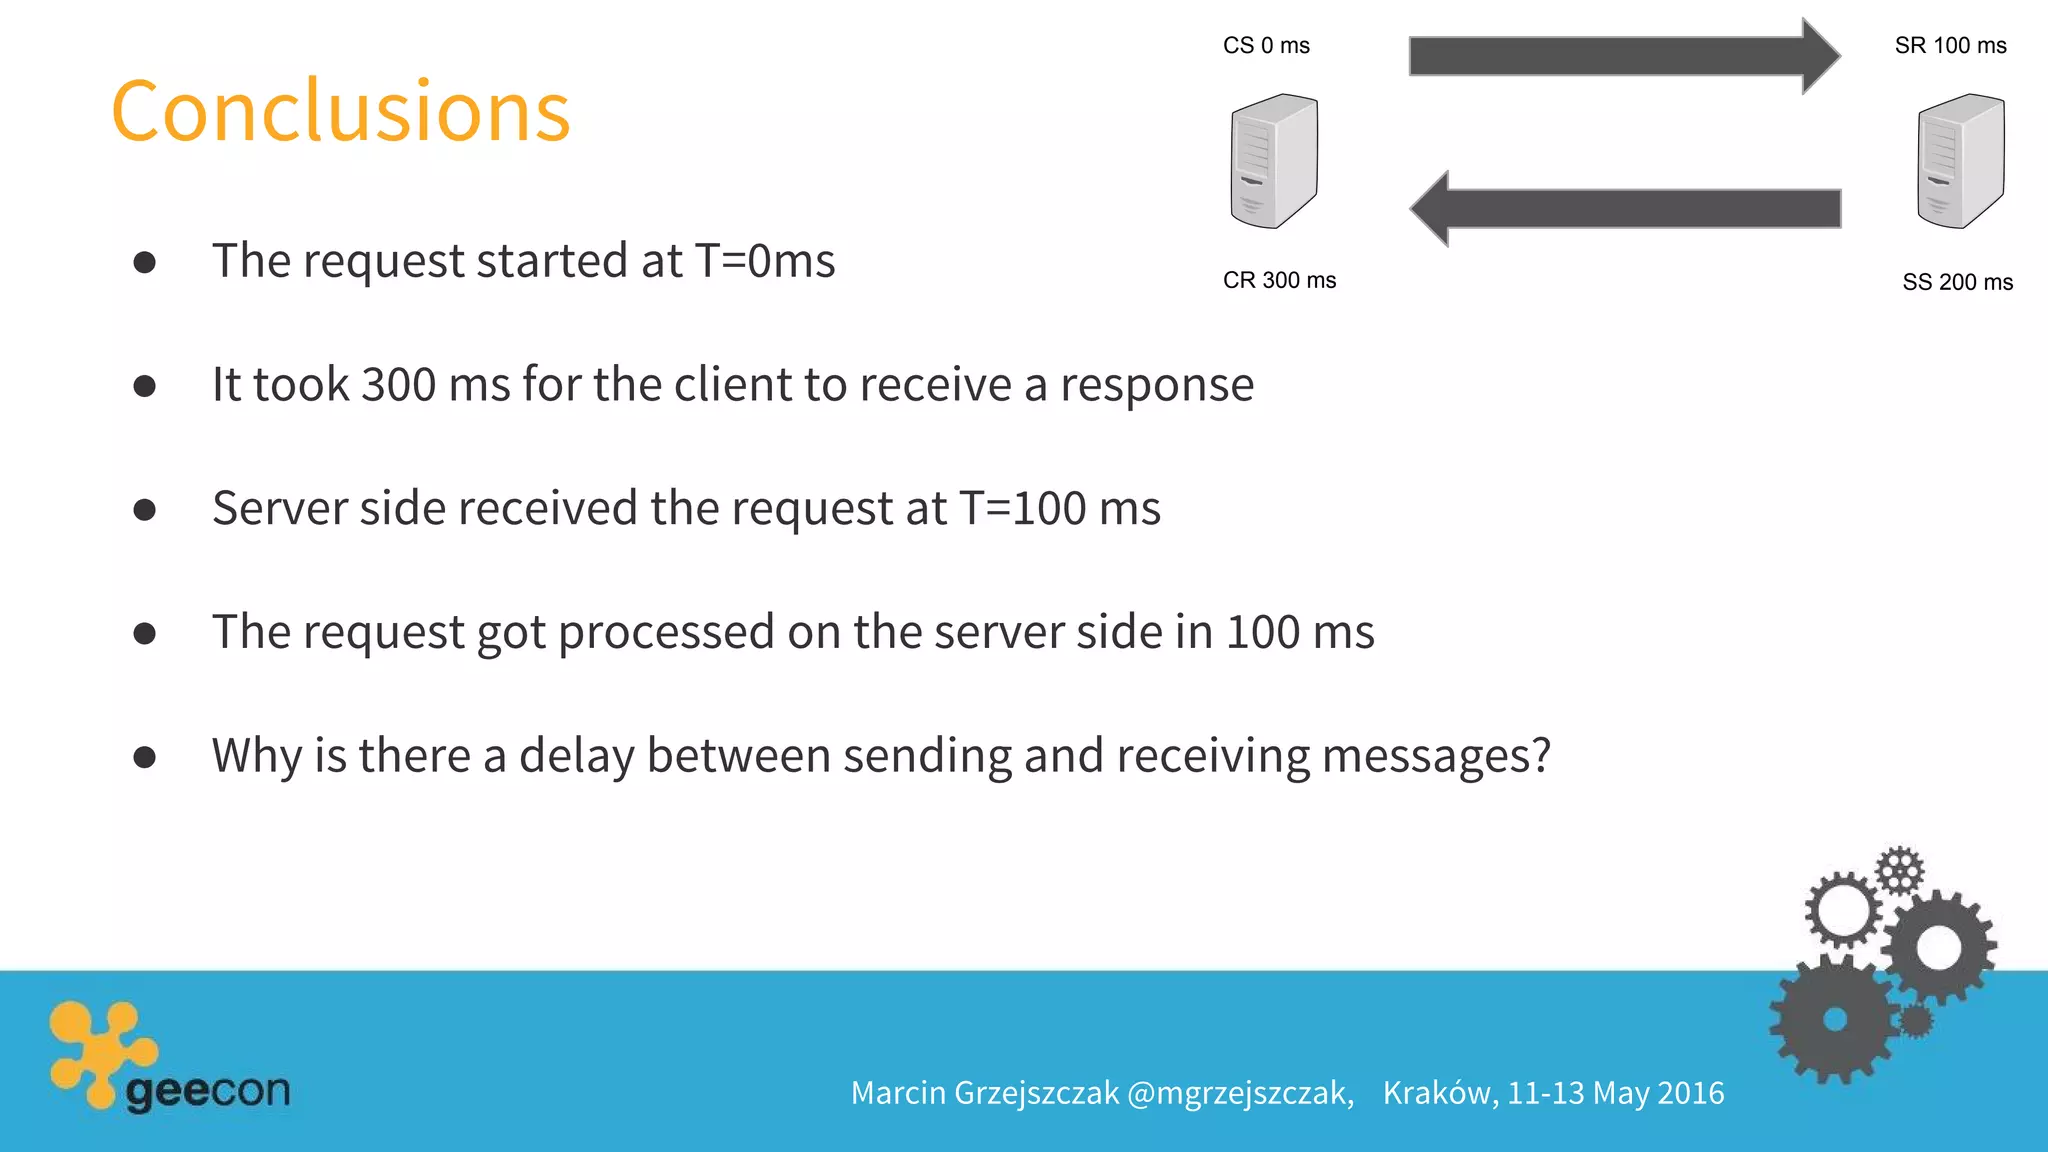

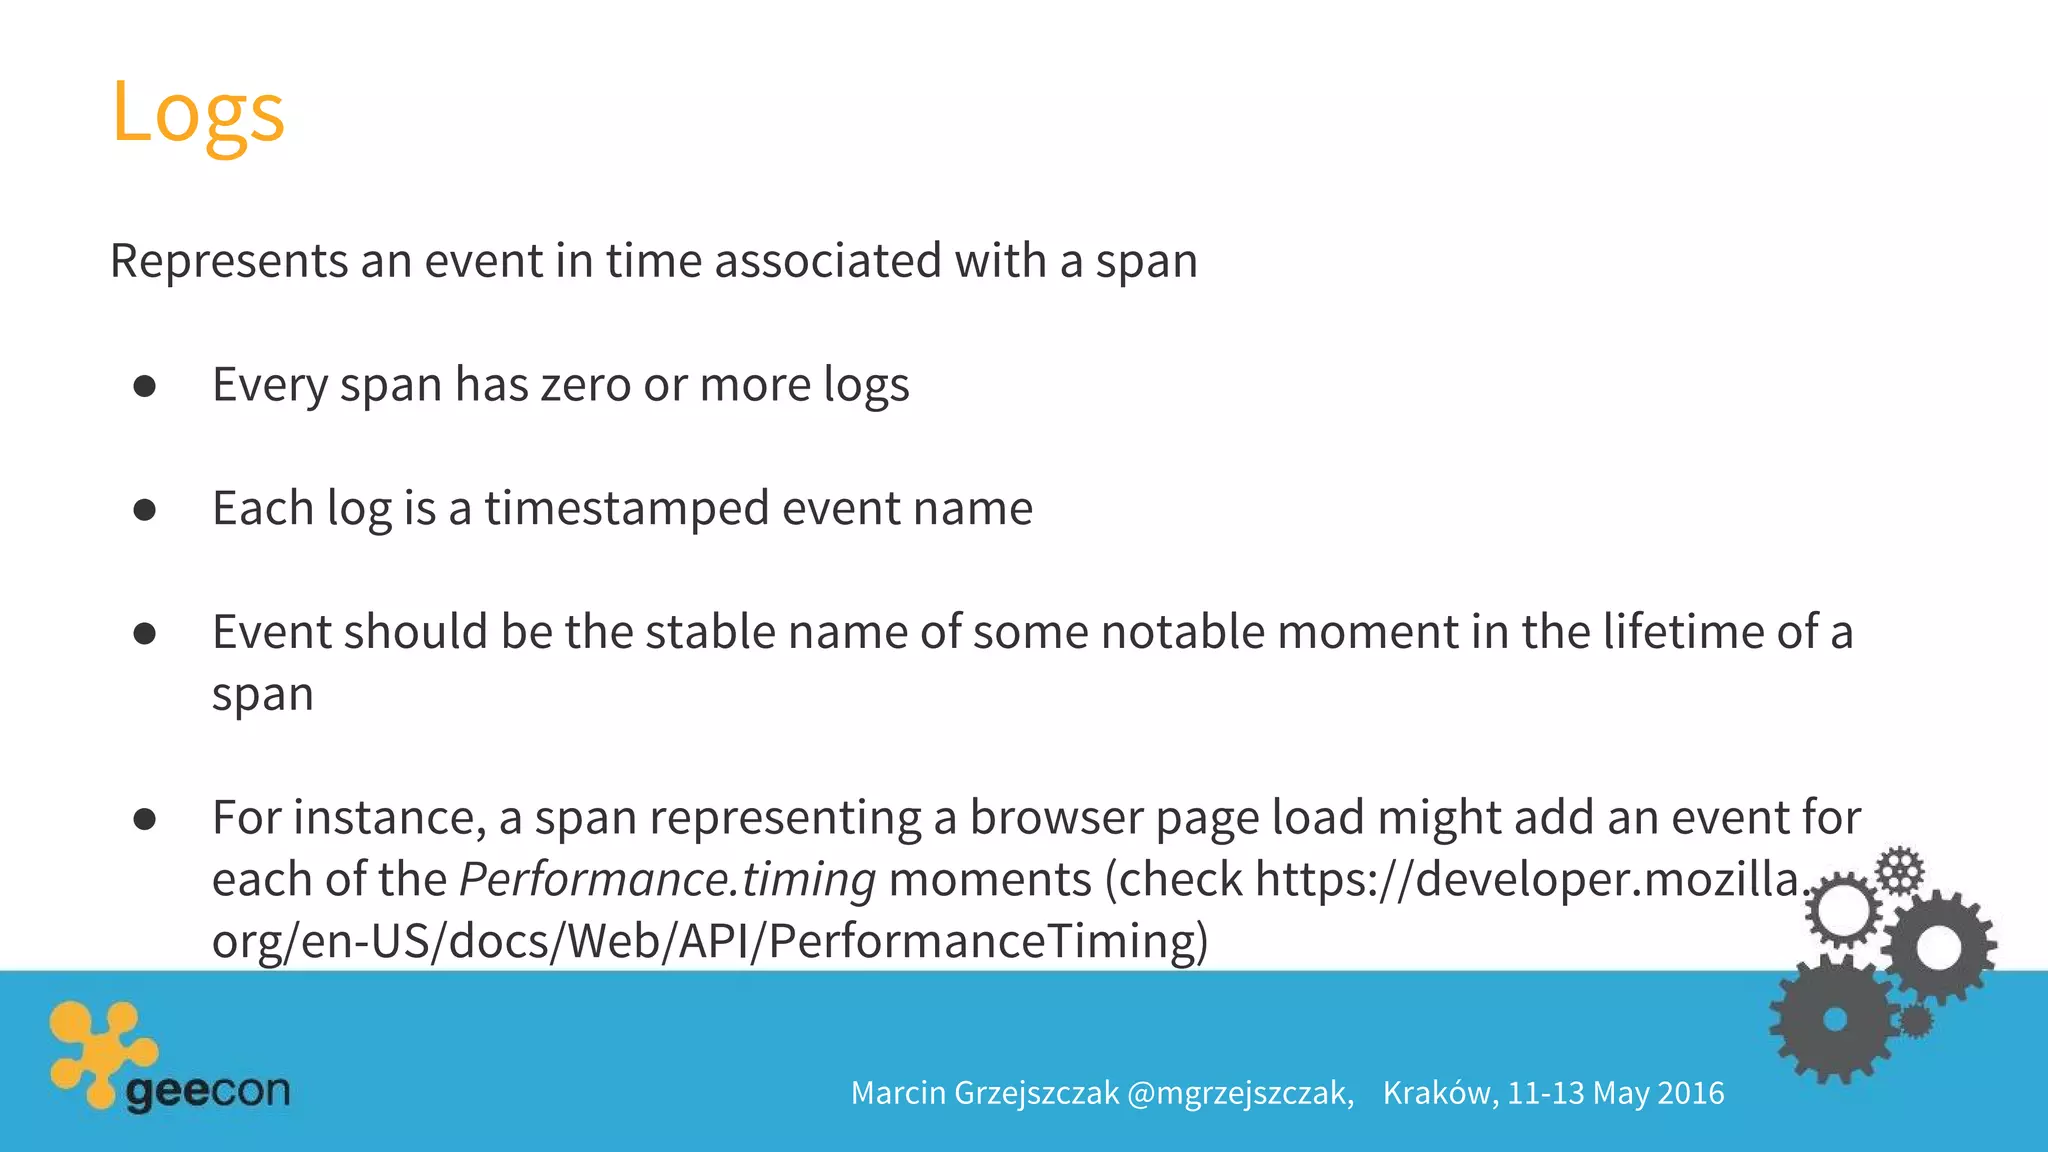
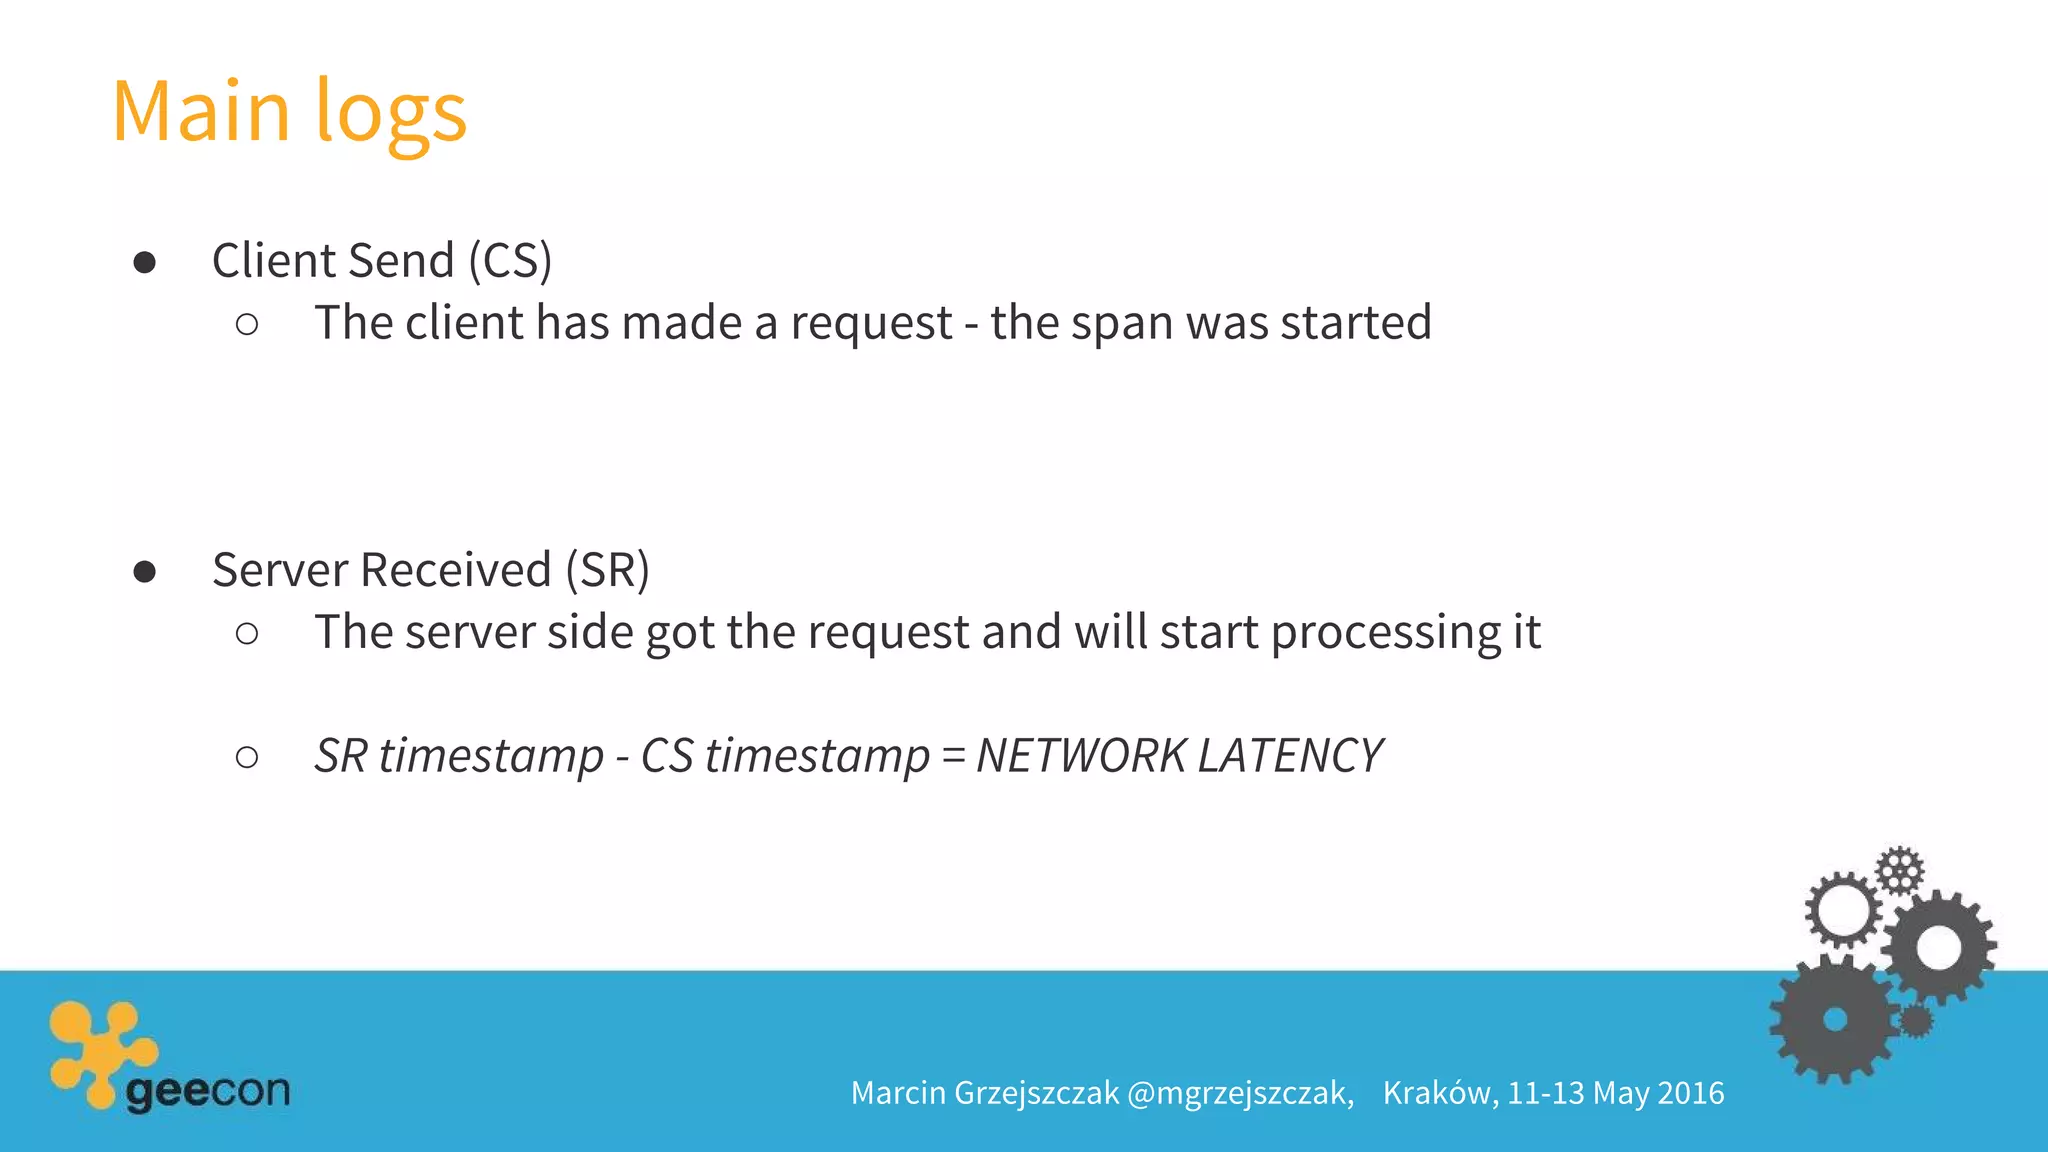
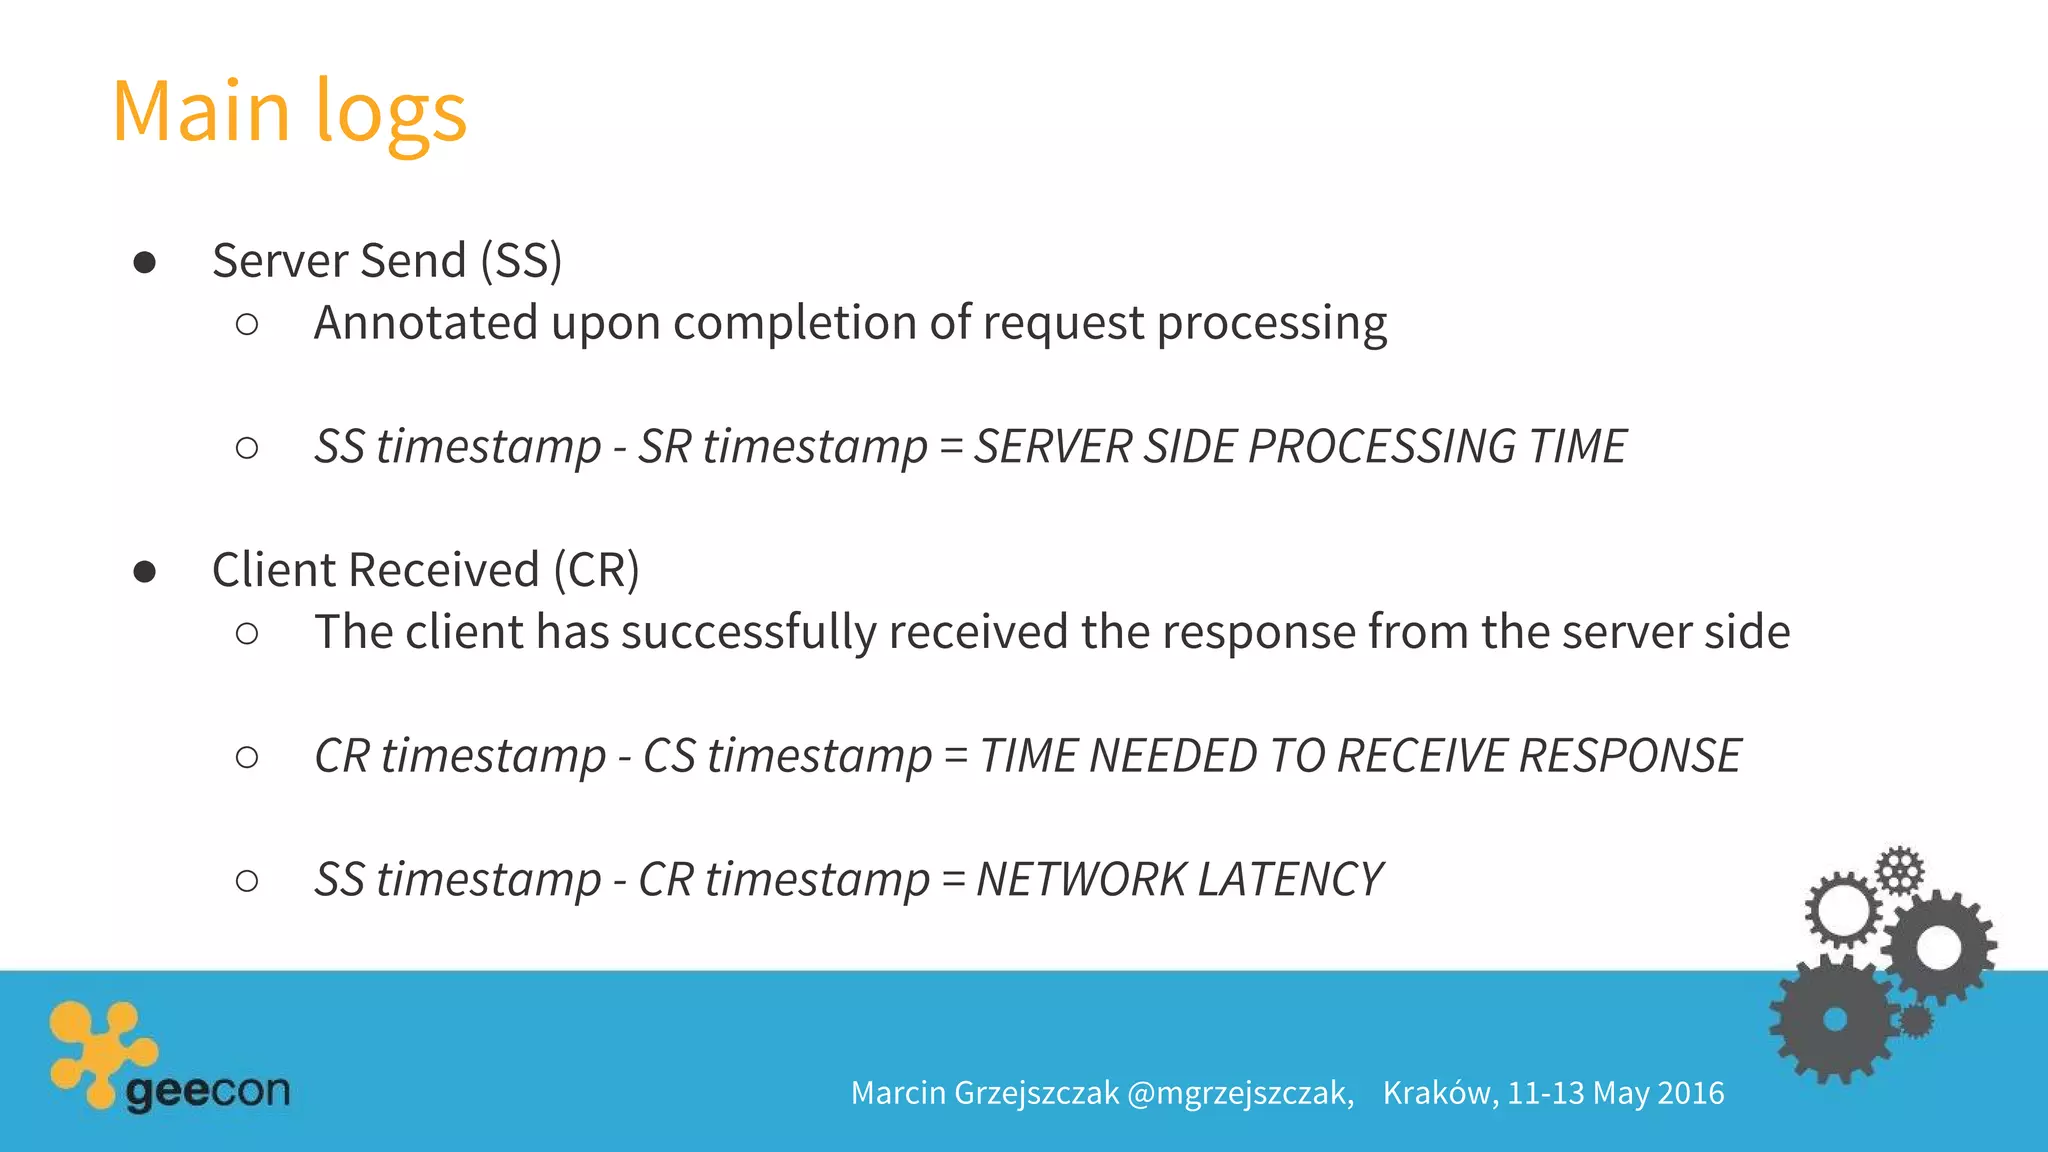
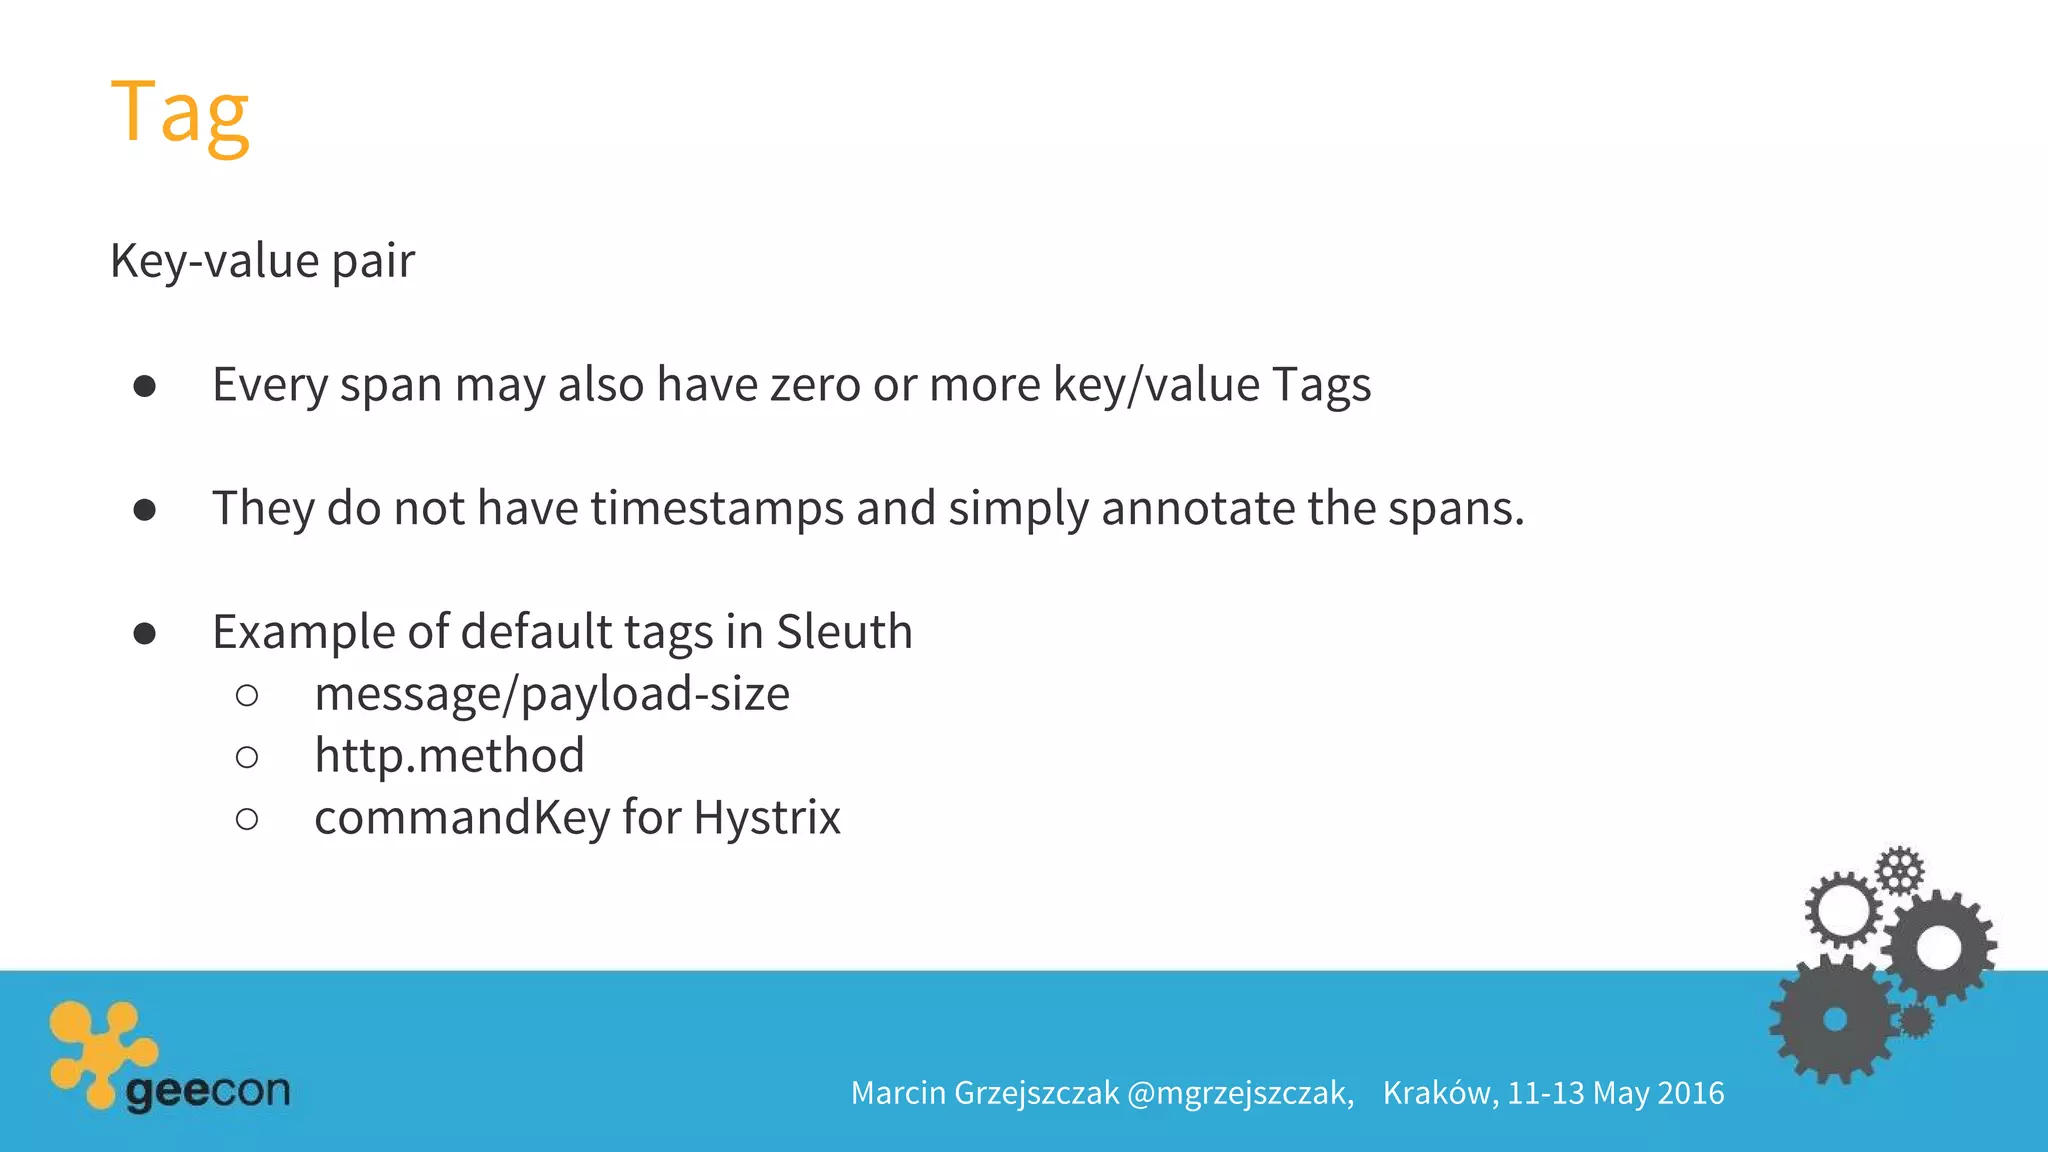

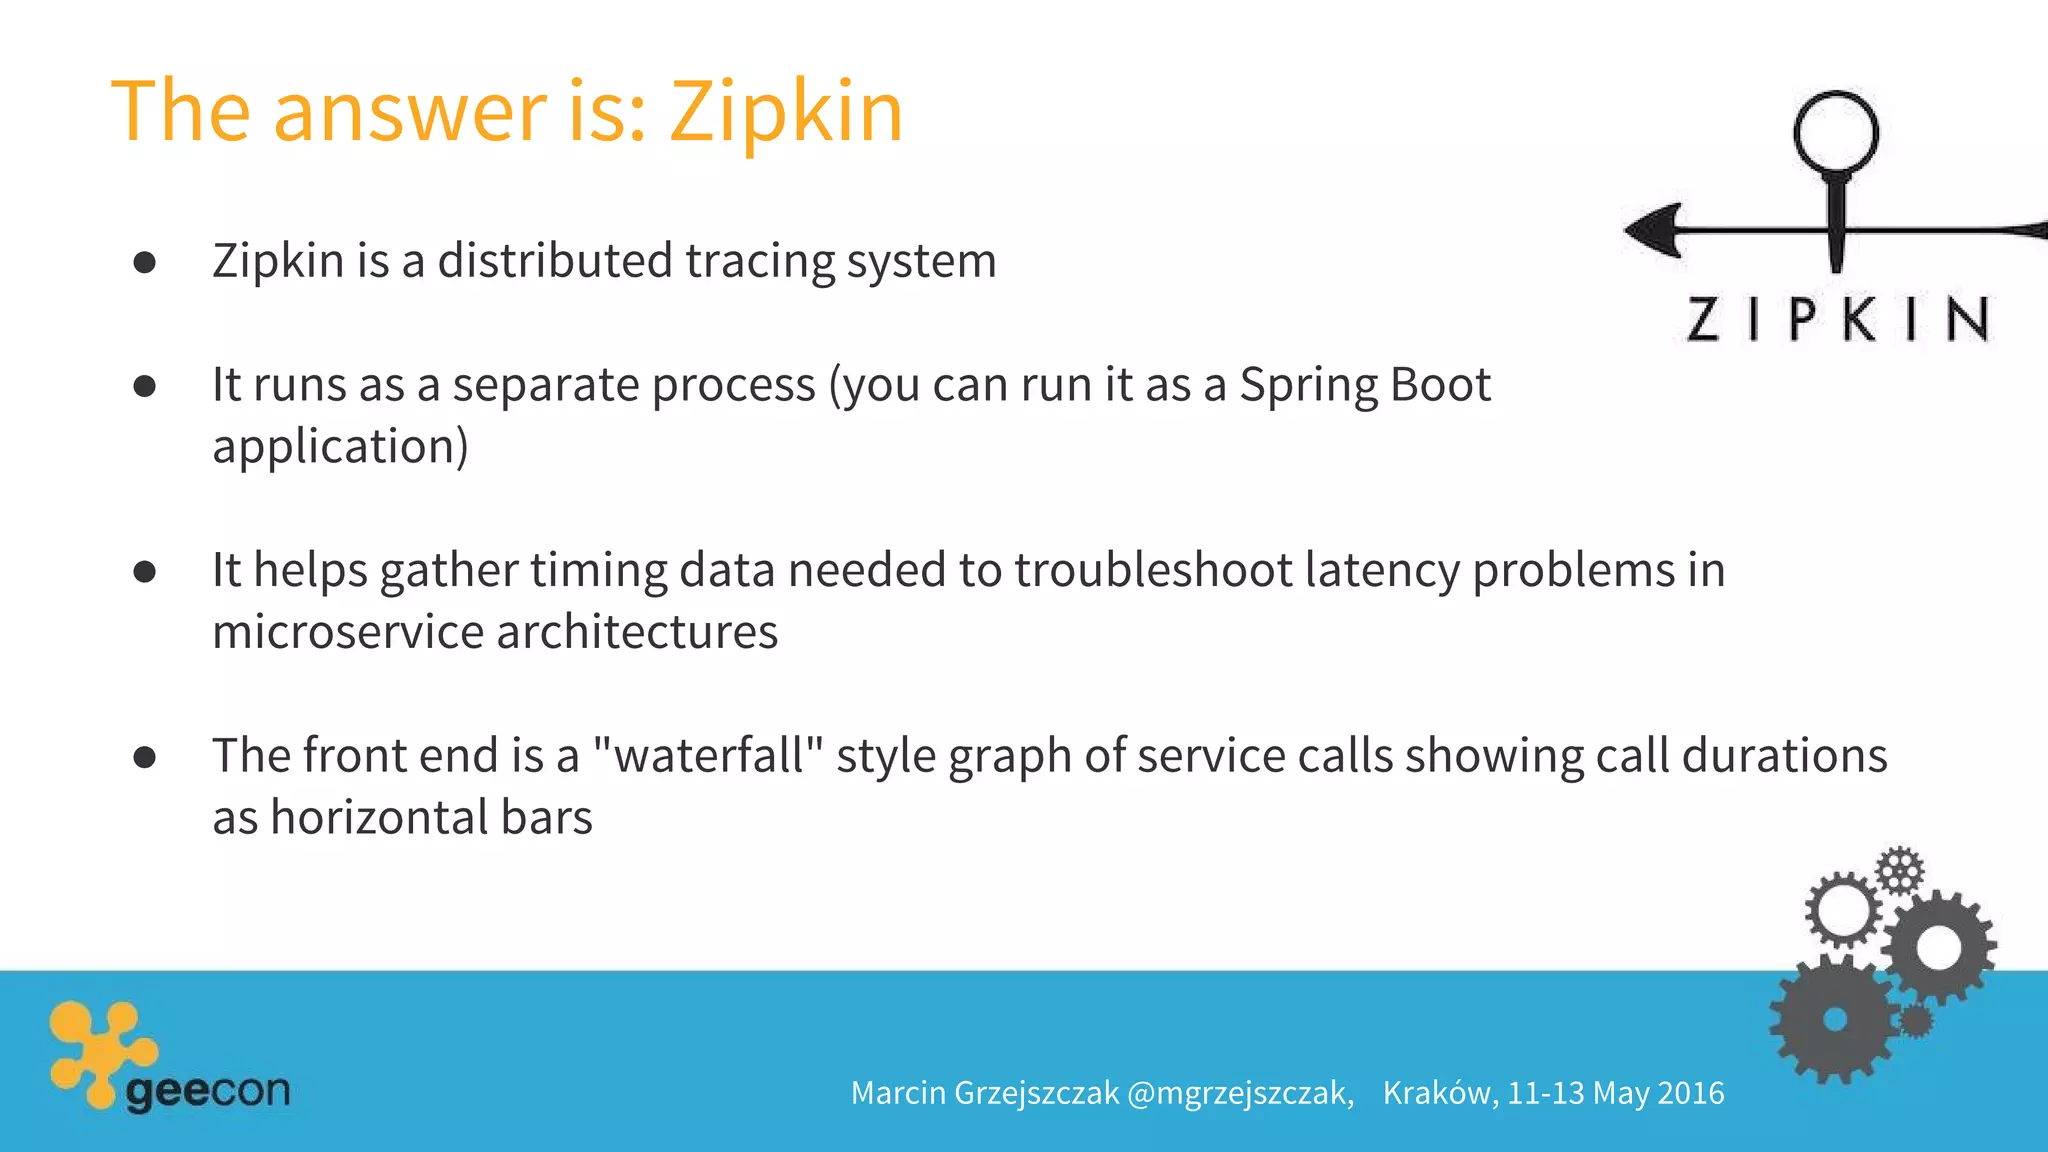
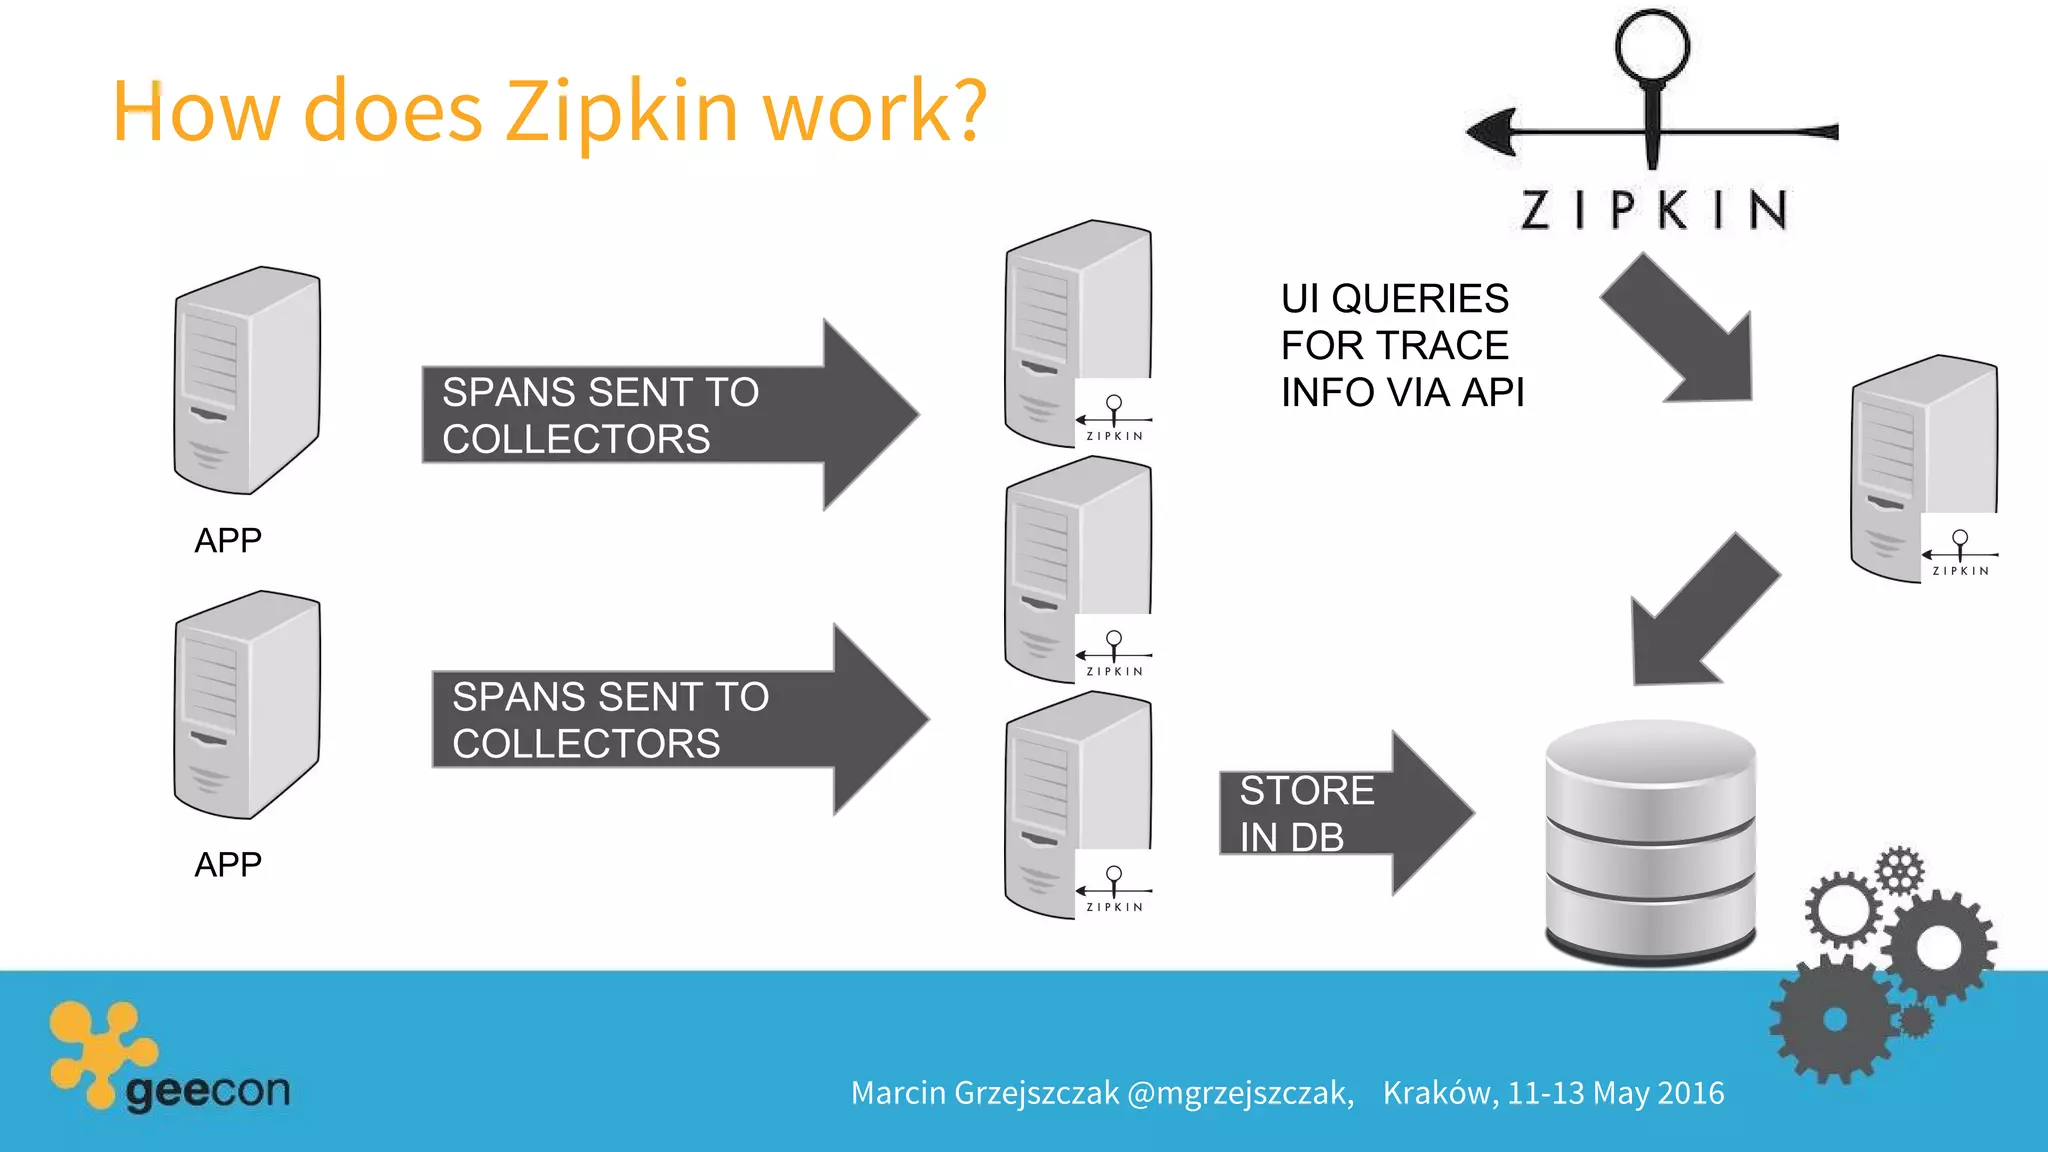
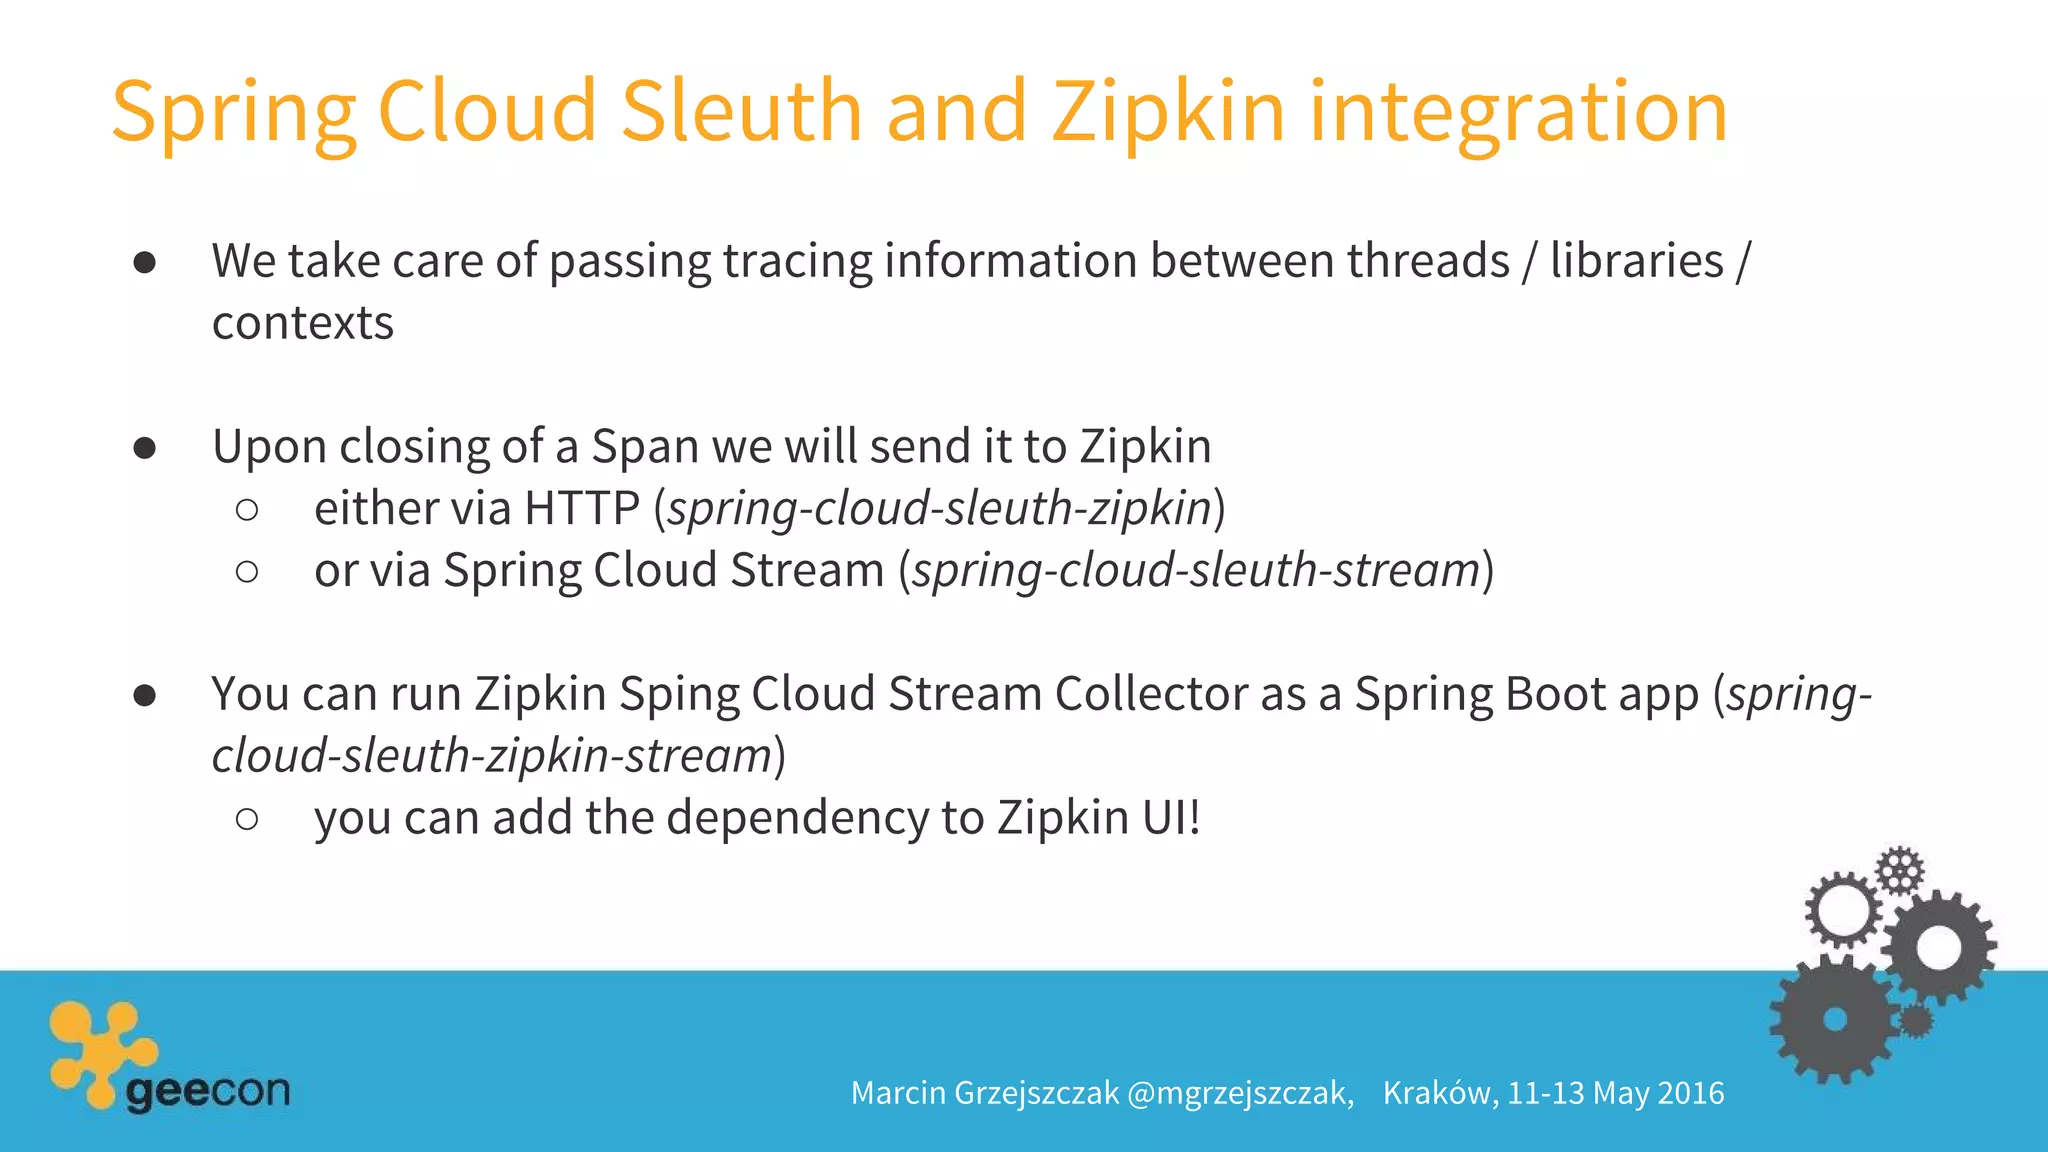
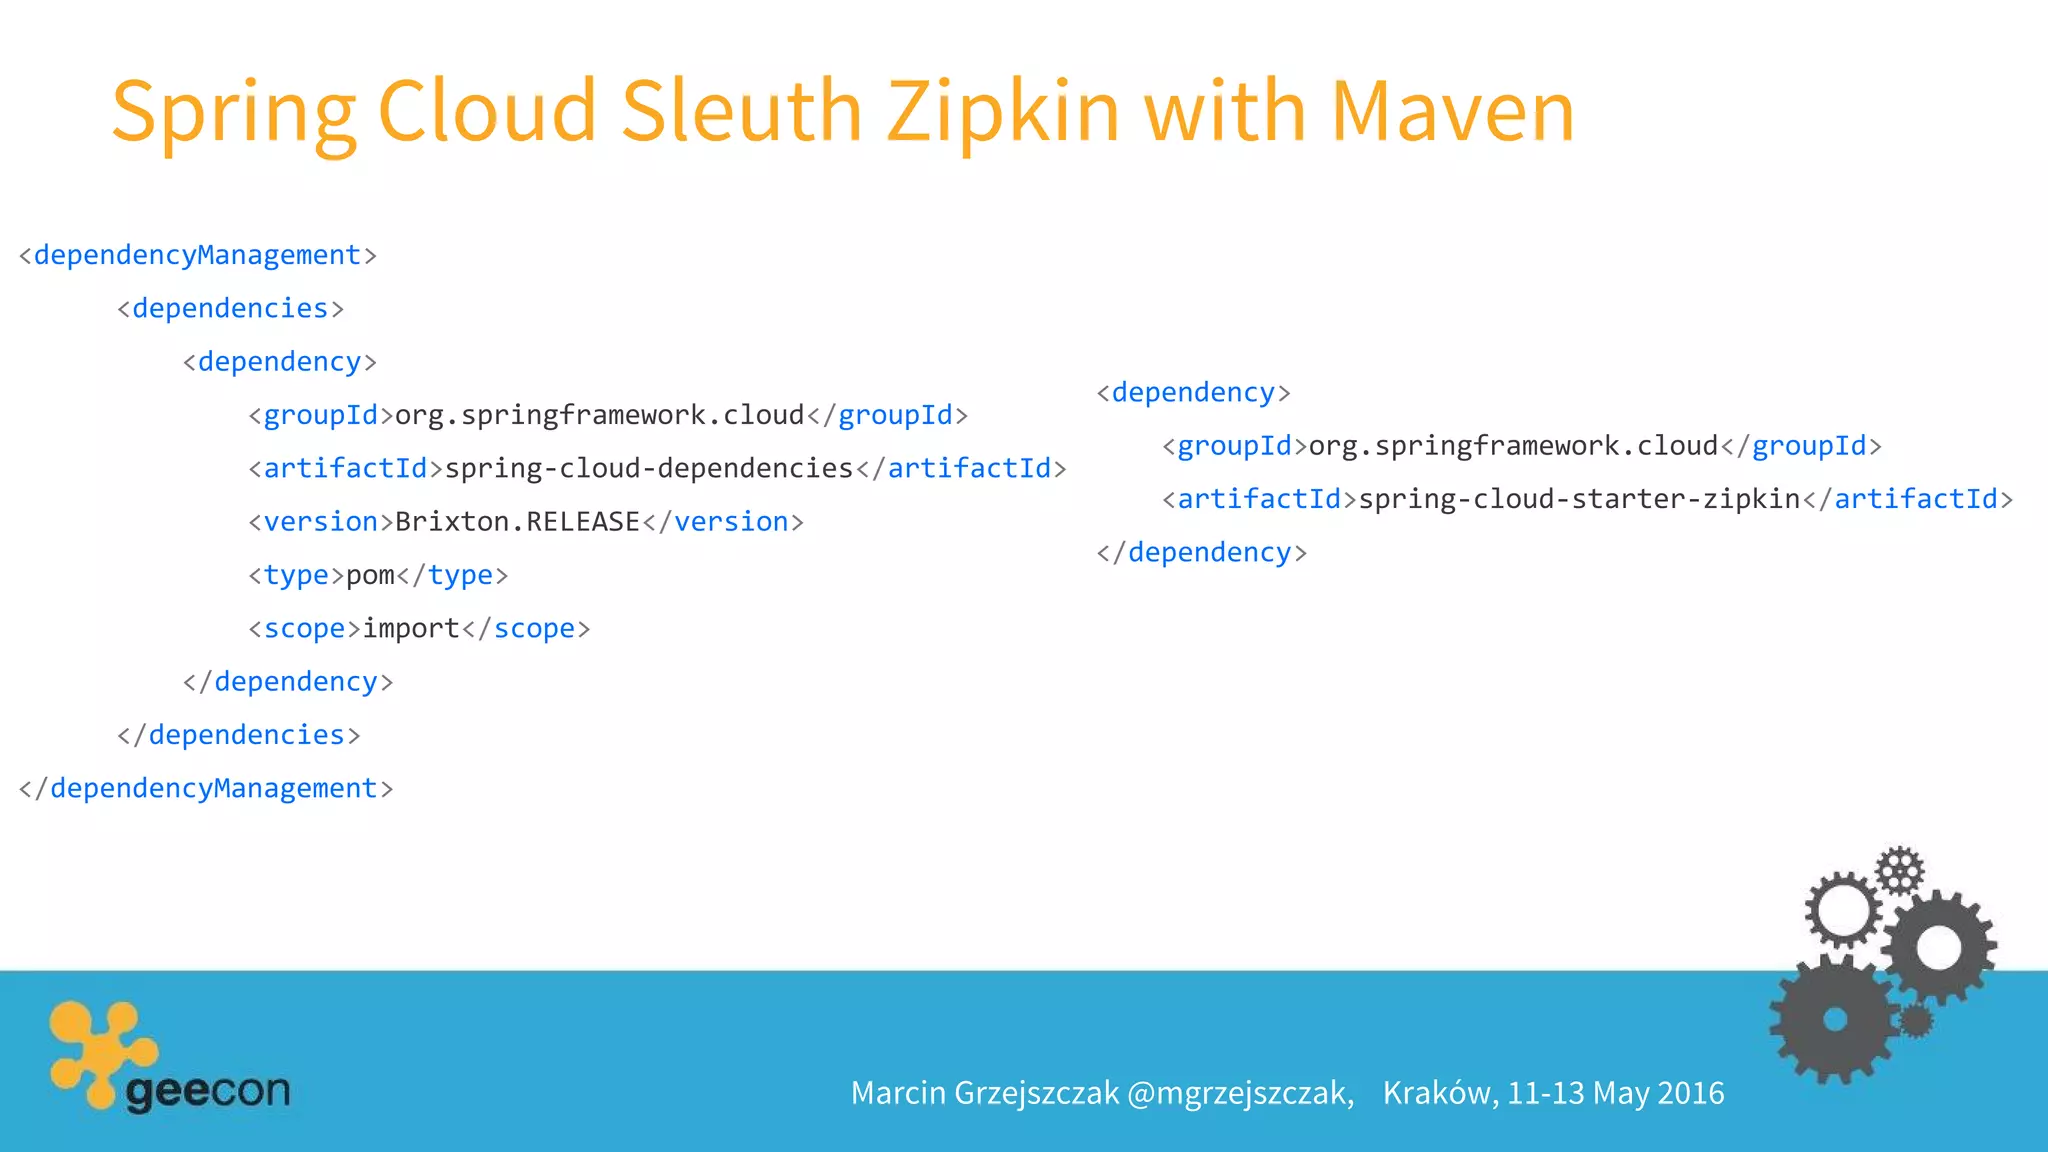
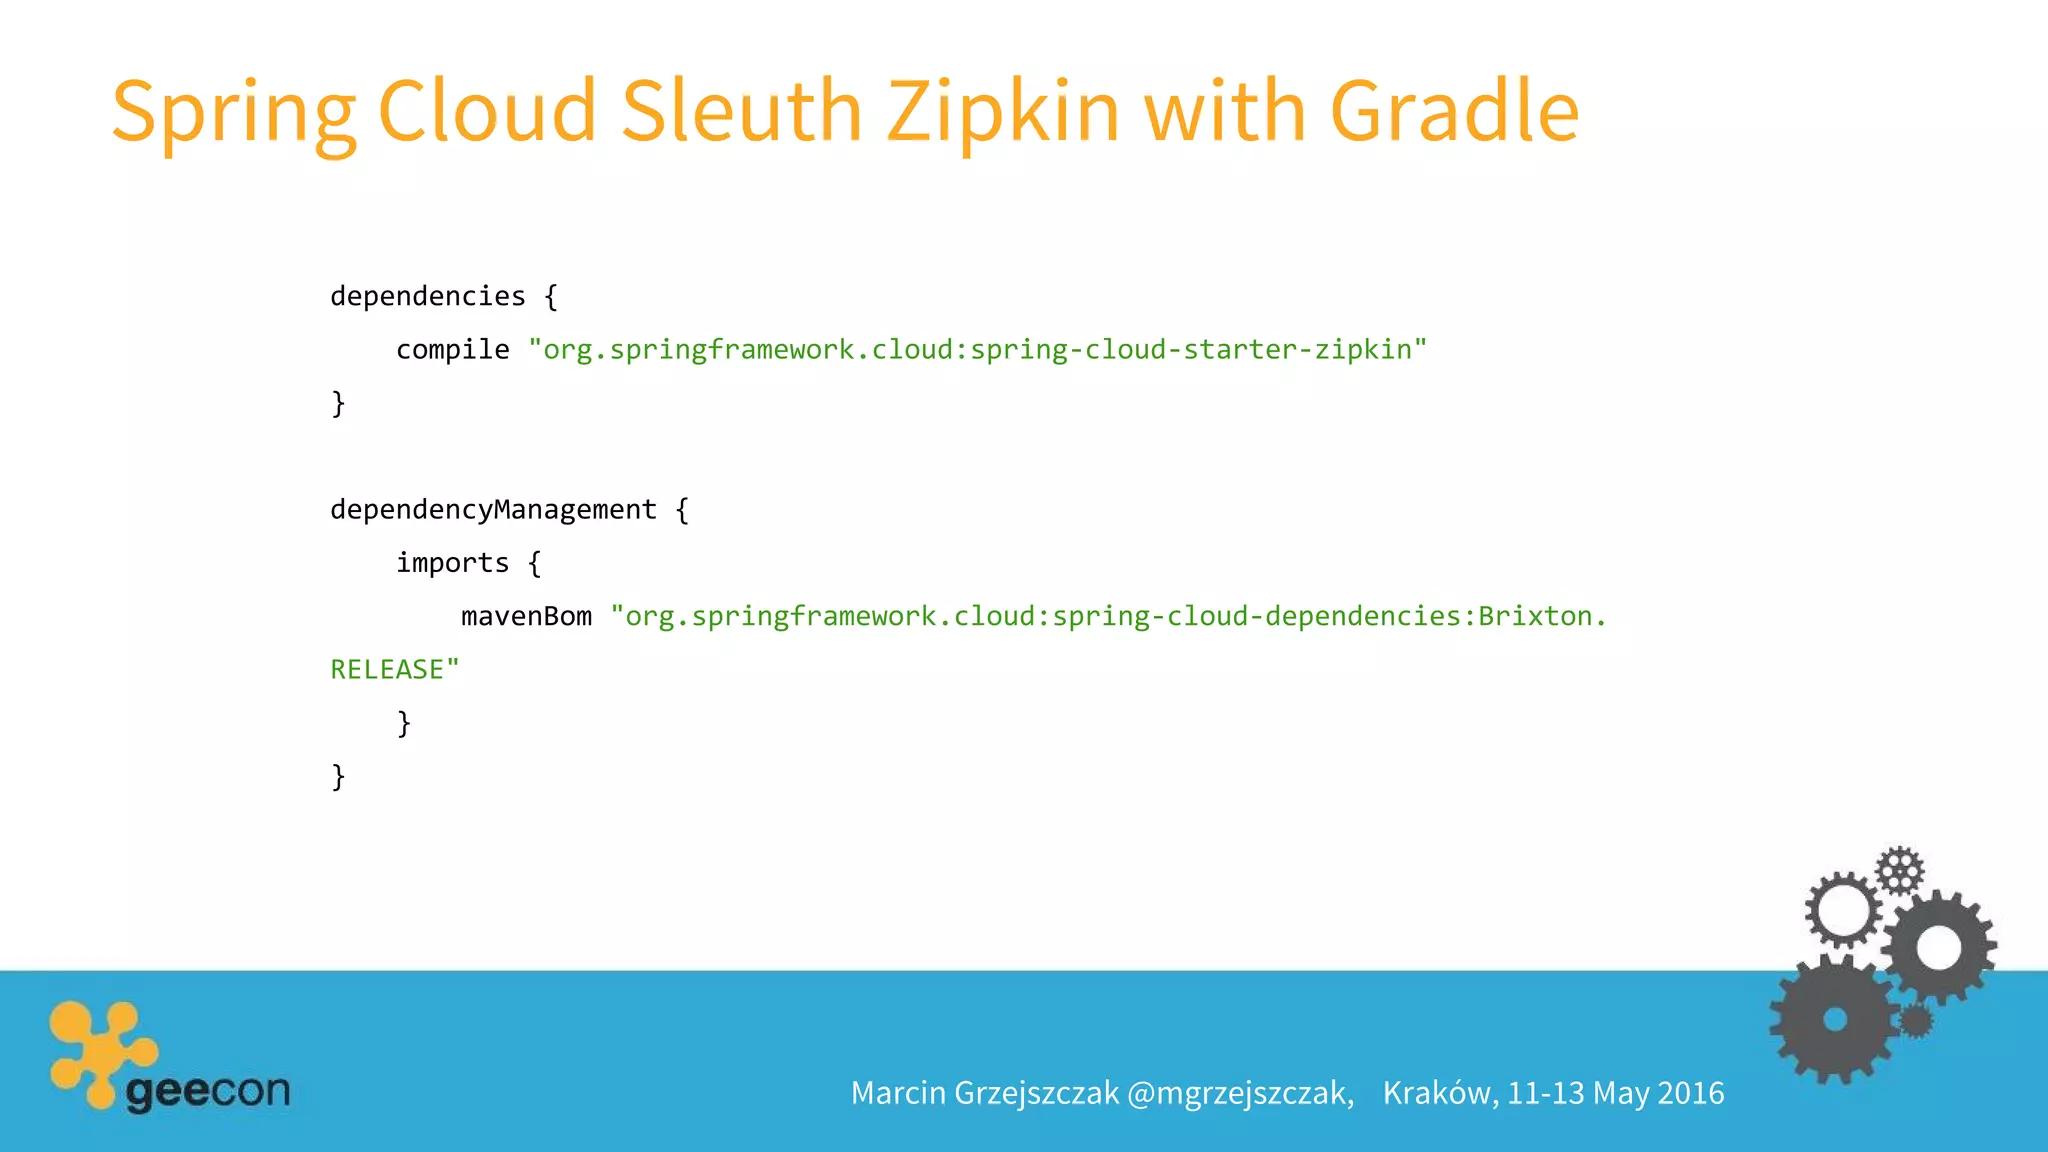
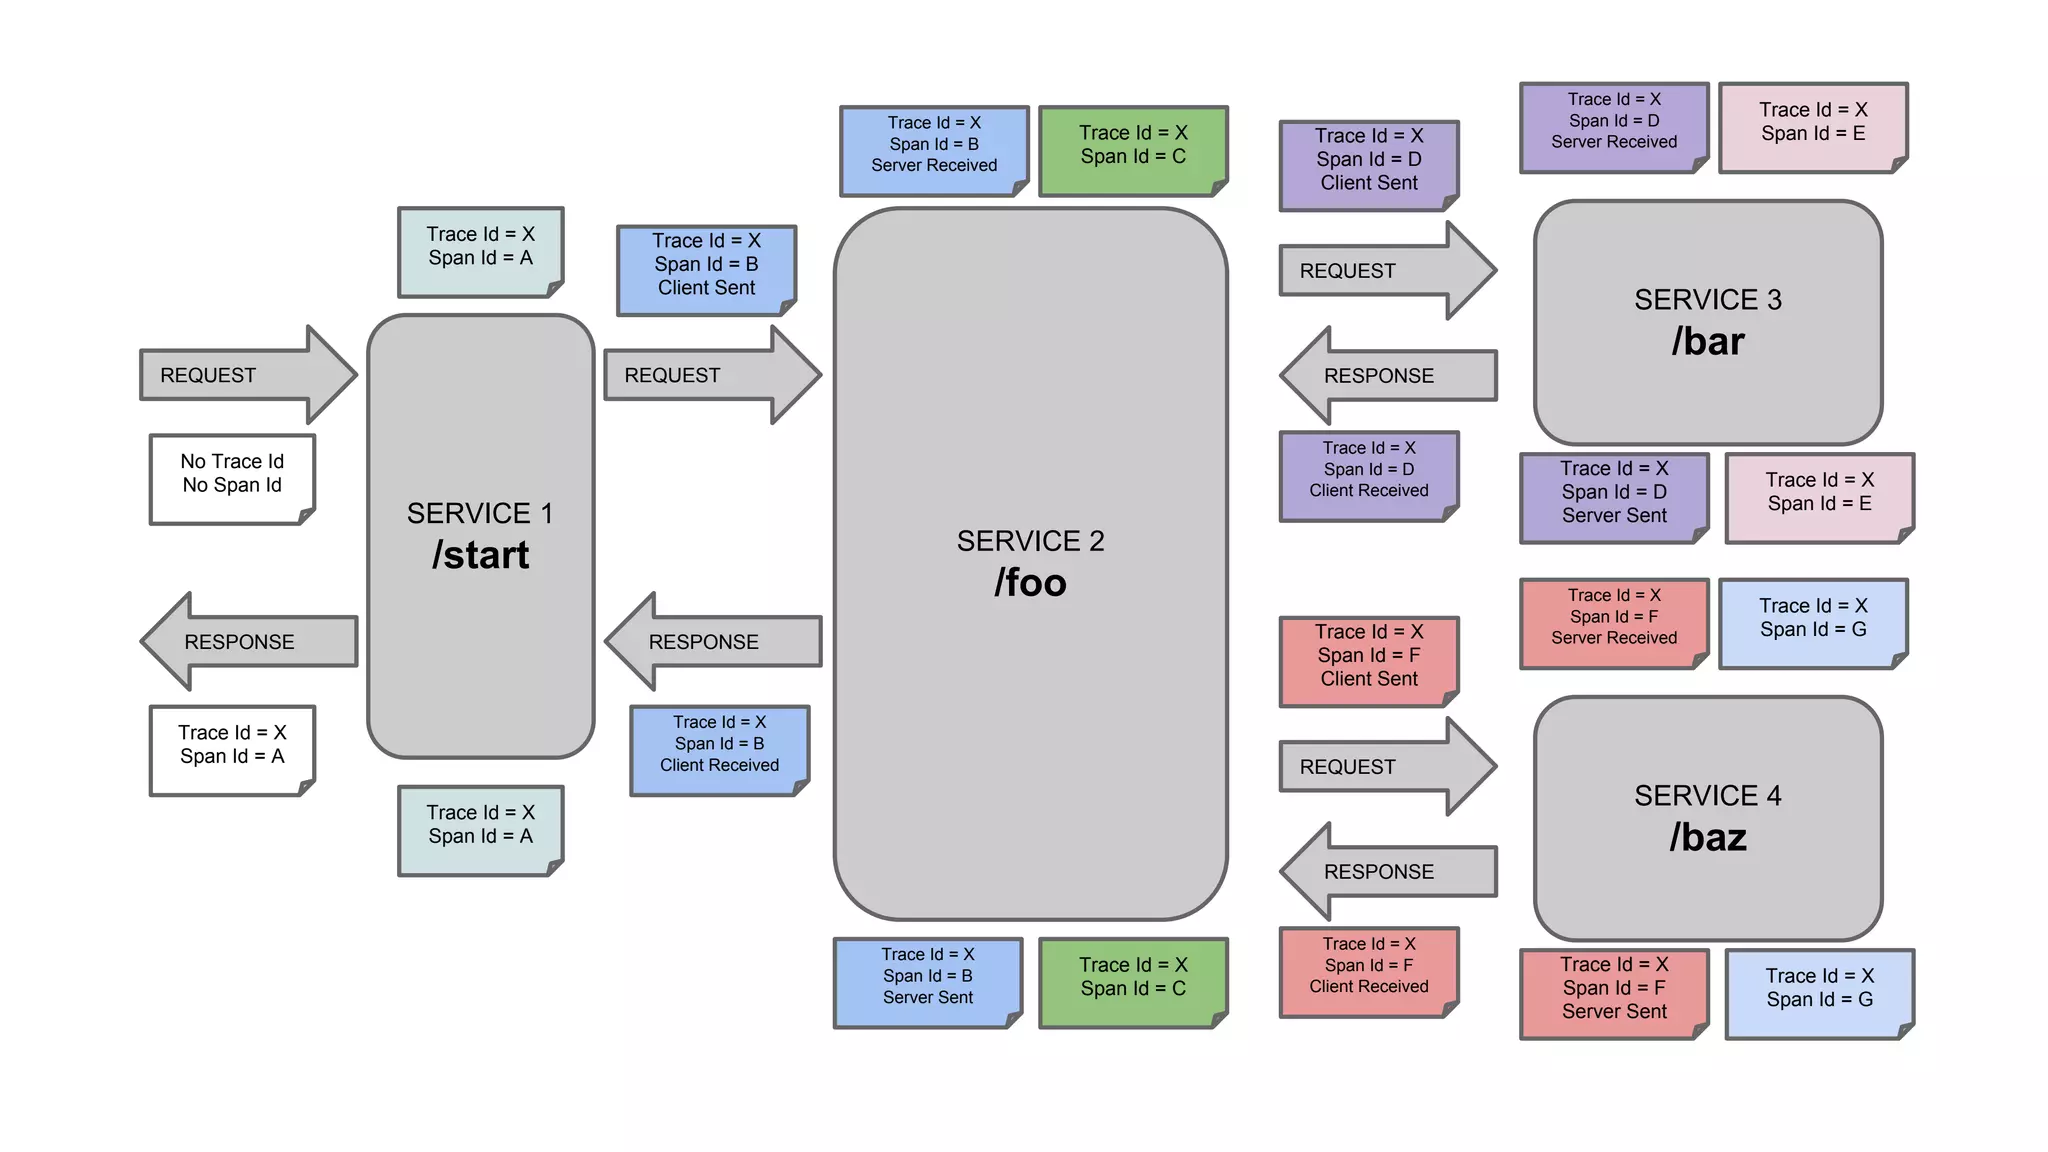
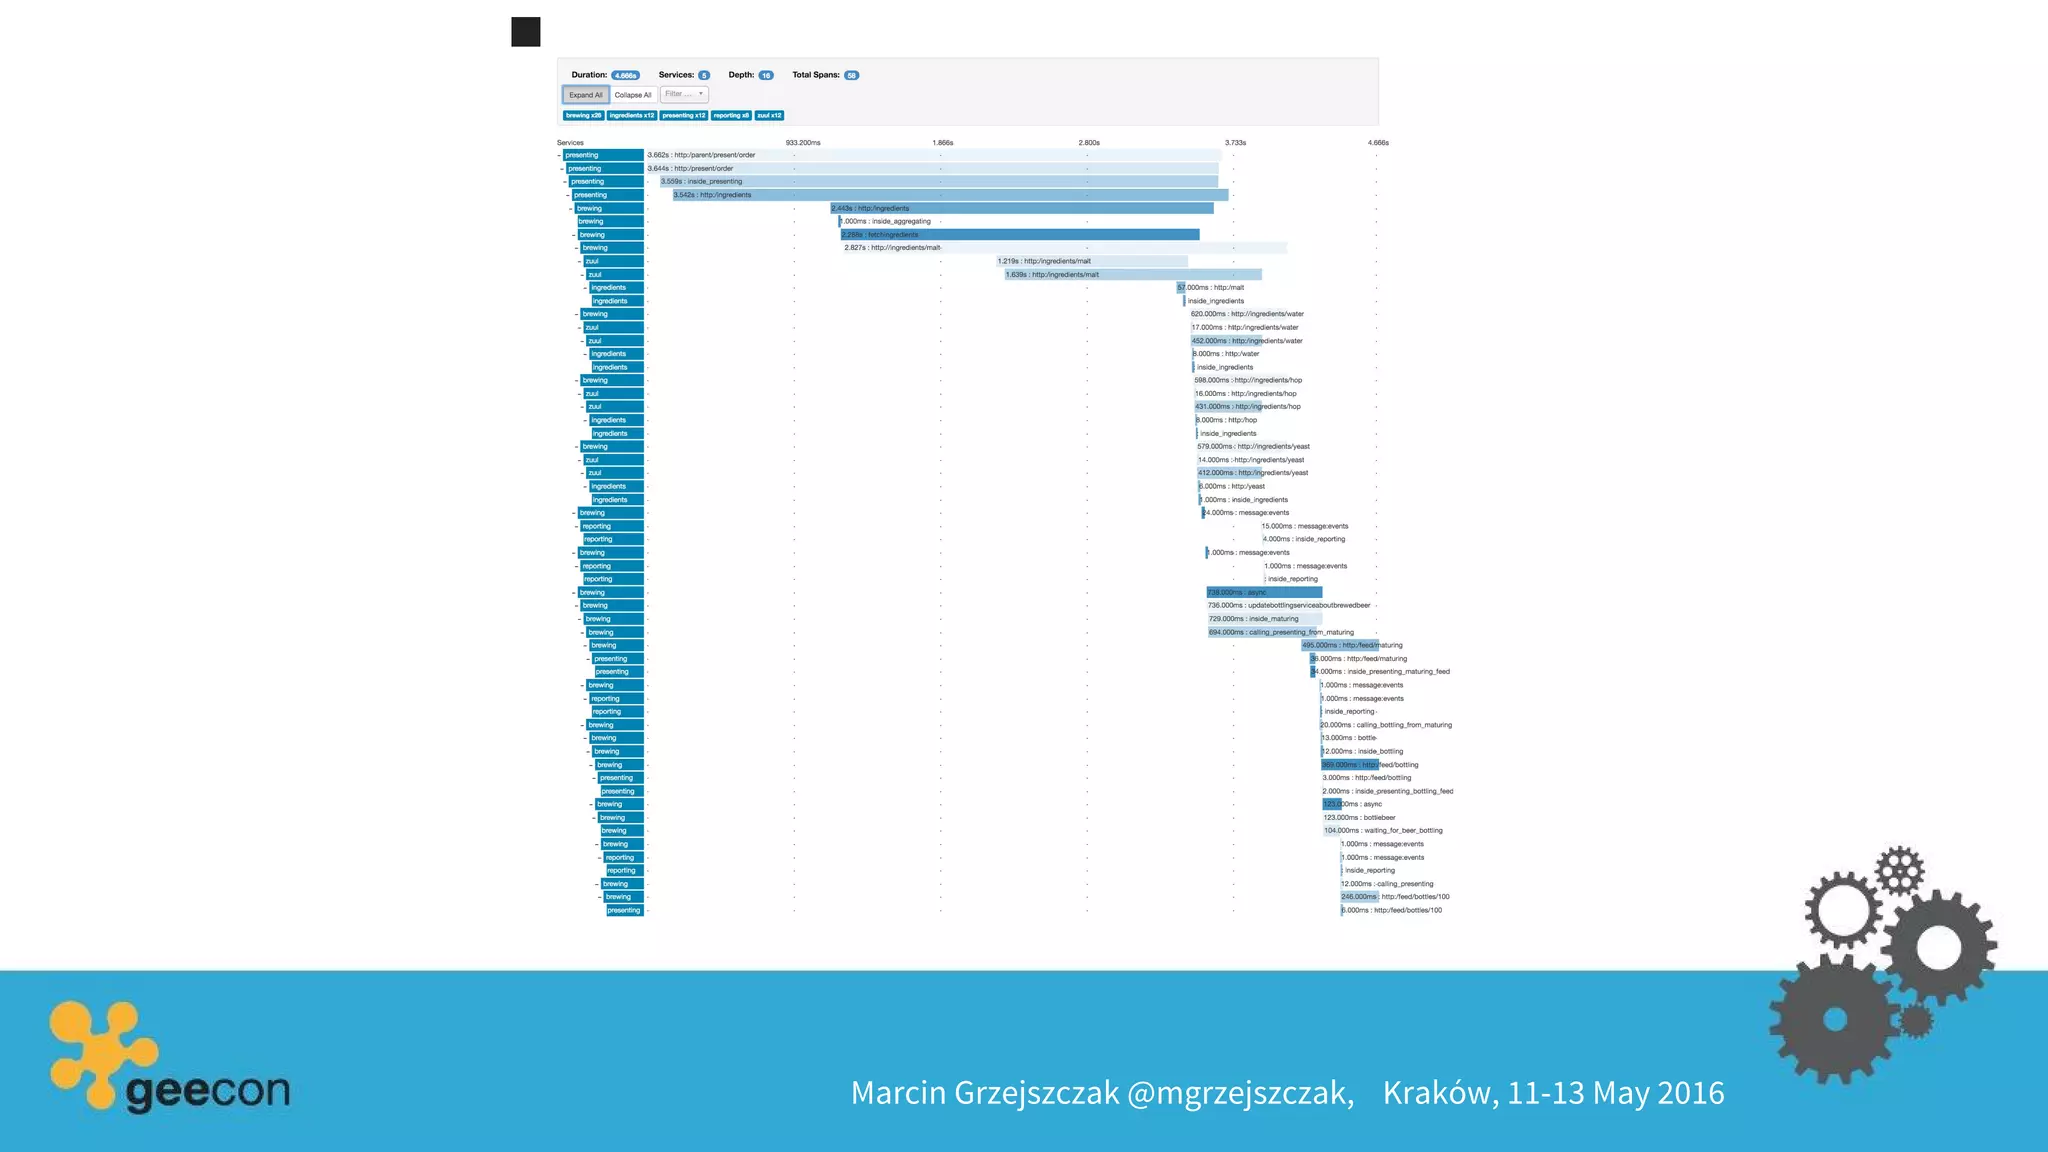
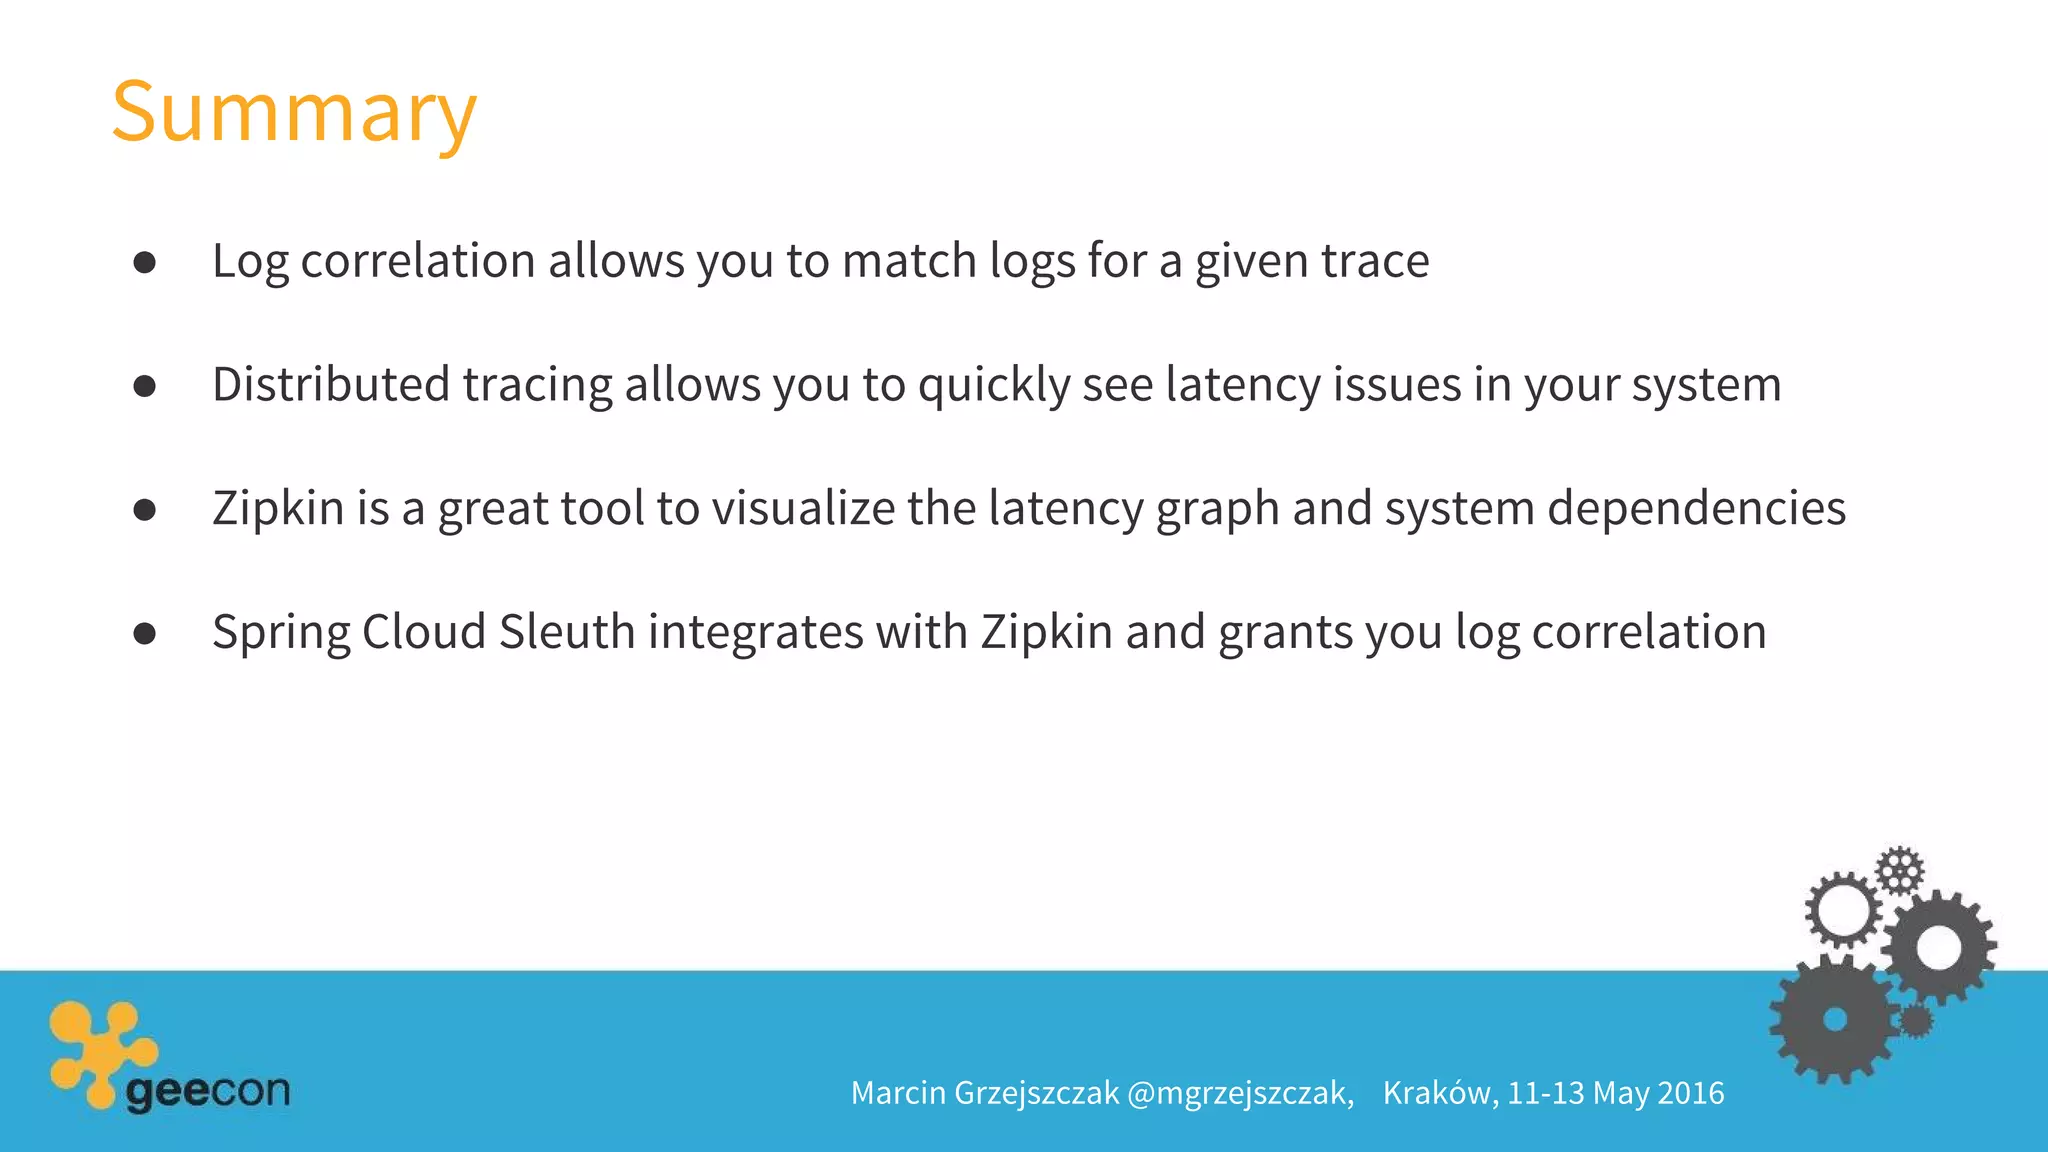


This document discusses distributed tracing with Spring Cloud Sleuth and Zipkin. It begins with an overview of distributed tracing terminology like spans, traces, logs, and tags. It then covers how Spring Cloud Sleuth correlates logs across services and libraries. Next, it demonstrates how to visualize latency using Spring Cloud Sleuth and Zipkin by logging timing data and sending spans to Zipkin for analysis. Finally, it provides examples of adding Spring Cloud Sleuth and Zipkin dependencies to applications.


![Coded Agents – with UiPath SDK + LangGraph [Virtual Hands-on Workshop]](https://cdn.slidesharecdn.com/ss_thumbnails/codedagentsdeck-251215155422-5497c599-thumbnail.jpg?width=640&height=640&fit=bounds)


![Vibe Coding vs. Spec-Driven Development [Free Meetup]](https://cdn.slidesharecdn.com/ss_thumbnails/vibecodingvsspecdrivendevelopment-251209105622-43f455e7-thumbnail.jpg?width=640&height=640&fit=bounds)

