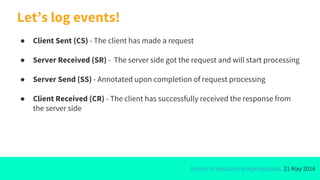
Downloaded 84 times


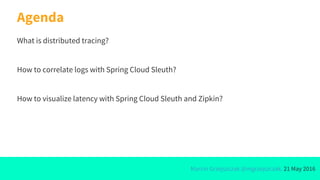


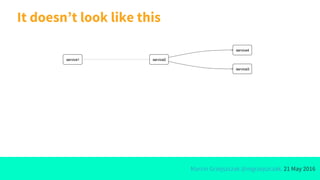

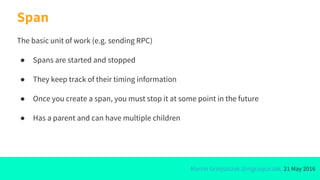
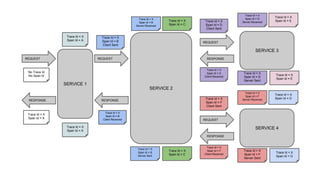


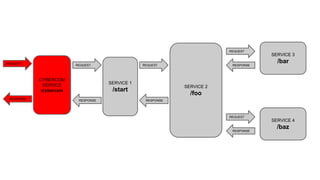
![SERVICE 1
REQUEST
RESPONSE
SERVICE 2
SERVICE 3
REQUEST
RESPONSE
REQUEST
RESPONSE
SERVICE 4
REQUEST
RESPONSE
“Hello from service3”
“Hello from service4”
“Hello from service2, response from
service3 [Hello from service3] and from
service4 [Hello from service4]”](https://image.slidesharecdn.com/microservicestracingwithspringcloudandzipkincybercomdev-160521140543/85/Microservices-Tracing-With-Spring-Cloud-and-Zipkin-CybercomDEV-28-320.jpg)


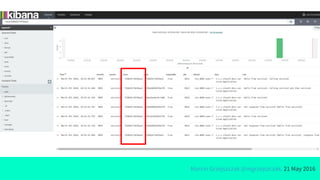


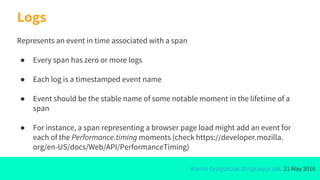
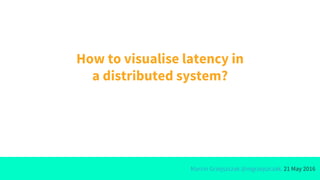
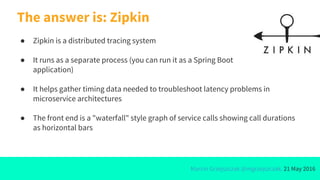
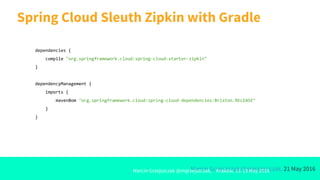


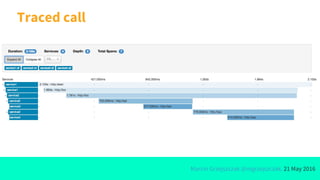
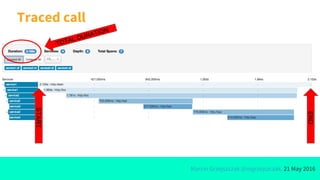
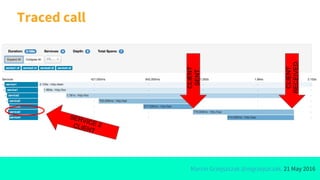
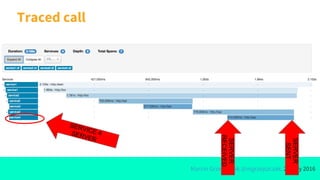


This document discusses distributed tracing with Spring Cloud and Zipkin. It begins with an overview of distributed tracing terminology like spans, traces, logs and tags. It then covers how Spring Cloud Sleuth handles log correlation across threads, libraries and services. Finally, it shows how to visualize latency in a microservices architecture using Spring Cloud Sleuth and Zipkin, which collects timing data and displays it in a waterfall graph.


![谷歌留痕技术教程[ 𝙩𝙤𝙥 𝟮𝟯𝟯. 𝙘 𝙤𝙢 ]](https://cdn.slidesharecdn.com/ss_thumbnails/top233-260130173900-2eb784f9-thumbnail.jpg?width=640&height=640&fit=bounds)


