Download to read offline


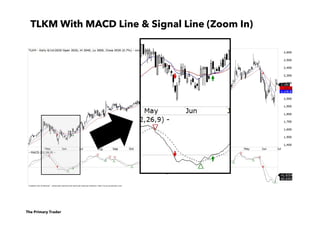


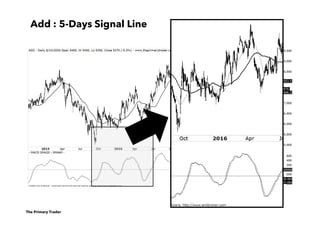
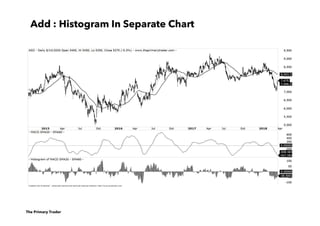


The document outlines a comprehensive approach to microscopic technical analysis, particularly focusing on the MACD (Moving Average Convergence Divergence) and stochastic oscillator indicators for trading. It emphasizes the use of relative performance metrics to assess market dynamics and provide trading signals, including the dandy rotation concept within the context of Bollinger Bands. Additionally, it discusses the importance of trend analysis and identifying trend reversals among various market instruments and their performance relative to benchmarks.


