Downloaded 209 times

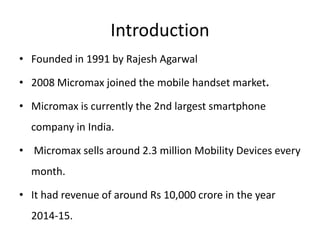


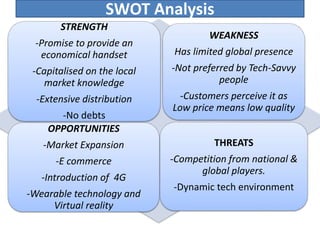


Founded in 1991, Micromax emerged as India's second-largest smartphone company, selling approximately 2.3 million devices monthly with a focus on affordable, feature-rich products. The company has diversified into television and aims for international expansion, while navigating strengths like market knowledge and weaknesses such as limited global presence. Utilizing a unique combination of cost control and product differentiation, Micromax faces competition in a dynamic tech environment and seeks to enhance customer responsiveness through increased service options.


