Downloaded 4,362 times
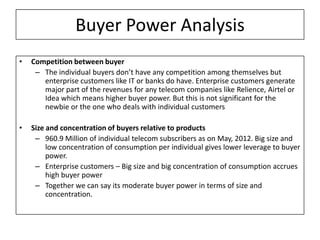
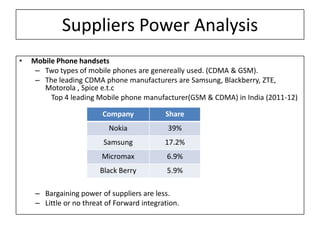
![Buyer Power Analysis
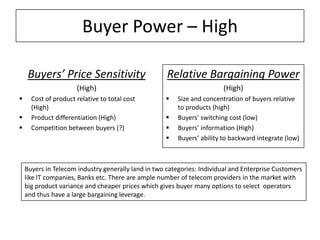
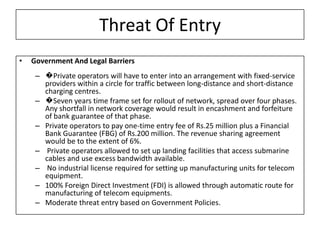
• Cost of product relative to total cost
– Telecom products e.g. Voice calls, 3g etc cost 100% of the total cost of service
and buyers are more sensible to pricing.
• Product differentiation
– Airtel, Relience,Idea and all other companies have similar prices for similar
products and less likely for any one to maintain product differentiation and
hence buyers have the option to switch over.
Airtel Relience Idea
----------- ----------- -----------
Prepaid Prepaid Prepaid
MRP(Rs.) DATA USAGE VALIDITY MRP(Rs.) DATA USAGE VALIDITY MRP(Rs.) DATA USAGE VALIDITY
250 1 GB 30 Days 255 1 GB 30 Days 250 1 GB 30 Days
450 2 GB 30 Days 449 2 GB 30 Days 450 2 GB 30 Days
1 Rs./min 300-plan (std) 30 days 1 Rs./min (std) 330-plan 30 days 1 Rs./min (std) 330-plan 30days
[Ref: http://im.tech2.in.com/gallery/2012/may/3gplans_311641209465.jpg]](https://image.slidesharecdn.com/section4group2portersfiveforceanalysisfortelecomindustry-120902060607-phpapp01/85/Porters-five-force-analysis-for-telecom-industry-15-320.jpg)

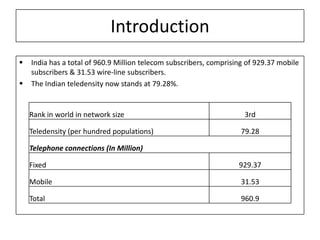
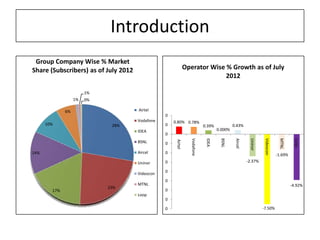
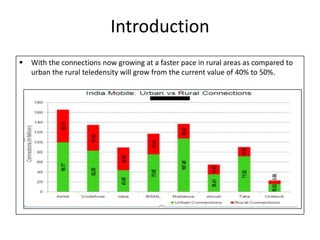
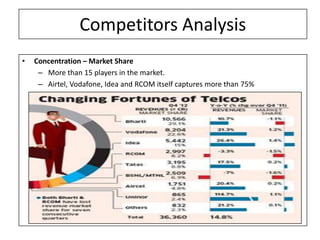
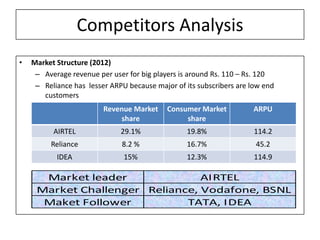
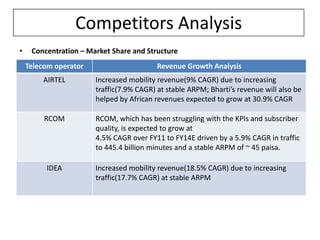
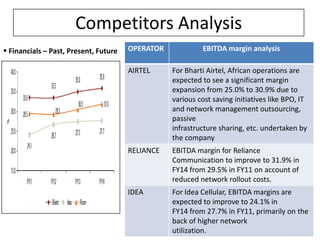
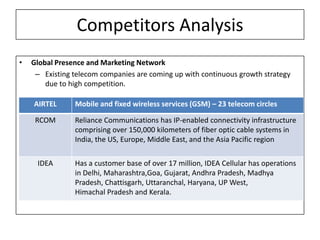
The telecom industry in India is highly competitive with over 15 players. The top players, Airtel, Vodafone and Idea, capture over 75% of the market share. While competition is intense, the industry is still growing with a focus on expanding to rural areas. The financials of the top players remain strong, however future consolidation in the industry is expected as players seek to improve margins. Overall, the telecom sector in India is one of the fastest growing globally due to strong competition and regulatory reforms that have promoted further expansion.