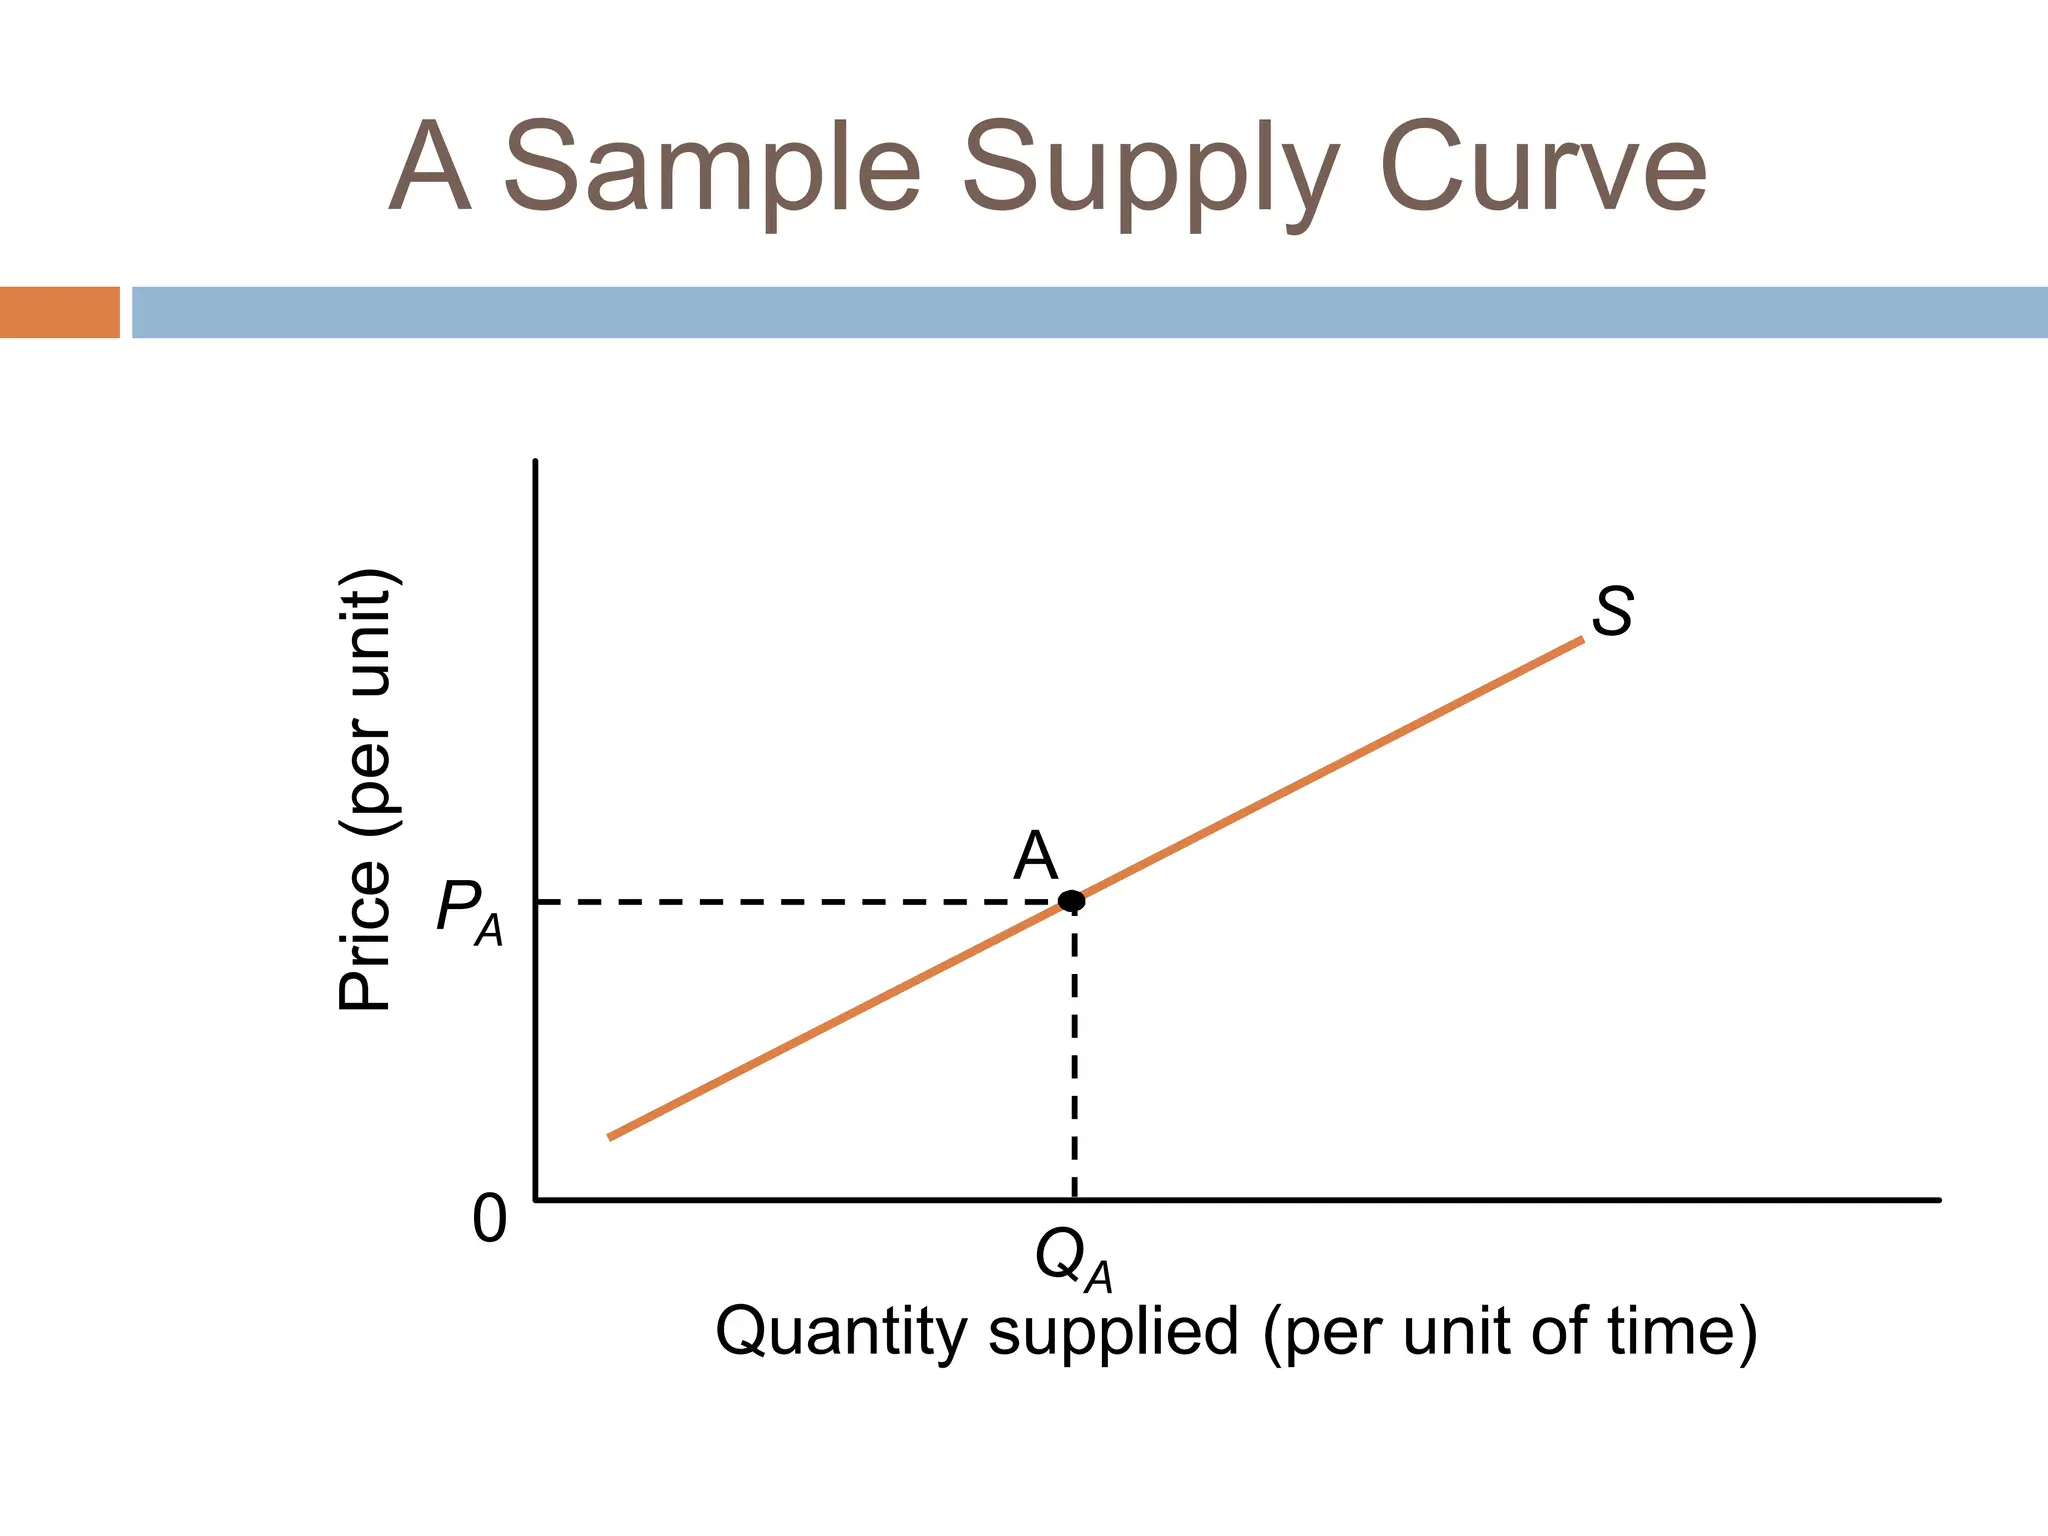
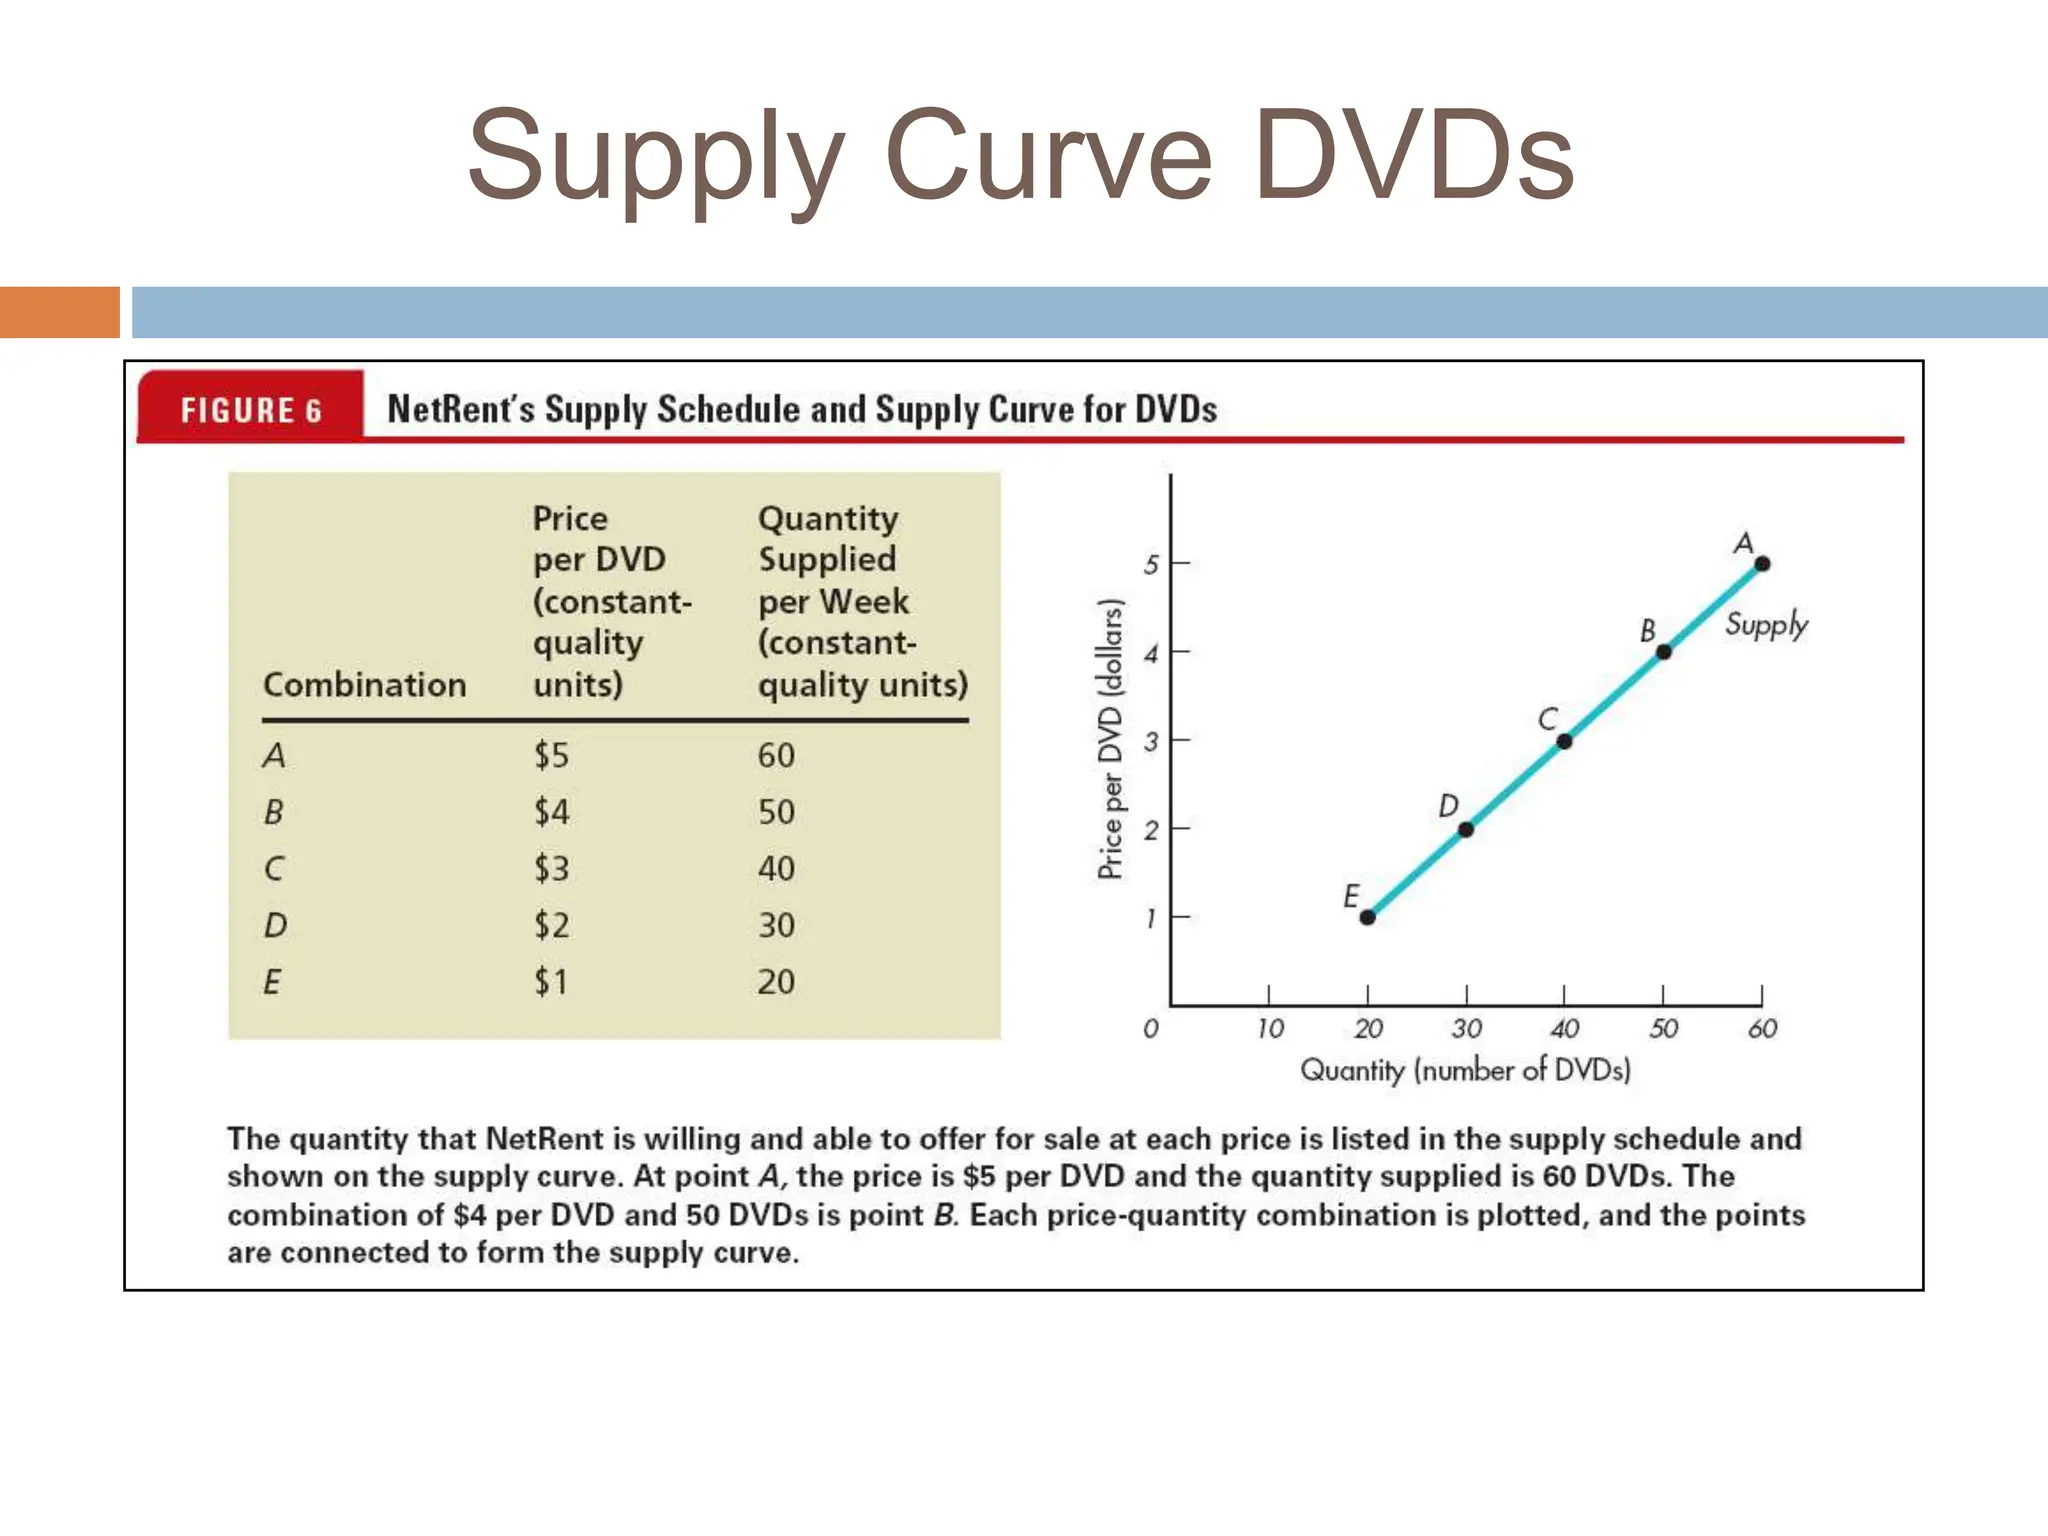
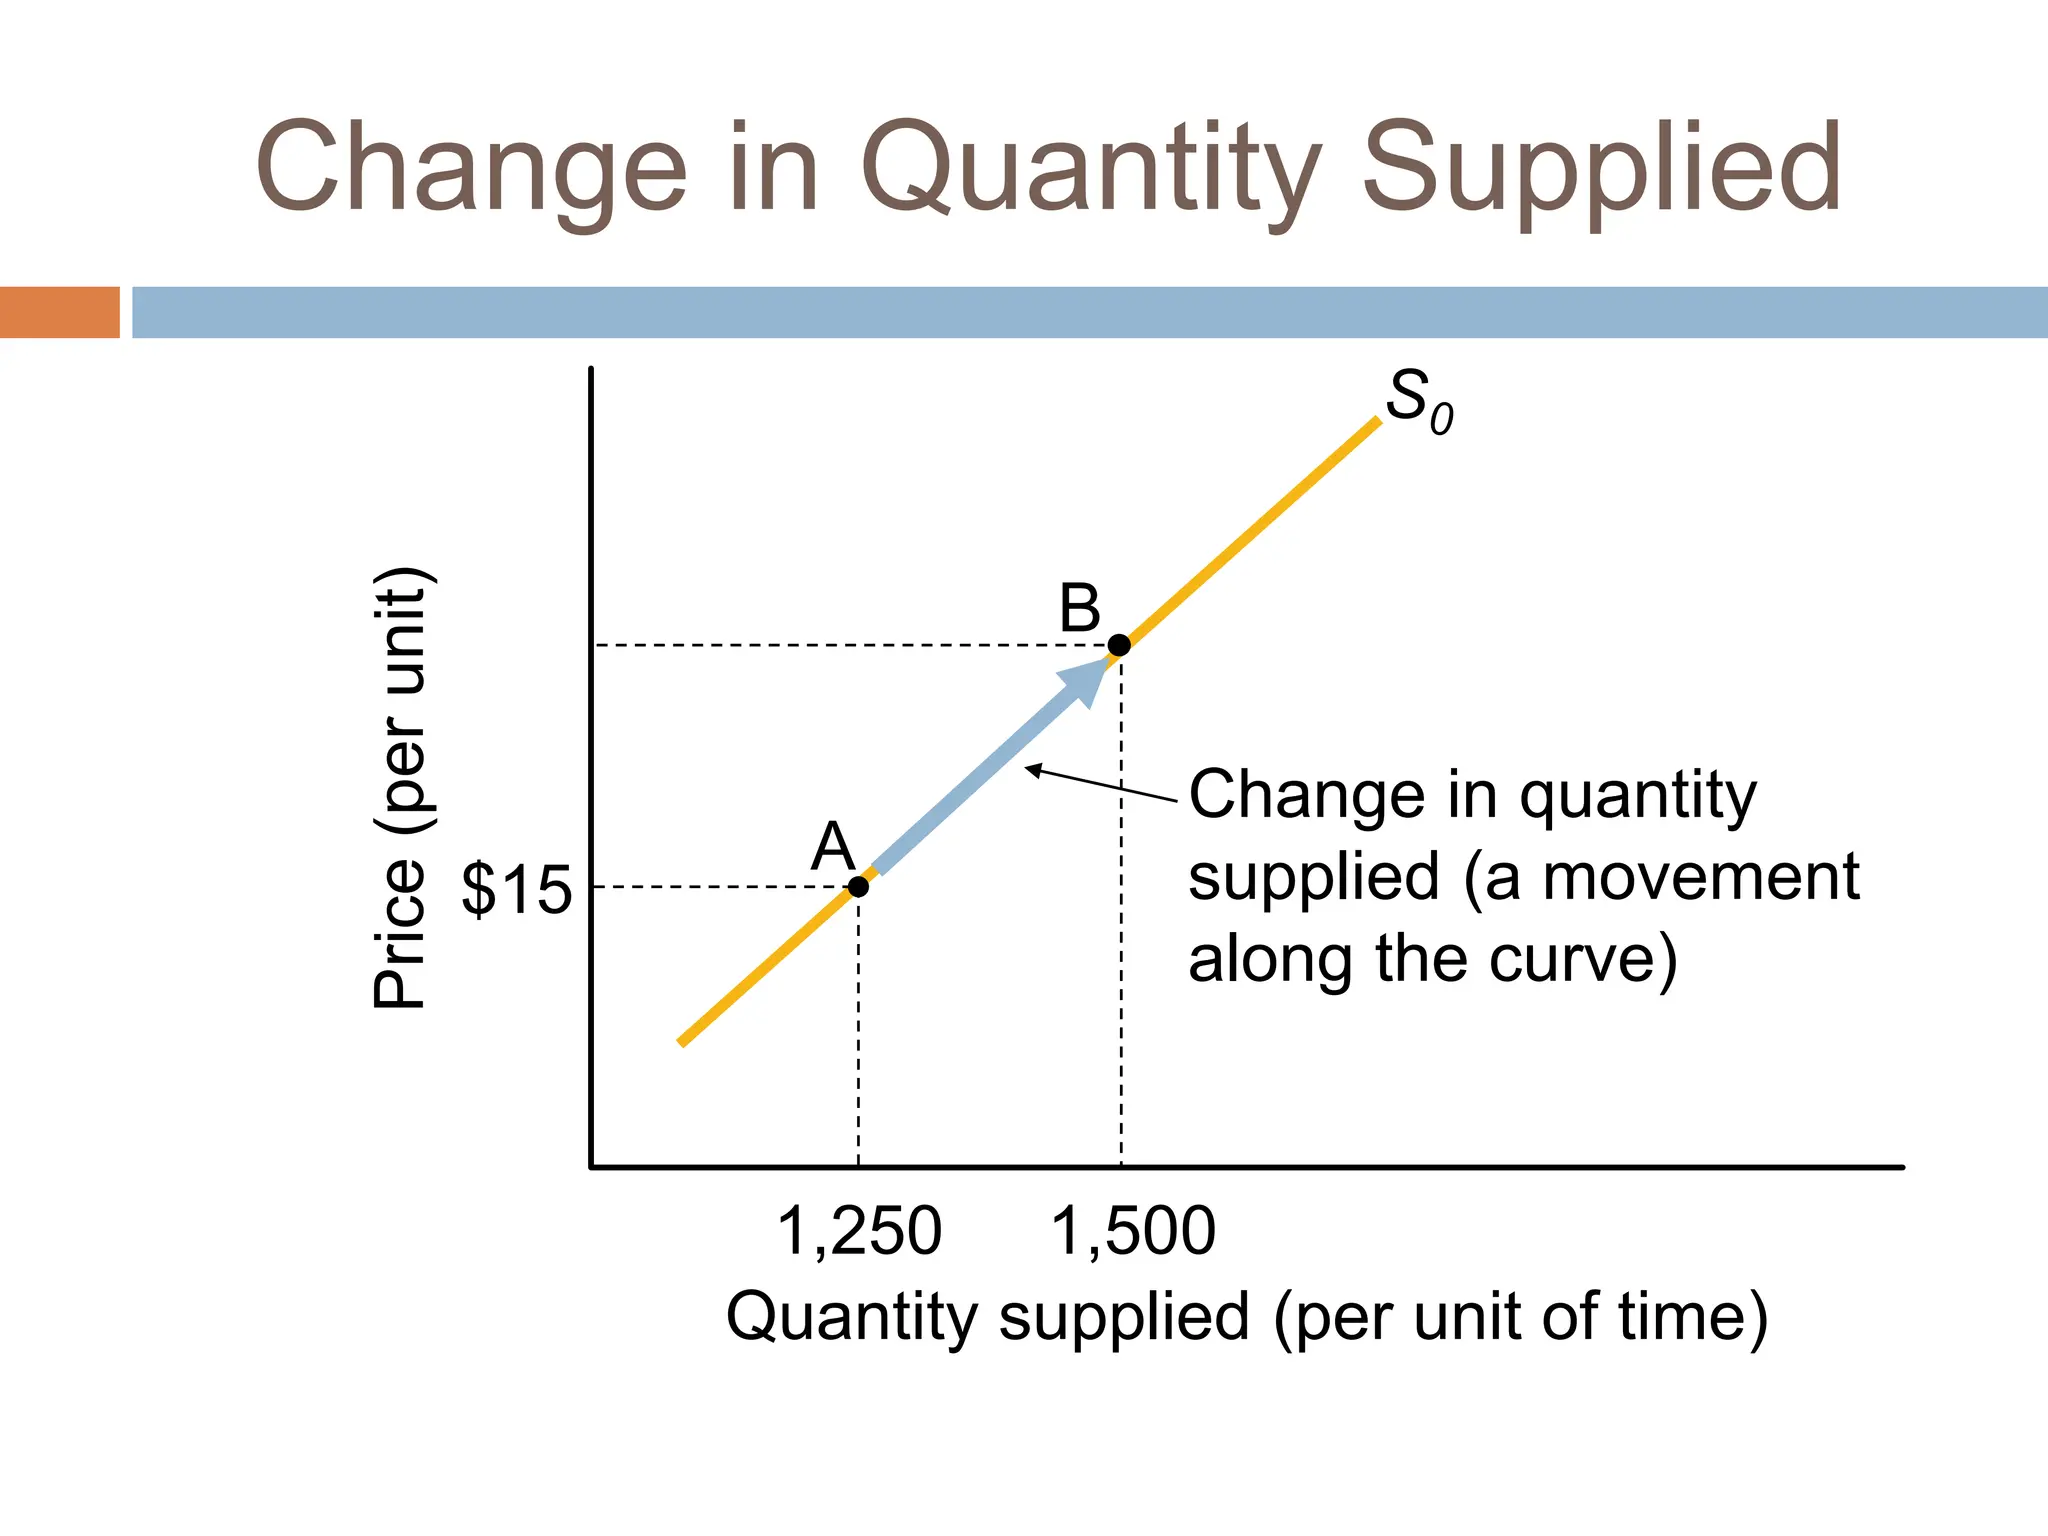
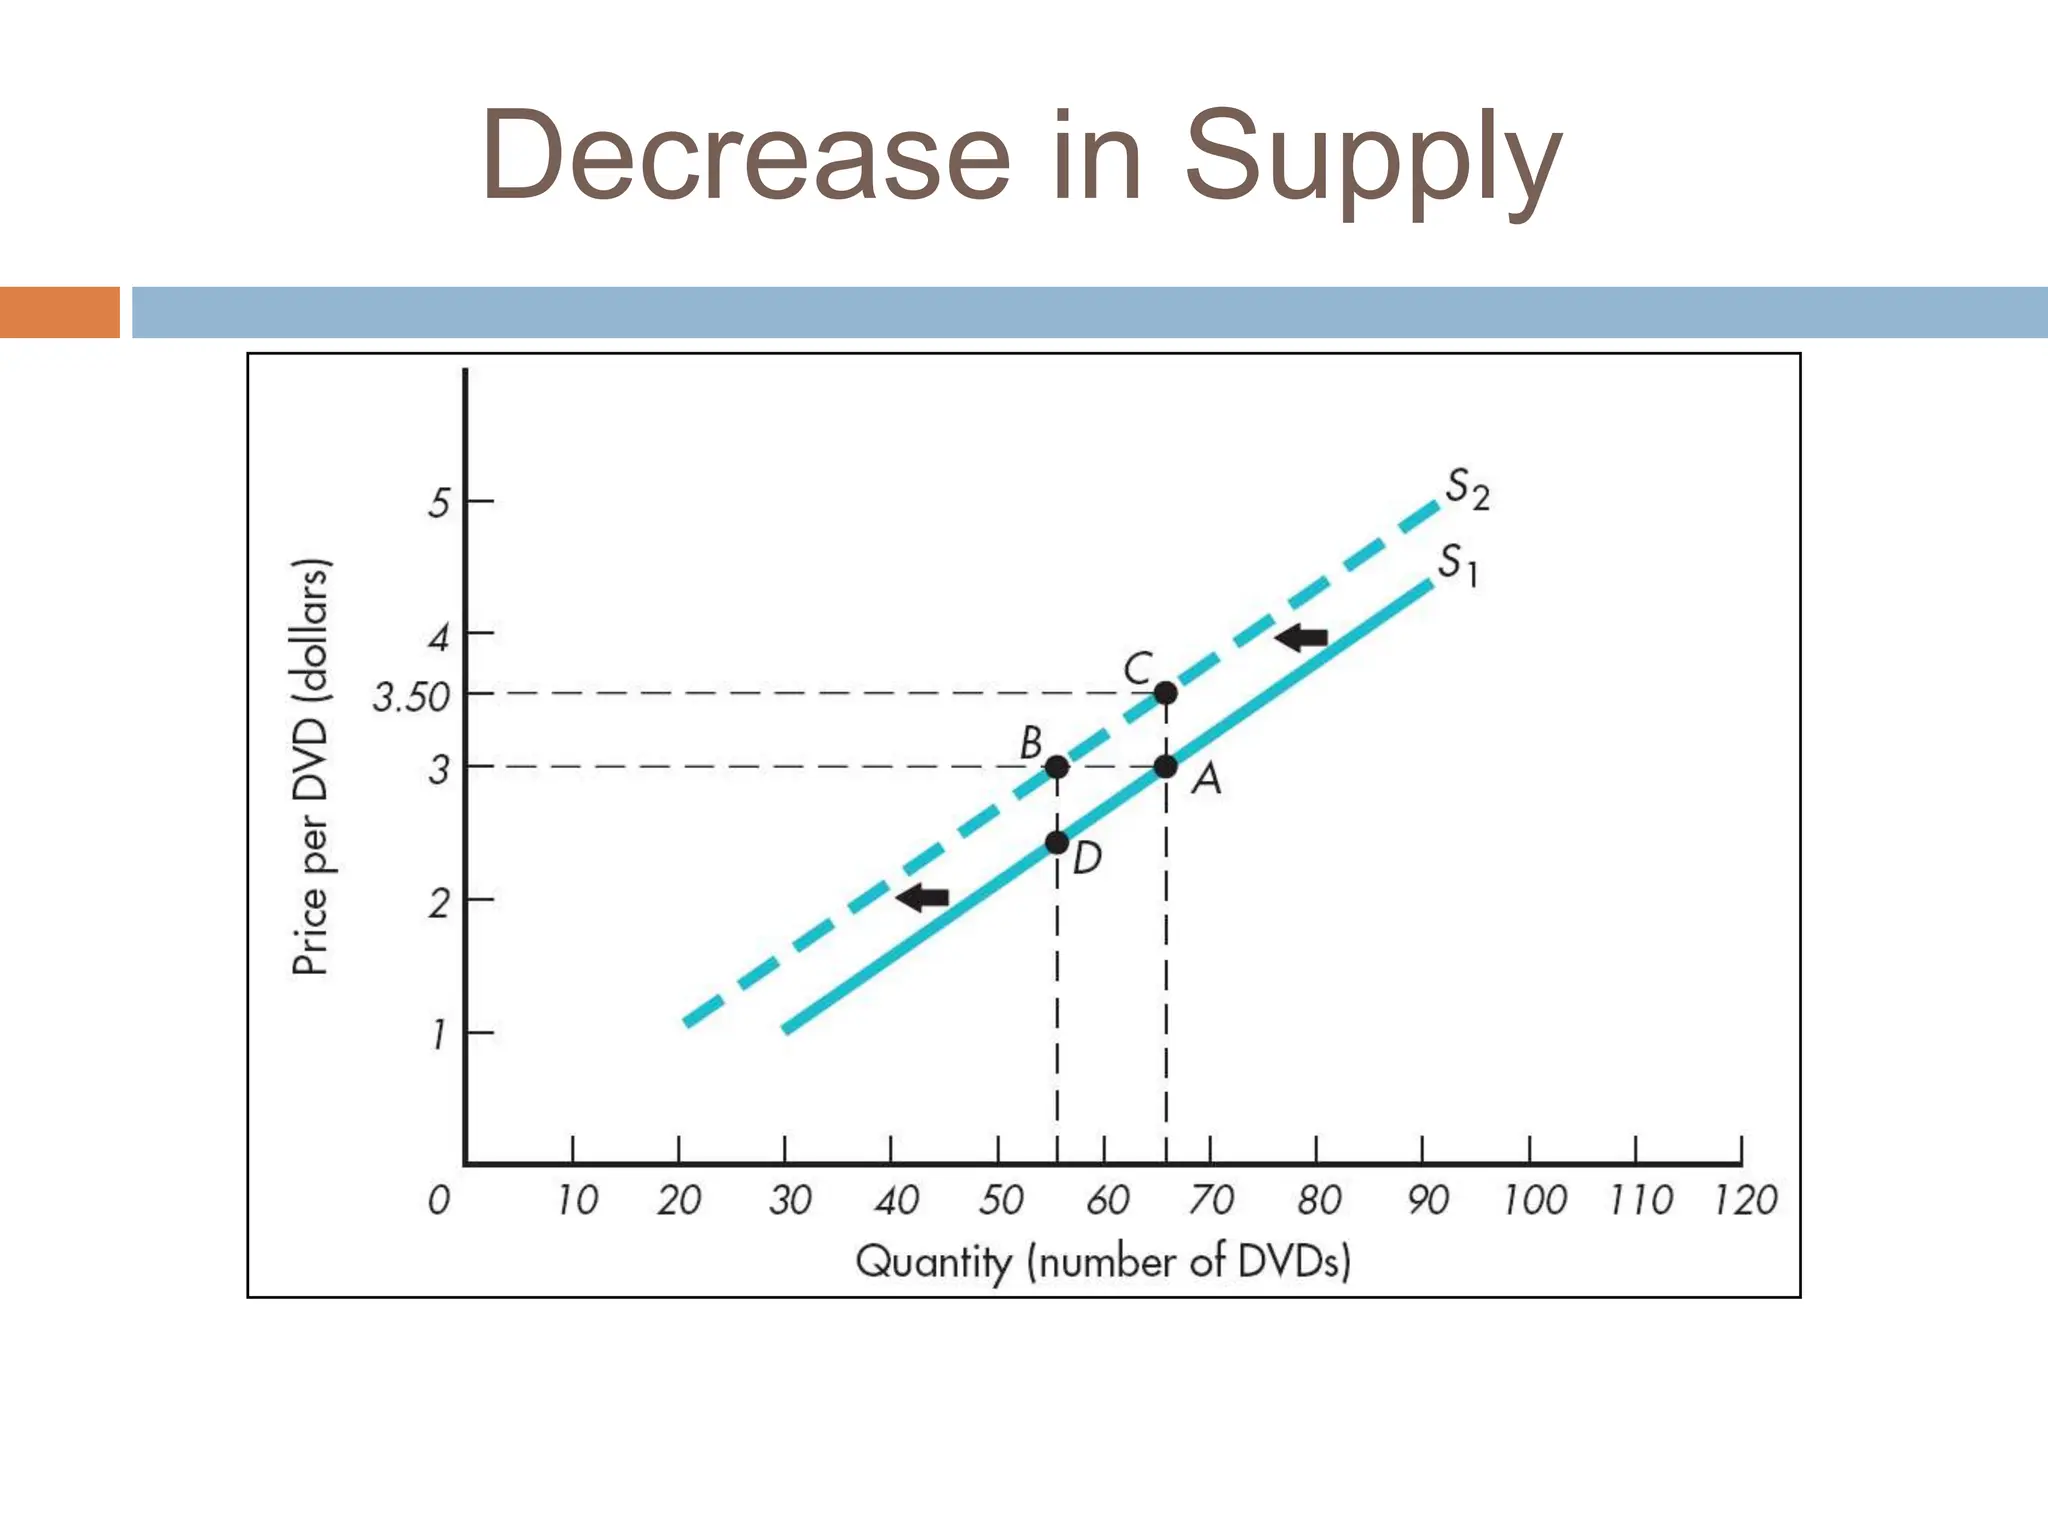
MICROECONOMICS
CHAPTER 3:
SUPPLY THEORY
 At the end of the lesson, students should be able to:
 Understand the law of demand
 Explain the determinants of supply.
 Draw the demand curve
3.0 SUPPLY
 Firms build the factories, hire workers, and buy the
materials because they believe it will be profitable
to do so.
 Supply decision thus depend on the profit
potential.
 Quantity supplied of any good is the amount that
sellers are willing to sell in the market
3.1 DETERMINANTS OF
SUPPLY
Price
Resources prices
Technology
Expectations
Number of sellers (Market supply curve)
Price of related goods
Tax and subsidies
3.2 THE LAW OF SUPPLY
 There is a direct relationship between price
and quantity supplied.
 Quantity supplied rises as price rises, other things
constant.
 Quantity supplied falls as price falls, other things
constant.
 Quantity supplied is positively related to the price of
the good
3.3 THE SUPPLY CURVE
 The supply curve is the graphic representation
of the law of supply.
 The supply curve slopes upward to the right.
 The slope tells us that the quantity supplied
varies directly – in the same direction – with
the price.
S
A
Quantity supplied (per unit of time)
0
Price
(per
unit)
PA
QA
A Sample Supply Curve
Supply Curve DVDs
Change in quantity
supplied (a movement
along the curve)
Change in Quantity Supplied
Price
(per
unit)
Quantity supplied (per unit of time)
S0
$15
A
1,250 1,500
B
Shift in Supply
Price
(per
unit)
Quantity supplied (per unit of time)
S0
Shift in Supply
(a shift of the curve)
S1
$15
A B
1,250 1,500
From Individual Supplies to a Market
Supply
Quantities
Supplied
A
B
C
D
E
F
G
H
I
(1)
Price
(per DVD)
(2)
Ann's
Supply
(5)
Market
Supply
(4)
Charlie's
Supply
$0.00
0.50
1.00
1.50
2.00
2.50
3.00
3.50
4.00
0
1
2
3
4
5
6
7
8
0
0
1
2
3
4
5
5
5
0
0
0
0
0
0
0
2
2
0
1
3
5
7
9
11
14
15
(3)
Barry's
Supply
Decrease in Supply
Increase in Supply
Another examples :
 The supply curve can shift position
 If the supply curve shifts to the right, this is
an increase in supply; more is provided for
sale at each price
 If the supply curve moves inwards, there is
a decrease in supply meaning that less will
be supplied at each price
Determinant of shift in market
supply
1.Changes in the costs of production
Lower costs of production mean that a business can
supply more at each price.
2.Changes in technology
Production technologies can change quickly and in
industries where change is rapid we see increases in
supply and lower prices for the consumer.
3.Government taxes and subsidies and regulations
indirect taxes cause an increase in production costs - an
inward shift of supply
Subsidies bring about a fall in supply costs – an outward
shift of supply
4.Changes in climate in agricultural industries
A substitute in production is a product that
could have been supplied using the same
resources.
If cocoa prices rise for example this may cause
some farmers to switch from other crops and
invest money in establishing new cocoa
plantations.
5.Change in the prices of a substitute in
production
When new businesses enter a market, supply
THE END

Microeconomics - International Supply Theory.pptx

  • 1.
  • 2.
     At theend of the lesson, students should be able to:  Understand the law of demand  Explain the determinants of supply.  Draw the demand curve
  • 3.
    3.0 SUPPLY  Firmsbuild the factories, hire workers, and buy the materials because they believe it will be profitable to do so.  Supply decision thus depend on the profit potential.  Quantity supplied of any good is the amount that sellers are willing to sell in the market
  • 4.
    3.1 DETERMINANTS OF SUPPLY Price Resourcesprices Technology Expectations Number of sellers (Market supply curve) Price of related goods Tax and subsidies
  • 5.
    3.2 THE LAWOF SUPPLY  There is a direct relationship between price and quantity supplied.  Quantity supplied rises as price rises, other things constant.  Quantity supplied falls as price falls, other things constant.  Quantity supplied is positively related to the price of the good
  • 6.
    3.3 THE SUPPLYCURVE  The supply curve is the graphic representation of the law of supply.  The supply curve slopes upward to the right.  The slope tells us that the quantity supplied varies directly – in the same direction – with the price.
  • 7.
    S A Quantity supplied (perunit of time) 0 Price (per unit) PA QA A Sample Supply Curve
  • 8.
  • 9.
    Change in quantity supplied(a movement along the curve) Change in Quantity Supplied Price (per unit) Quantity supplied (per unit of time) S0 $15 A 1,250 1,500 B
  • 10.
    Shift in Supply Price (per unit) Quantitysupplied (per unit of time) S0 Shift in Supply (a shift of the curve) S1 $15 A B 1,250 1,500
  • 11.
    From Individual Suppliesto a Market Supply Quantities Supplied A B C D E F G H I (1) Price (per DVD) (2) Ann's Supply (5) Market Supply (4) Charlie's Supply $0.00 0.50 1.00 1.50 2.00 2.50 3.00 3.50 4.00 0 1 2 3 4 5 6 7 8 0 0 1 2 3 4 5 5 5 0 0 0 0 0 0 0 2 2 0 1 3 5 7 9 11 14 15 (3) Barry's Supply
  • 12.
  • 13.
  • 14.
    Another examples : The supply curve can shift position  If the supply curve shifts to the right, this is an increase in supply; more is provided for sale at each price  If the supply curve moves inwards, there is a decrease in supply meaning that less will be supplied at each price
  • 17.
    Determinant of shiftin market supply 1.Changes in the costs of production Lower costs of production mean that a business can supply more at each price. 2.Changes in technology Production technologies can change quickly and in industries where change is rapid we see increases in supply and lower prices for the consumer. 3.Government taxes and subsidies and regulations indirect taxes cause an increase in production costs - an inward shift of supply Subsidies bring about a fall in supply costs – an outward shift of supply
  • 18.
    4.Changes in climatein agricultural industries A substitute in production is a product that could have been supplied using the same resources. If cocoa prices rise for example this may cause some farmers to switch from other crops and invest money in establishing new cocoa plantations. 5.Change in the prices of a substitute in production When new businesses enter a market, supply
  • 19.