Download to read offline


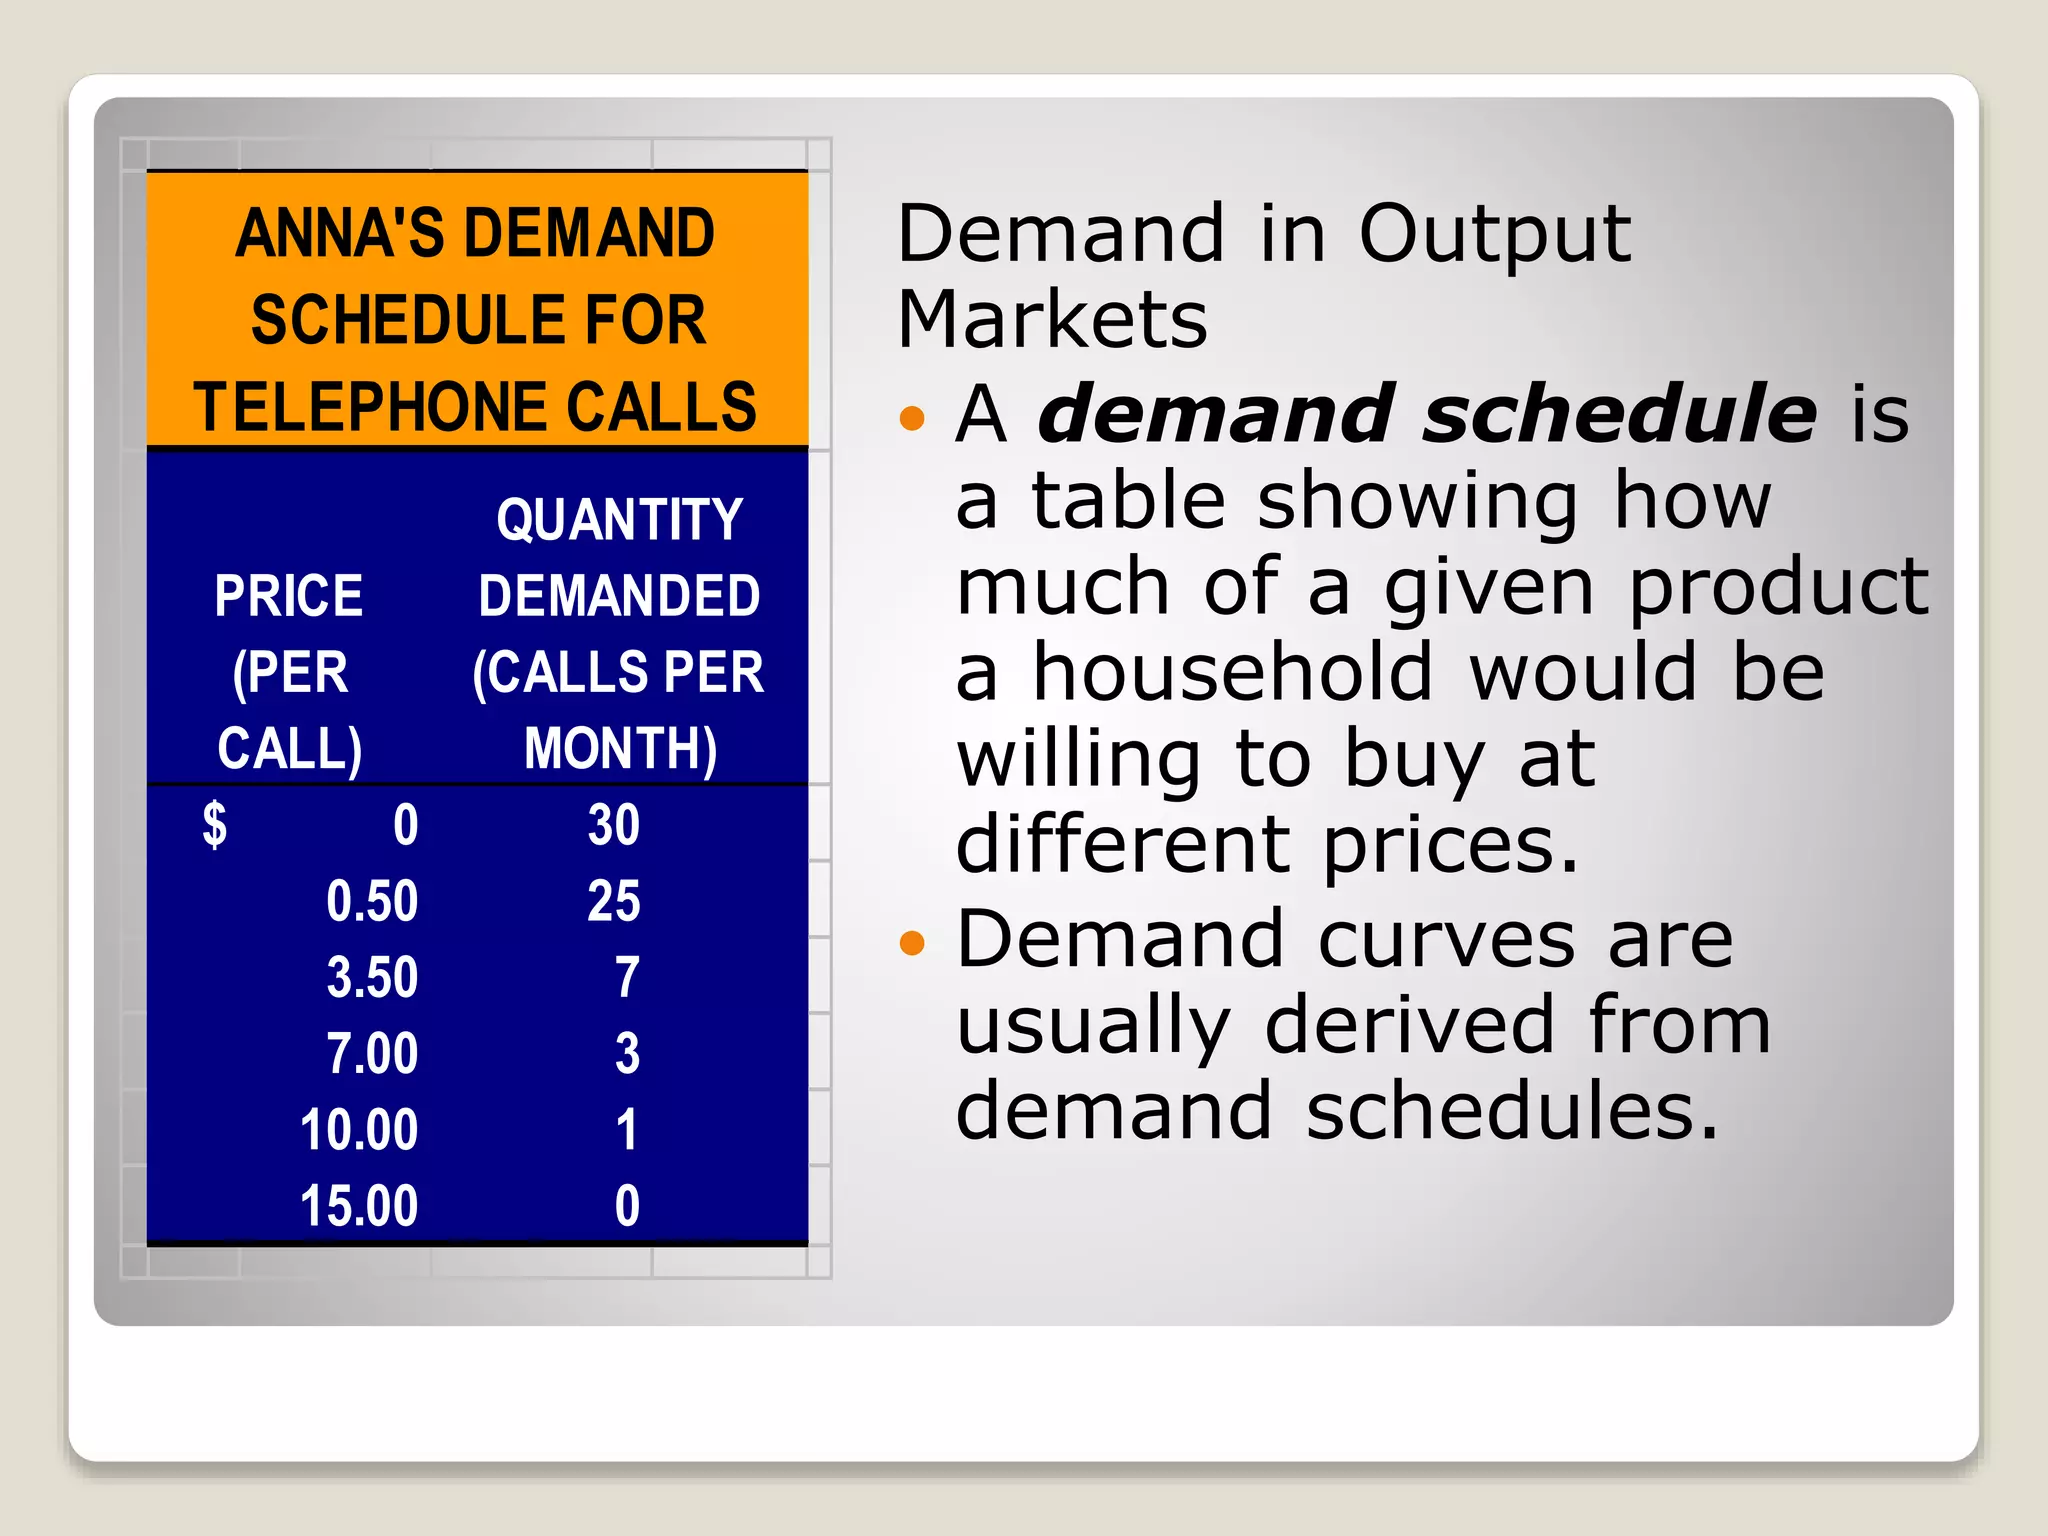
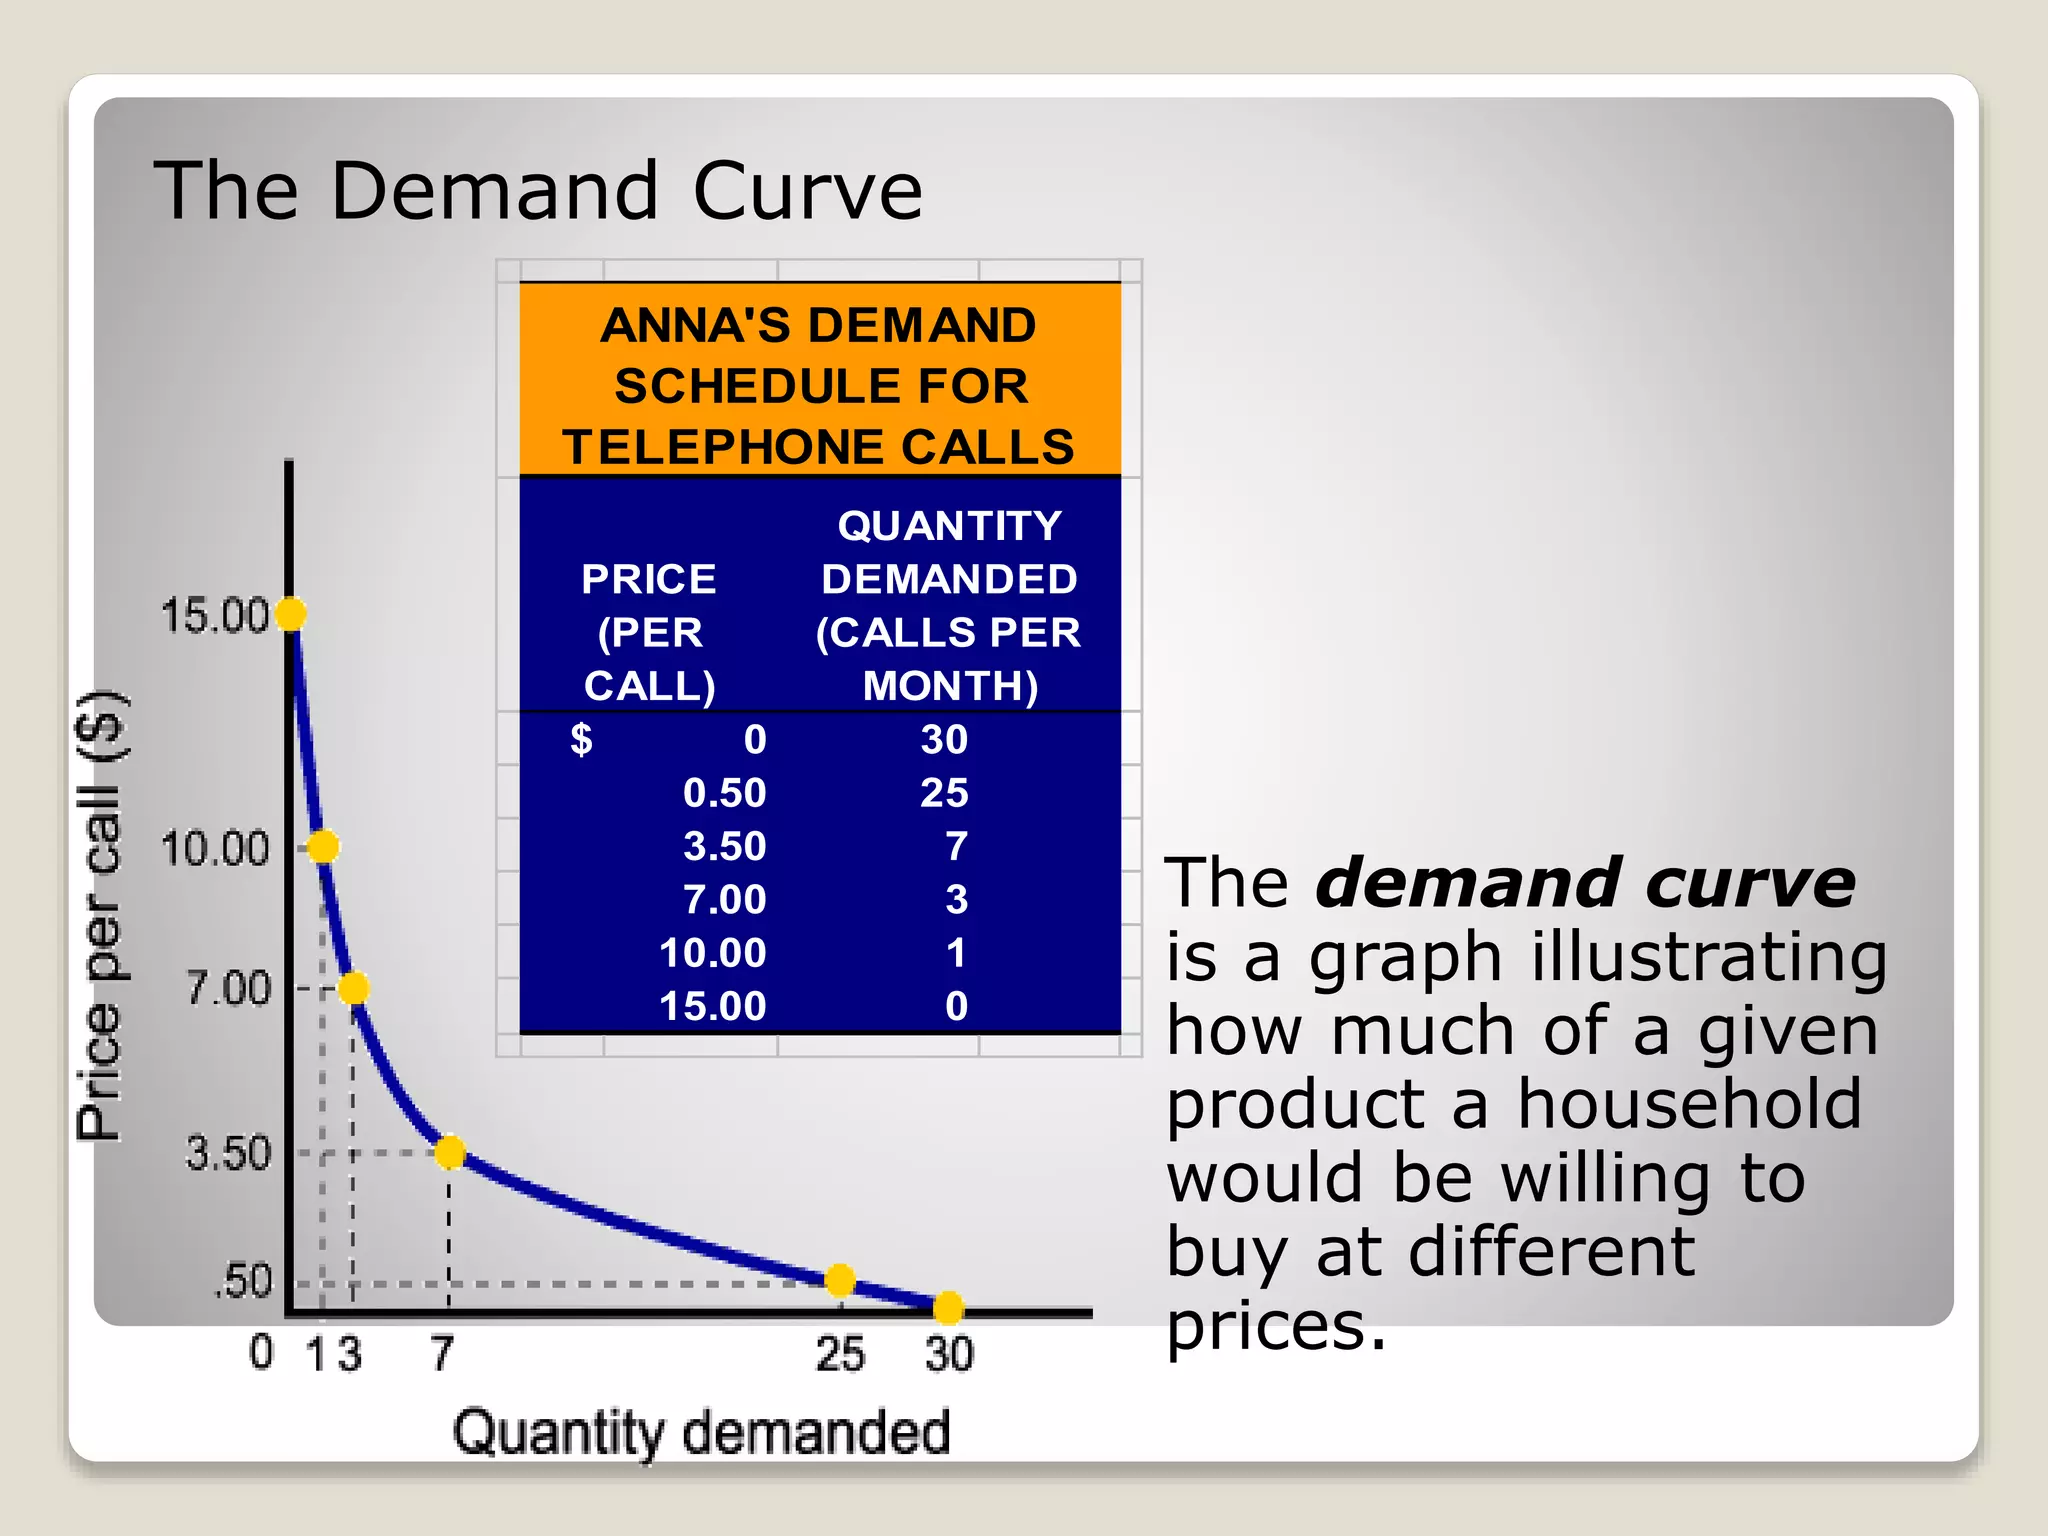


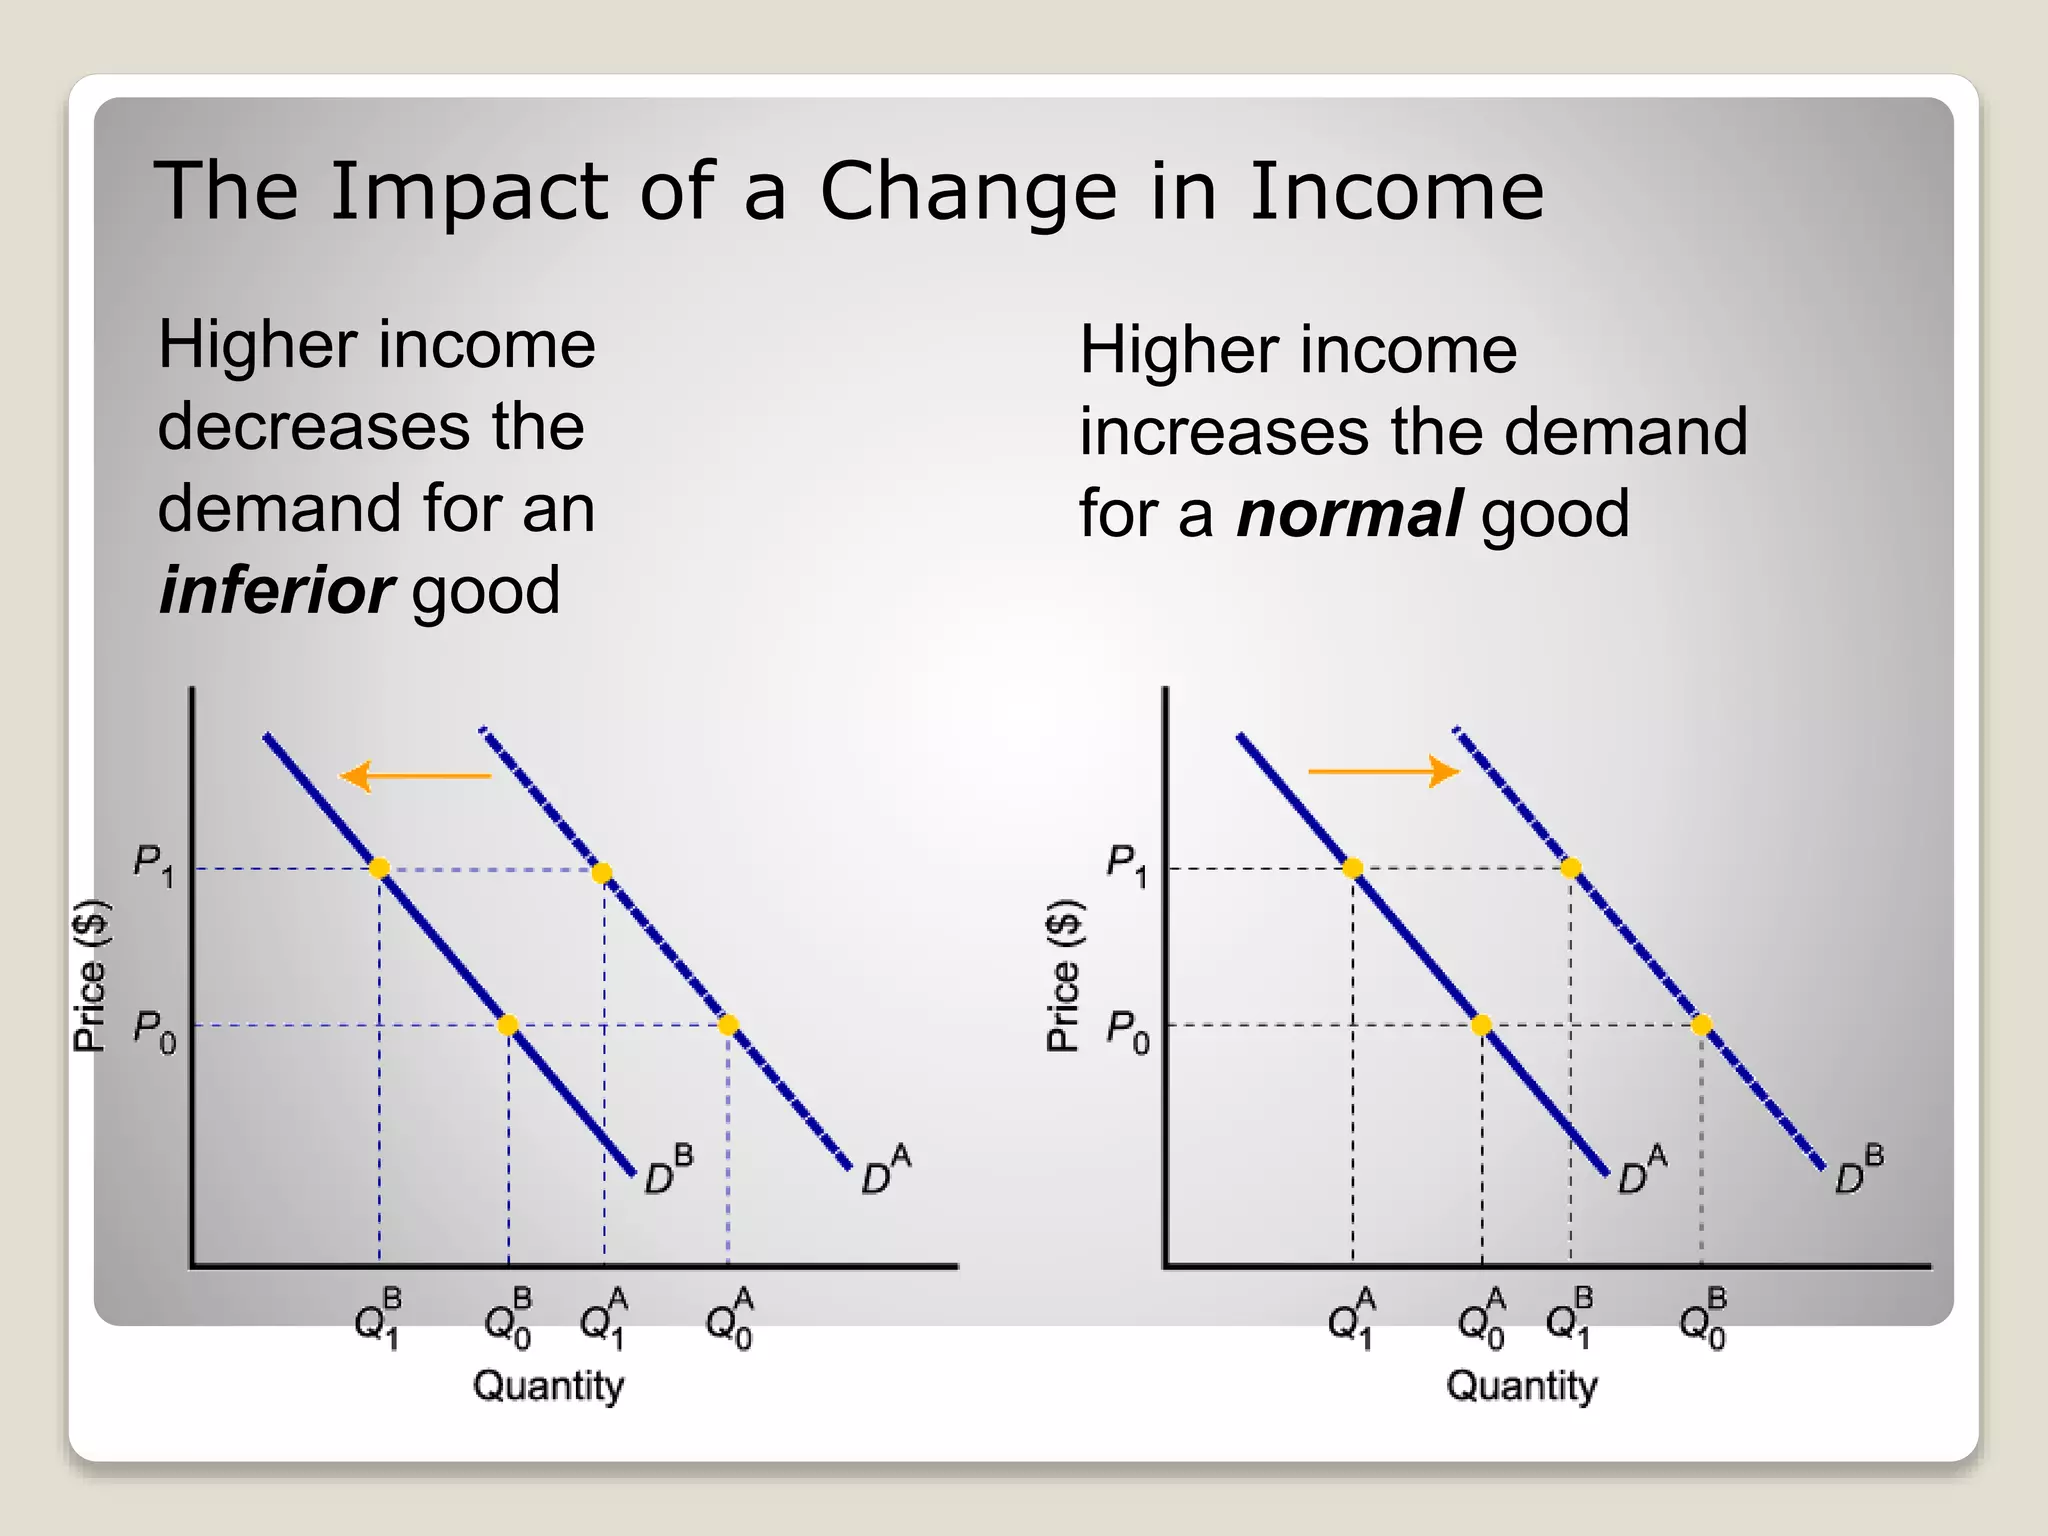


This document provides a summary of key concepts related to market demand and supply. It discusses the basic decision-making units in an economy, including firms that produce goods and households that consume them. It then covers the concepts of demand schedules and curves, the law of demand, and how shifts in demand versus movements along a demand curve. Similar concepts are presented for supply schedules and curves as well as the law of supply. The document also discusses how individual demand and supply combine to form market demand and supply and how equilibrium is reached in markets where quantity supplied equals quantity demanded.


