Download as PDF, PPTX


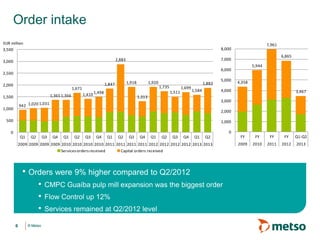
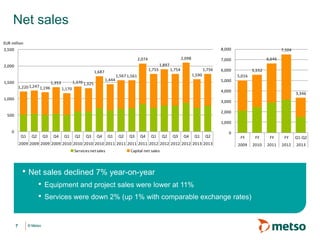
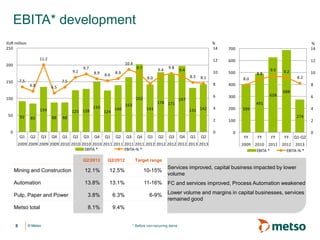
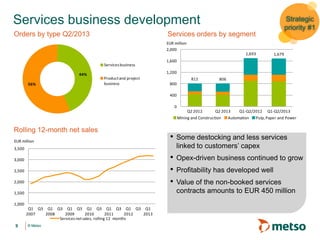

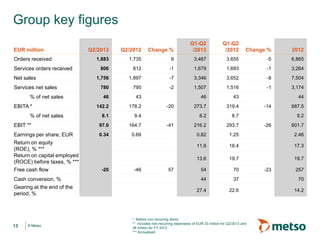
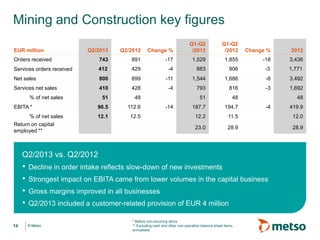
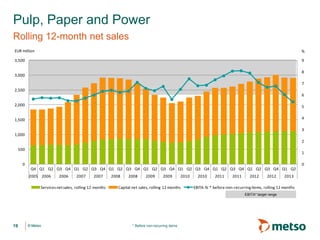


Metso's Q2 2013 highlights include: - Order intake was EUR 1,883 million, up 9% year-over-year. Net sales totaled EUR 1,756 million, down 7%. - EBITA before non-recurring items was EUR 142 million, down from EUR 178 million in Q2 2012. - Services business remained solid but capital expenditure-related services saw a slowdown. - Cost saving initiatives will continue across business areas to improve profitability. - The demerger process to separate Metso into two companies has progressed on schedule.


