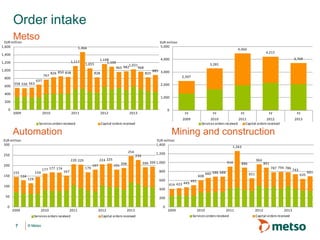
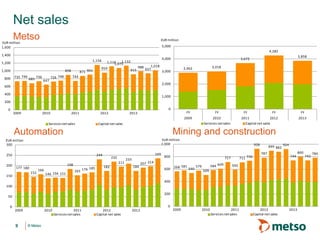
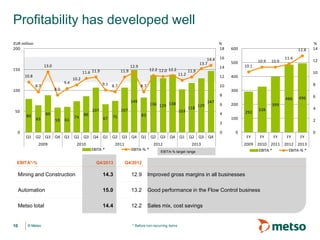
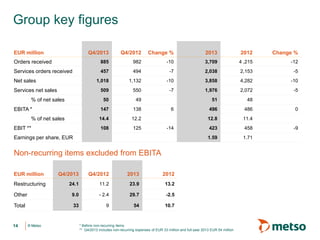
Fourth quarter and full year
2013 results
Matti Kähkönen, President and CEO
Harri Nikunen, CFO
February 6, 2014

© Metso

www.metso.com
Forward looking statements
It should be noted that certain statements herein which are not historical facts, including, without limitation,
those regarding expectations for general economic development and the market situation, expectations for
customer industry profitability and investment willingness, expectations for company growth, development
and profitability and the realization of synergy benefits and cost savings, and statements preceded by
”expects”, ”estimates”, ”forecasts” or similar expressions, are forward-looking statements. These
statements are based on current decisions and plans and currently known factors. They involve risks and
uncertainties which may cause the actual results to materially differ from the results currently expected by
the company.
Such factors include, but are not limited to:
1)

general economic conditions, including fluctuations in exchange rates and interest levels which
influence the operating environment and profitability of customers and thereby the orders received by
the company and their margins

2)

the competitive situation, especially significant technological solutions
developed by competitors

3)

the company’s own operating conditions, such as the success of production, product development and
project management and their continuous development and improvement

4)

the success of pending and future acquisitions and restructuring.

2

© Metso
Content
1. Q4 and full year 2013 highlights
2. Strategic development
3. Financial performance
4. Outlook and guidance

3

© Metso
HSE (Health, Safety & Environment)
An essential element in all our activities
•

We are committed to taking personal
responsibility for our own safety and for the
safety of others

•

We believe that all incidents can be
prevented

•

We always emphasize our high HSE
standards of conduct when dealing with
customers, suppliers, and other
stakeholders

•

We aim to minimize our environmental
footprint throughout the entire value chain

4

© Metso

Lost time incident frequency
16.0
14.0
12.0
10.0
8.0
6.0
4.0
2.0
0.0
Q4 and full year 2013
highlights
Matti Kähkönen

President and CEO
Highlights
Full year 2013

•
•

Oil & gas-related demand was good - mining market was soft

•

Net sales were EUR 3,858 million (EUR 4,282 million), of which EUR 1,976 million (EUR
2,072 million) services sales

•
•
•
•

EBITA before NRE was EUR 496 million, 12.8% of net sales (EUR 486 million, 11.4%)

Orders received were EUR 3,709 million (EUR 4,215 million), of which EUR 2,038 million
(2,153 million) services orders

Non-recurring expenses totaled EUR 54 million
Pulp, Paper and Power businesses were separated to Valmet Corporation
The Board proposes a dividend of EUR 1.00 per share, i.e. 63% of earnings per share

Fourth quarter 2013

•

Orders received EUR 885 million (EUR 982 million), of which EUR 457 million (EUR 494
million) services orders

•

Net sales were EUR 1,018 million (EUR 1,132 million), of which EUR 509 million (EUR 550
million) services sales

•
•

EBITA before NRE was EUR 147 million, 14.4% of net sales (EUR 138 million and 12.2%)

6

Non-recurring expenses totaled EUR 33 million

© Metso

Figures in the brackets refer to same period last yer unless otherwise
stated
Order intake
Metso

EUR million
1,600

EUR million
5,000

1,466

1,400
1,117

1,200
1,000
767

800
600

558 550 563

1,168
1,100

1,055

826 850 838

828

825

637

885 3,000
2,307
2,000
1,000

2009

2010

2011

2012

Services orders received

FY

FY

250

224 225

220 225
200

177 177 174

159

179

167

197

FY

FY

2010
2011
2012
Services orders received
Capital orders received

2013

Mining and construction
EUR million
1,400

254

134

FY
2009

EUR million
300

155

0

2013

Capital orders received

Automation

239

1,263

1,200
914

200 209 1,000

191 206

800

129

600

100

400

50
0

3,709
3,281

1,031
968
965 982

200

150

4,215

4,000

400

0

4,466

608
414 423 449

660 686 688

964

886

891

787 794 786

651

635

491

200
2009

2010

2011

Services orders received

7

© Metso

2012

2013

Capital orders received

0

2009

2010

2011

Services orders received

743

2012

2013

Capital orders received

691
Order intake in top 10 countries
EUR million
Country
USA

2013
486

2012
580

Change %
-16

% of total
13

China

317

265

19

8

Brazil

314

414

-24

8

Chile

245

177

38

7

Australia

213

283

-25

6

Finland

183

175

5

5

Sweden

163

201

-19

4

Canada

148

193

-24

4

Russia

141

300

-53

4

India

121

195

-38

3

•

US is clearly our biggest market; orders declined in Mining and
Construction, grew in Automation

•
•

Orders from China increased in both segments

8

Emerging markets accounted for 56 percent (55%) of orders received and
52 percent (49%) of services orders received
© Metso
Net sales
Metso

EUR million

EUR million
1,600

5,000
4,282

1,400
1,156

1,200

1,132
1,116
1,075
1,018
988
959
937
915

4,000

800

871 901

898
735 746

685

736

647

726 748

2,902

FY

3,000

3,018

FY

2009

1,000

3,858

3,672

2010
Services net sales

744
2,000

600
400

1,000

200
0

2009

2011

2010

Services net sales

Automation

0

2013

2012
Capital net sales

244
198

177 180
152

150

166

146 156 151

185
165 176

249

232
182

211

FY

2011
2012
Capital net sales

EUR million
1,000

250

FY

2013

Mining and construction

EUR million
300

200

FY

233
184

928

800

207 214
600

711 736

717
268 581 540 579

584 609

899 882 924
787

744

592

509

400
100
200

50
0

2009

9

2010

© Metso

2011
Services net sales

2012
Capital net sales

2013

0

2009

2010

2011
Services net sales

2012
Capital net sales

2013

800

742

784
Profitability has developed well
%
18

EUR million
200

13.0

150

11.6 11.9

10.8
9.4

8.7

100

10.2

11.9

12.9

9.1 8.7

8.0

14.4
13.7
12.2 12.0 12.2

0

14
12
10

8.7

8
149

50

11.2

11.9

16

80

Q1

65

Q2

89
59

Q3

61

Q4

Q1

74

Q2

2009

EBITA*-%

86

Q3

2010

107

107
67

Q4

Q2

103

83

75

Q1

136 129 138

118

129

147

6
4
2

EBITA *

Q3

2011

Q4

Q1

Q2

EBITA-% *

Q3

Q4

2012

Q1

Q2

Q3

2013

EBITA-% target range

Q4

0

600
500

12.8
10.1

10.9

8
300
486
200
292

328

496

399

6
4

100

2

0

FY

FY

FY

FY

FY

2009 2010 2011 2012 2013
EBITA *
EBITA-% *

Q4/2012

14.3

12.9

Improved gross margins in all businesses

Automation

15.0

13.2

Good performance in the Flow Control business

Metso total

14.4

12.2

Sales mix, cost savings

* Before non-recurring items

12
10

Q4/2013

© Metso

11.4

400

Mining and Construction

10

10.9

%
14

0
Financial targets
2013
Net sales

Growth to exceed market growth

+/-

Services net sales

>10% annual growth on average

-5%

Profitability (EBITA %)

11-16% before NRE

12.8%

Return on capital
employed (ROCE)

At least 30% (before taxes)

19.3%*

Earnings per share

To grow faster than net sales

Capital structure

Supporting a solid investment-grade
credit rating

BBB,
Baa2

Dividend payout

At least 50% of annual earnings per
share

63% **

11

© Metso

+

* Illustrative
** The Board proposes a dividend of EUR 1.00 per share, i.e. 63% of
earnings per share
Strategic development in 2013

Services

Technology
offering

Acquisitions and a new JV in China
Development of area organizations

Operational
excellence

Procurement and cost-efficiency actions
Gross profit improvement
Health and safety performance

People and
leadership

© Metso

Development of MetsoDNA automation platform
High-pressure grinding mill (HRC ™)
Cost efficient high pressure ball valve for demanding shut-down applications

Growth
countries

12

We became the only full-scope supplier of comminution wears (Sabo acquisition)
New services hubs opened and under construction
Good progress in life-cycle services

Leadership development
Share of personnel in emerging market increased to 46%
Performance culture
Financial performance
Harri Nikunen, CFO
Group key figures
EUR million

Q4/2013

Q4/2012

Change %

2013

2012

Change %

Orders received

885

982

-10

3,709

4 ,215

-12

Services orders received

457

494

-7

2,038

2,153

-5

1,018

1,132

-10

3,858

4,282

-10

509

550

-7

1,976

2,072

-5

50

49

51

48

147

138

496

486

14.4

12.2

12.8

11.4

108

125

423

458

1.59

1.71

Net sales
Services net sales
% of net sales
EBITA *
% of net sales
EBIT **

6

-14

Earnings per share, EUR

Non-recurring items excluded from EBITA
EUR million

Q4/2013

Q4/2012

2013

2012

24.1

11.2

23.9

13.2

Other

9.0

- 2.4

29.7

-2.5

Total

33

9

54

10.7

Restructuring

14

© Metso

* Before non-recurring items
** Q4/2013 includes non-recurring expenses of EUR 33 million and full-year 2013 EUR 54 million

0

-9
Group key figures
Balance sheet
2013

2012

Return on equity
(ROE), %

20.3

19.8

Return on capital employed
(ROCE) before taxes, %

19.3

20.1

Gearing at the end of the
period, %

41.6

24.5

•
•

15

Balance sheet structure is different after the demerger
About EUR 800 million of equity was transferred to Valmet

© Metso

Balance sheet figures for Metso’s continuing operations for 2012 are unaudited and illustrative. Accounting
principles were presented in a stock exchange release published on November 12, 2013
Indebtedness and net working capital
Net debt and gearing

Net working capital

EUR million

%
491

500

50

EUR million
700

%
18

692
627

41.6
400

600
16

40
500

15.9

16.0

316
300

30

24.5

200

20

14

400

300

12

200
100

10

10
100

0

2012

2013
Net debt

16

© Metso

Gearing

0

0

2012
Net working capital, EUR

Balance sheet figures for Metso’s continuing operations for 2012 are unaudited and illustrative.
Accounting principles were presented in a stock exchange release published on November 12, 2013

2013
NWC, as % of net sales

8
Mining and Construction key figures
EUR million
Orders received
without currency impact
Services orders received
Net sales
without currency impact
Services net sales
% of net sales
EBITA *
% of net sales
Return on capital
employed **

Q4/2013

Q4/2012

Change %

2013

2012

Change %

691

794

2,855

3,436

361
784

409
924

1,616
3,070

1,771
3,492

393
50
112
14.3

445
48
119
12.9

-13
-5
-12
-15
-8
-12

1,579
51
401
13.1

1,692
48
420
12.0

-17
-13
-9
-12
-8
-7

25.1

28.9

-6

Q4/2013 vs. Q4/2012

•

17

Gross margin improved

© Metso

* Before non-recurring items
** Excluding cash and other non-operative balance sheet items,
annualized

-5
Mining and Construction
Rolling 12-month net sales and EBITA%
%

EUR million
4,000

16

3,500

14

3,000

12

2,500

10

2,000

8

1,500

6

1,000

4

500

2

0

Q1

Q2

2007

Q3

Q4

2007

Q1

Q2

2008

Q3

Q4

2008

Q1

Q2

2009

Q3

Q4

2009

Q1

Q2

2010

Q3

Q4

2010

Q1

Q2

2011

Q3

Q4

2011

Q1

Q2

Q3

2012

Q4

2012

Q1

2013

Services net sales, rolling 12 months

© Metso

Capital net sales, Mining, rolling 12 months

Capital net sales, Construction, rolling 12 months

18

EBITA-% *, rolling 12 months

* Before non recurring items

Q2

Q3

Q4

2013

0
Automation key figures
EUR million
Orders received
without currency impact
Services orders received
Net sales
without currency impact
Services net sales
% of net sales
EBITA *
% of net sales
Return on capital
employed **

Q4/2013

Q4/2012

Change %

2013

2012

Change %

209

206

902

845

96
249

84
233

422
854

382
859

116
47
37
15.0

105
45
31
13.2

2
6
14
7
11
10

398
47
116
13.6

380
44
101
11.8

7
10
10
-1
2
5

38.5

31.8

22

Q4/2013 vs. Q4/2012

•
•

19

Improvement driven again by Flow Control
Services orders increased strongly, 14% year-on-year, 20% without currency impact

© Metso

* Before non-recurring items
** Excluding cash and other non-operative balance sheet items

15
Automation
Rolling 12-month net sales and EBITA%
EUR million

%

1,000

18

900

16

800

14

700

12

600

10

500
8

400

6

300

4

200

2

100
0

Q1

Q2

2007

Q3

Q4

2007

Q1

Q2

2008

Q3

Q4

2008

Services net sales, rolling 12 months

20

© Metso

Q1

Q2

2009

Q3

Q4

2009

Q1

Q2

2010

Q3

Q4

2010

Capital net sales, rolling 12 months

* Before non-recurring items

Q1

Q2

2011

Q3

Q4

2011

Q1

Q2

2012

Q3

Q4

2012

Q1

Q2

2013

Q3

Q4

2013

EBITA-% * before non-recurring items, rolling 12 months

0
EUR 100 million global efficiency program under way
• Fast track = A reduction of over 1000 persons identified. Total savings potential
between 2014 – 2015 is EUR100 – 130 million (including procurement)

-

•

About 40% of projects finalized with savings running

EUR 26.5 million of one-time costs were booked in 2013 with more to come in 2014
Savings from all projects to be achieved during Q4/2014 at the latest (except for 2015
procurement)

Structural and development projects -> additional savings

-

21

Most of the decisions for the remaining 60% have been taken with implementation in
2014. Savings coming in partially in 2014 and full impact in 2015

The”fast track” will be complemented with projects related to Metso’s legal and support
function structure. The action has been taken and results are expected during the
second half of 2014 and in 2015
Additional savings related to lower than expected demand from the mining industry
being planned
The scope of actions and more specific targets will be announced during Q1/2014

© Metso
Outlook and guidance
Matti Kähkönen

President and CEO
Market outlook
Mining

Construction

Automation

55% of net sales in 2013
55% service intensity

20% of net sales in 2013
40% service intensity

22% of net sales in 2013
45% service intensity

Current demand:
Weak for the equipment and project
business. Services good.

Current demand:
Satisfactory for the equipment and
services.

Current demand:
Good in oil & gas; satisfactory in pulp
& paper. Services good.

3-6 months market outlook (  )











Equipment

23


Services

Equipment

Services

Equipment

Services

© Metso
Order backlog
EUR million

EUR million
3,000

3,000
2,506

2,500

2,324
1,927

2,000

1,731

Deliveries
after 2013

2,000

Deliveries
after 2014
1,500

1,000

Deliveries in
2013

1,000

Deliveries in
2014

500

0

2010

2011

Mining and Construction

•
•
•
•
24

2012

2013

0

Order backlog Dec 31, 2012

Order backlog Dec 31, 2013

Automation

Opening backlog for 2014 was EUR 300 million lower than opening backlog for 2013
Services backlog is EUR 25 million down compared with last year
Automation backlog grew by EUR 49 million
Biggest drop in mining equipment and projects
© Metso
Guidance for 2014
Based on our market outlook, backlog for
2014, current exchange rates and
ongoing cost-efficiency actions, we
estimate that

• our net sales in 2014 will be
somewhat below 2013

• and EBITA margin before non

recurring items for 2014 will be at
around 12%

25

© Metso
www.metso.com

company/metso

metsoworld

metsogroup

metsoworld

metsogroup

Metso Financial Statements Review 2013 - presentation

  • 1.
    Fourth quarter andfull year 2013 results Matti Kähkönen, President and CEO Harri Nikunen, CFO February 6, 2014 © Metso www.metso.com
  • 2.
    Forward looking statements Itshould be noted that certain statements herein which are not historical facts, including, without limitation, those regarding expectations for general economic development and the market situation, expectations for customer industry profitability and investment willingness, expectations for company growth, development and profitability and the realization of synergy benefits and cost savings, and statements preceded by ”expects”, ”estimates”, ”forecasts” or similar expressions, are forward-looking statements. These statements are based on current decisions and plans and currently known factors. They involve risks and uncertainties which may cause the actual results to materially differ from the results currently expected by the company. Such factors include, but are not limited to: 1) general economic conditions, including fluctuations in exchange rates and interest levels which influence the operating environment and profitability of customers and thereby the orders received by the company and their margins 2) the competitive situation, especially significant technological solutions developed by competitors 3) the company’s own operating conditions, such as the success of production, product development and project management and their continuous development and improvement 4) the success of pending and future acquisitions and restructuring. 2 © Metso
  • 3.
    Content 1. Q4 andfull year 2013 highlights 2. Strategic development 3. Financial performance 4. Outlook and guidance 3 © Metso
  • 4.
    HSE (Health, Safety& Environment) An essential element in all our activities • We are committed to taking personal responsibility for our own safety and for the safety of others • We believe that all incidents can be prevented • We always emphasize our high HSE standards of conduct when dealing with customers, suppliers, and other stakeholders • We aim to minimize our environmental footprint throughout the entire value chain 4 © Metso Lost time incident frequency 16.0 14.0 12.0 10.0 8.0 6.0 4.0 2.0 0.0
  • 5.
    Q4 and fullyear 2013 highlights Matti Kähkönen President and CEO
  • 6.
    Highlights Full year 2013 • • Oil& gas-related demand was good - mining market was soft • Net sales were EUR 3,858 million (EUR 4,282 million), of which EUR 1,976 million (EUR 2,072 million) services sales • • • • EBITA before NRE was EUR 496 million, 12.8% of net sales (EUR 486 million, 11.4%) Orders received were EUR 3,709 million (EUR 4,215 million), of which EUR 2,038 million (2,153 million) services orders Non-recurring expenses totaled EUR 54 million Pulp, Paper and Power businesses were separated to Valmet Corporation The Board proposes a dividend of EUR 1.00 per share, i.e. 63% of earnings per share Fourth quarter 2013 • Orders received EUR 885 million (EUR 982 million), of which EUR 457 million (EUR 494 million) services orders • Net sales were EUR 1,018 million (EUR 1,132 million), of which EUR 509 million (EUR 550 million) services sales • • EBITA before NRE was EUR 147 million, 14.4% of net sales (EUR 138 million and 12.2%) 6 Non-recurring expenses totaled EUR 33 million © Metso Figures in the brackets refer to same period last yer unless otherwise stated
  • 7.
    Order intake Metso EUR million 1,600 EURmillion 5,000 1,466 1,400 1,117 1,200 1,000 767 800 600 558 550 563 1,168 1,100 1,055 826 850 838 828 825 637 885 3,000 2,307 2,000 1,000 2009 2010 2011 2012 Services orders received FY FY 250 224 225 220 225 200 177 177 174 159 179 167 197 FY FY 2010 2011 2012 Services orders received Capital orders received 2013 Mining and construction EUR million 1,400 254 134 FY 2009 EUR million 300 155 0 2013 Capital orders received Automation 239 1,263 1,200 914 200 209 1,000 191 206 800 129 600 100 400 50 0 3,709 3,281 1,031 968 965 982 200 150 4,215 4,000 400 0 4,466 608 414 423 449 660 686 688 964 886 891 787 794 786 651 635 491 200 2009 2010 2011 Services orders received 7 © Metso 2012 2013 Capital orders received 0 2009 2010 2011 Services orders received 743 2012 2013 Capital orders received 691
  • 8.
    Order intake intop 10 countries EUR million Country USA 2013 486 2012 580 Change % -16 % of total 13 China 317 265 19 8 Brazil 314 414 -24 8 Chile 245 177 38 7 Australia 213 283 -25 6 Finland 183 175 5 5 Sweden 163 201 -19 4 Canada 148 193 -24 4 Russia 141 300 -53 4 India 121 195 -38 3 • US is clearly our biggest market; orders declined in Mining and Construction, grew in Automation • • Orders from China increased in both segments 8 Emerging markets accounted for 56 percent (55%) of orders received and 52 percent (49%) of services orders received © Metso
  • 9.
    Net sales Metso EUR million EURmillion 1,600 5,000 4,282 1,400 1,156 1,200 1,132 1,116 1,075 1,018 988 959 937 915 4,000 800 871 901 898 735 746 685 736 647 726 748 2,902 FY 3,000 3,018 FY 2009 1,000 3,858 3,672 2010 Services net sales 744 2,000 600 400 1,000 200 0 2009 2011 2010 Services net sales Automation 0 2013 2012 Capital net sales 244 198 177 180 152 150 166 146 156 151 185 165 176 249 232 182 211 FY 2011 2012 Capital net sales EUR million 1,000 250 FY 2013 Mining and construction EUR million 300 200 FY 233 184 928 800 207 214 600 711 736 717 268 581 540 579 584 609 899 882 924 787 744 592 509 400 100 200 50 0 2009 9 2010 © Metso 2011 Services net sales 2012 Capital net sales 2013 0 2009 2010 2011 Services net sales 2012 Capital net sales 2013 800 742 784
  • 10.
    Profitability has developedwell % 18 EUR million 200 13.0 150 11.6 11.9 10.8 9.4 8.7 100 10.2 11.9 12.9 9.1 8.7 8.0 14.4 13.7 12.2 12.0 12.2 0 14 12 10 8.7 8 149 50 11.2 11.9 16 80 Q1 65 Q2 89 59 Q3 61 Q4 Q1 74 Q2 2009 EBITA*-% 86 Q3 2010 107 107 67 Q4 Q2 103 83 75 Q1 136 129 138 118 129 147 6 4 2 EBITA * Q3 2011 Q4 Q1 Q2 EBITA-% * Q3 Q4 2012 Q1 Q2 Q3 2013 EBITA-% target range Q4 0 600 500 12.8 10.1 10.9 8 300 486 200 292 328 496 399 6 4 100 2 0 FY FY FY FY FY 2009 2010 2011 2012 2013 EBITA * EBITA-% * Q4/2012 14.3 12.9 Improved gross margins in all businesses Automation 15.0 13.2 Good performance in the Flow Control business Metso total 14.4 12.2 Sales mix, cost savings * Before non-recurring items 12 10 Q4/2013 © Metso 11.4 400 Mining and Construction 10 10.9 % 14 0
  • 11.
    Financial targets 2013 Net sales Growthto exceed market growth +/- Services net sales >10% annual growth on average -5% Profitability (EBITA %) 11-16% before NRE 12.8% Return on capital employed (ROCE) At least 30% (before taxes) 19.3%* Earnings per share To grow faster than net sales Capital structure Supporting a solid investment-grade credit rating BBB, Baa2 Dividend payout At least 50% of annual earnings per share 63% ** 11 © Metso + * Illustrative ** The Board proposes a dividend of EUR 1.00 per share, i.e. 63% of earnings per share
  • 12.
    Strategic development in2013 Services Technology offering Acquisitions and a new JV in China Development of area organizations Operational excellence Procurement and cost-efficiency actions Gross profit improvement Health and safety performance People and leadership © Metso Development of MetsoDNA automation platform High-pressure grinding mill (HRC ™) Cost efficient high pressure ball valve for demanding shut-down applications Growth countries 12 We became the only full-scope supplier of comminution wears (Sabo acquisition) New services hubs opened and under construction Good progress in life-cycle services Leadership development Share of personnel in emerging market increased to 46% Performance culture
  • 13.
  • 14.
    Group key figures EURmillion Q4/2013 Q4/2012 Change % 2013 2012 Change % Orders received 885 982 -10 3,709 4 ,215 -12 Services orders received 457 494 -7 2,038 2,153 -5 1,018 1,132 -10 3,858 4,282 -10 509 550 -7 1,976 2,072 -5 50 49 51 48 147 138 496 486 14.4 12.2 12.8 11.4 108 125 423 458 1.59 1.71 Net sales Services net sales % of net sales EBITA * % of net sales EBIT ** 6 -14 Earnings per share, EUR Non-recurring items excluded from EBITA EUR million Q4/2013 Q4/2012 2013 2012 24.1 11.2 23.9 13.2 Other 9.0 - 2.4 29.7 -2.5 Total 33 9 54 10.7 Restructuring 14 © Metso * Before non-recurring items ** Q4/2013 includes non-recurring expenses of EUR 33 million and full-year 2013 EUR 54 million 0 -9
  • 15.
    Group key figures Balancesheet 2013 2012 Return on equity (ROE), % 20.3 19.8 Return on capital employed (ROCE) before taxes, % 19.3 20.1 Gearing at the end of the period, % 41.6 24.5 • • 15 Balance sheet structure is different after the demerger About EUR 800 million of equity was transferred to Valmet © Metso Balance sheet figures for Metso’s continuing operations for 2012 are unaudited and illustrative. Accounting principles were presented in a stock exchange release published on November 12, 2013
  • 16.
    Indebtedness and networking capital Net debt and gearing Net working capital EUR million % 491 500 50 EUR million 700 % 18 692 627 41.6 400 600 16 40 500 15.9 16.0 316 300 30 24.5 200 20 14 400 300 12 200 100 10 10 100 0 2012 2013 Net debt 16 © Metso Gearing 0 0 2012 Net working capital, EUR Balance sheet figures for Metso’s continuing operations for 2012 are unaudited and illustrative. Accounting principles were presented in a stock exchange release published on November 12, 2013 2013 NWC, as % of net sales 8
  • 17.
    Mining and Constructionkey figures EUR million Orders received without currency impact Services orders received Net sales without currency impact Services net sales % of net sales EBITA * % of net sales Return on capital employed ** Q4/2013 Q4/2012 Change % 2013 2012 Change % 691 794 2,855 3,436 361 784 409 924 1,616 3,070 1,771 3,492 393 50 112 14.3 445 48 119 12.9 -13 -5 -12 -15 -8 -12 1,579 51 401 13.1 1,692 48 420 12.0 -17 -13 -9 -12 -8 -7 25.1 28.9 -6 Q4/2013 vs. Q4/2012 • 17 Gross margin improved © Metso * Before non-recurring items ** Excluding cash and other non-operative balance sheet items, annualized -5
  • 18.
    Mining and Construction Rolling12-month net sales and EBITA% % EUR million 4,000 16 3,500 14 3,000 12 2,500 10 2,000 8 1,500 6 1,000 4 500 2 0 Q1 Q2 2007 Q3 Q4 2007 Q1 Q2 2008 Q3 Q4 2008 Q1 Q2 2009 Q3 Q4 2009 Q1 Q2 2010 Q3 Q4 2010 Q1 Q2 2011 Q3 Q4 2011 Q1 Q2 Q3 2012 Q4 2012 Q1 2013 Services net sales, rolling 12 months © Metso Capital net sales, Mining, rolling 12 months Capital net sales, Construction, rolling 12 months 18 EBITA-% *, rolling 12 months * Before non recurring items Q2 Q3 Q4 2013 0
  • 19.
    Automation key figures EURmillion Orders received without currency impact Services orders received Net sales without currency impact Services net sales % of net sales EBITA * % of net sales Return on capital employed ** Q4/2013 Q4/2012 Change % 2013 2012 Change % 209 206 902 845 96 249 84 233 422 854 382 859 116 47 37 15.0 105 45 31 13.2 2 6 14 7 11 10 398 47 116 13.6 380 44 101 11.8 7 10 10 -1 2 5 38.5 31.8 22 Q4/2013 vs. Q4/2012 • • 19 Improvement driven again by Flow Control Services orders increased strongly, 14% year-on-year, 20% without currency impact © Metso * Before non-recurring items ** Excluding cash and other non-operative balance sheet items 15
  • 20.
    Automation Rolling 12-month netsales and EBITA% EUR million % 1,000 18 900 16 800 14 700 12 600 10 500 8 400 6 300 4 200 2 100 0 Q1 Q2 2007 Q3 Q4 2007 Q1 Q2 2008 Q3 Q4 2008 Services net sales, rolling 12 months 20 © Metso Q1 Q2 2009 Q3 Q4 2009 Q1 Q2 2010 Q3 Q4 2010 Capital net sales, rolling 12 months * Before non-recurring items Q1 Q2 2011 Q3 Q4 2011 Q1 Q2 2012 Q3 Q4 2012 Q1 Q2 2013 Q3 Q4 2013 EBITA-% * before non-recurring items, rolling 12 months 0
  • 21.
    EUR 100 millionglobal efficiency program under way • Fast track = A reduction of over 1000 persons identified. Total savings potential between 2014 – 2015 is EUR100 – 130 million (including procurement) - • About 40% of projects finalized with savings running EUR 26.5 million of one-time costs were booked in 2013 with more to come in 2014 Savings from all projects to be achieved during Q4/2014 at the latest (except for 2015 procurement) Structural and development projects -> additional savings - 21 Most of the decisions for the remaining 60% have been taken with implementation in 2014. Savings coming in partially in 2014 and full impact in 2015 The”fast track” will be complemented with projects related to Metso’s legal and support function structure. The action has been taken and results are expected during the second half of 2014 and in 2015 Additional savings related to lower than expected demand from the mining industry being planned The scope of actions and more specific targets will be announced during Q1/2014 © Metso
  • 22.
    Outlook and guidance MattiKähkönen President and CEO
  • 23.
    Market outlook Mining Construction Automation 55% ofnet sales in 2013 55% service intensity 20% of net sales in 2013 40% service intensity 22% of net sales in 2013 45% service intensity Current demand: Weak for the equipment and project business. Services good. Current demand: Satisfactory for the equipment and services. Current demand: Good in oil & gas; satisfactory in pulp & paper. Services good. 3-6 months market outlook (  )      Equipment 23  Services Equipment Services Equipment Services © Metso
  • 24.
    Order backlog EUR million EURmillion 3,000 3,000 2,506 2,500 2,324 1,927 2,000 1,731 Deliveries after 2013 2,000 Deliveries after 2014 1,500 1,000 Deliveries in 2013 1,000 Deliveries in 2014 500 0 2010 2011 Mining and Construction • • • • 24 2012 2013 0 Order backlog Dec 31, 2012 Order backlog Dec 31, 2013 Automation Opening backlog for 2014 was EUR 300 million lower than opening backlog for 2013 Services backlog is EUR 25 million down compared with last year Automation backlog grew by EUR 49 million Biggest drop in mining equipment and projects © Metso
  • 25.
    Guidance for 2014 Basedon our market outlook, backlog for 2014, current exchange rates and ongoing cost-efficiency actions, we estimate that • our net sales in 2014 will be somewhat below 2013 • and EBITA margin before non recurring items for 2014 will be at around 12% 25 © Metso
  • 26.