Download as PDF, PPTX

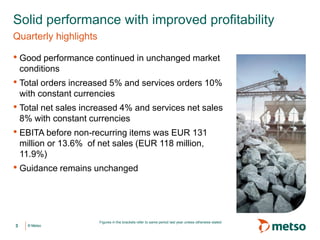
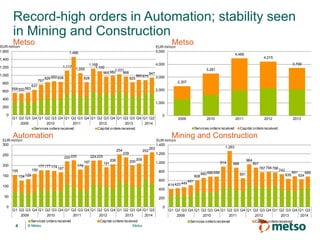
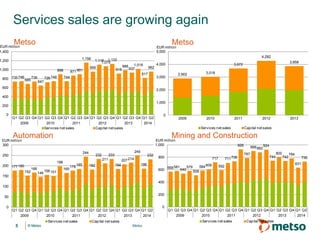
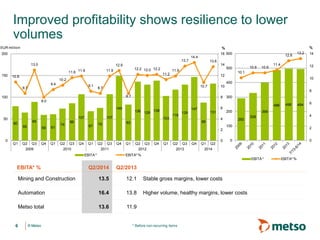
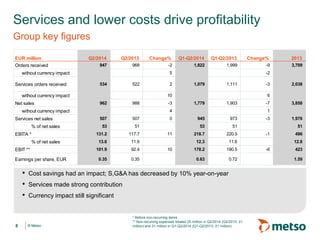
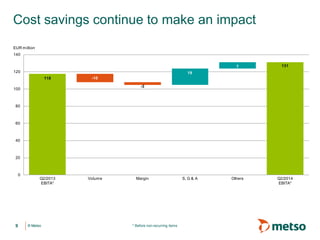
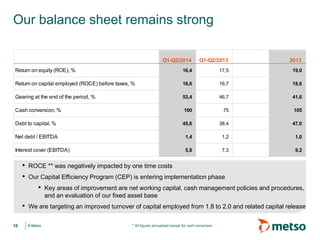
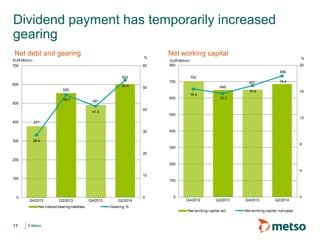
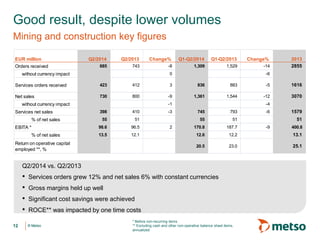
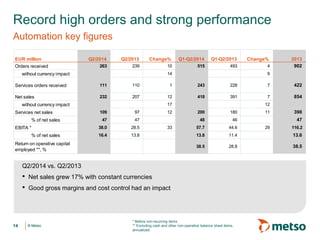


The document discusses Metso's financial results for the second quarter of 2014. Key points include: - Orders and sales increased year-over-year with constant currencies, driven by strong services growth. - Profitability improved due to cost savings, higher margins, and services contribution despite lower volumes. - Both the Mining and Construction and Automation segments reported higher orders and profitability compared to the previous year.


