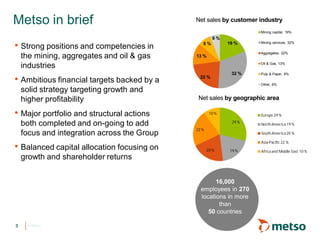
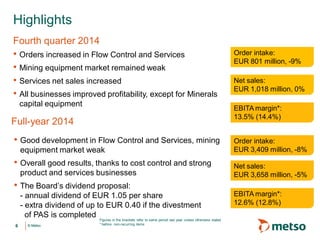
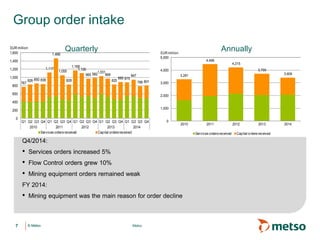
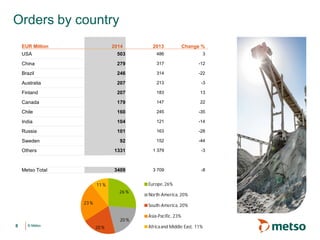
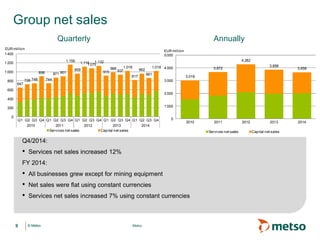
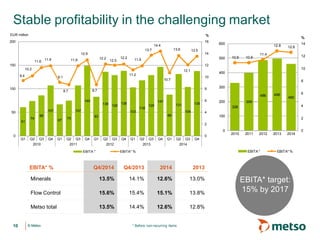
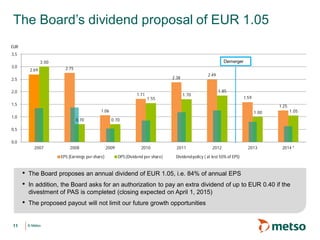
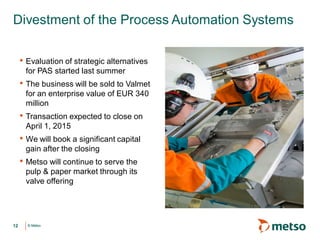
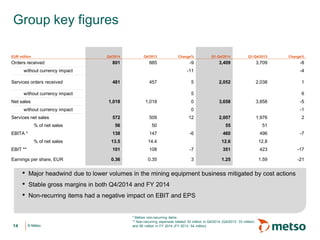
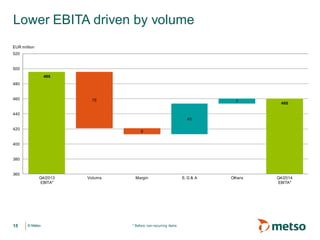
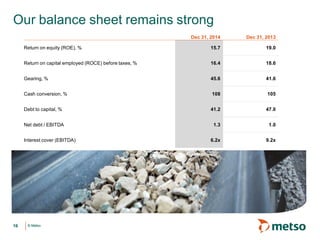
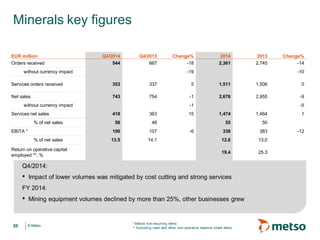
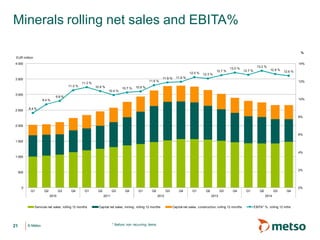
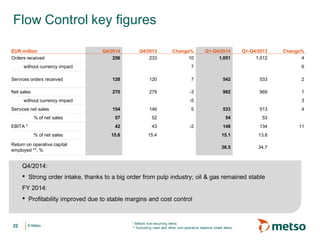
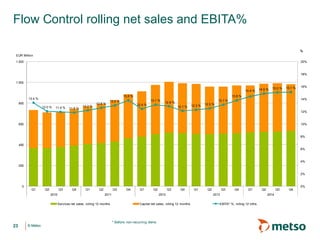
© Metso
Matti Kähkönen, President and CEO
Harri Nikunen, CFO
February 5, 2015
© Metso© Metso
Forward looking statements
It should be noted that certain statements herein which are not historical facts, including, without limitation,
those regarding expectations for general economic development and the market situation, expectations for
customer industry profitability and investment willingness, expectations for company growth, development
and profitability and the realization of synergy benefits and cost savings, and statements preceded by
”expects”, ”estimates”, ”forecasts” or similar expressions, are forward-looking statements. These
statements are based on current decisions and plans and currently known factors. They involve risks and
uncertainties which may cause the actual results to materially differ from the results currently expected by
the company.
Such factors include, but are not limited to:
1) general economic conditions, including fluctuations in exchange rates and interest levels which
influence the operating environment and profitability of customers and thereby the orders received by
the company and their margins
2) the competitive situation, especially significant technological solutions
developed by competitors
3) the company’s own operating conditions, such as the success of production, product development and
project management and their continuous development and improvement
4) the success of pending and future acquisitions and restructuring.
2
© Metso© Metso
Metso in brief
• Strong positions and competencies in
the mining, aggregates and oil & gas
industries
• Ambitious financial targets backed by a
solid strategy targeting growth and
higher profitability
• Major portfolio and structural actions
both completed and on-going to add
focus and integration across the Group
• Balanced capital allocation focusing on
growth and shareholder returns
Net sales by customer industry
Net sales by geographic area
© Metso
16,000
employees in 270
locations in more
than
50 countries
19 %
32 %
22 %
13 %
8 %
6 %
Mining capital, 19%
Mining services, 32%
Aggregates, 22%
Oil & Gas, 13%
Pulp & Paper, 8%
Other, 6%
29 %
19 %20 %
22 %
10 % Europe 29 %
North-America 19 %
South-America20 %
Asia-Pacific 22 %
Africaand Middle East 10 %
3
© Metso© Metso
Safety is our top priority
Continuous focus on our LTIF target of less than 1 leads to results
Actions leading to
improvement
• Active and visible
management support, follow
up and action plans
• Mindset development and
self audits
• Learning from every
incident
• Full compliance with
minimum safety standards
• Continuous development of
professional ability
Lost time incident frequency (LTIF)Number of LTI's
LTIF and number of LTI’s development
2010 through December 2014
* LTIF December 2014
Q4/09
Q1/10
Q2/10
Q3/10
Q4/10
Q1/11
Q2/11
Q3/11
Q4/11
Q1/12
Q2/12
Q3/12
Q4/12
Q1/13
Q2/13
Q3/13
Q4/13
Q1/14
Q2/14
Q3/14
Q4/14
3
5
7
9
11
13
15
50
100
150
200
250
300
350
400
450
Total number of lost time incidents (LTI)
Lost time incident frequency (LTIF)
LTIF
3.8 *
4
© Metso© Metso
Strategic achievements in 2014
Targeting growth and higher profitability
*excluding non-recurring expenses
Growth Profitability Capital efficiency
• Services and Flow
Control continued to
grow
• 8 new service centers
opened
• New valve technology
center opened in South
Korea
• Local capabilities
strengthened across all
market areas
• Ongoing product renewal
• S,G&A reduced 6%*
• Headcount reduced 5%
• Footprint rationalization
in the mining equipment
business
• Procurement savings
• Simplification of the
Group’s legal structure
• Launch of Capital
Efficiency Program
• Balance sheet
management culture
strengthened
• Cash policy redefined
• Strict capex policy
(capex below
depreciation and
amortization)
• Development of asset-
light business models
5
© Metso© Metso
• Orders increased in Flow Control and Services
• Mining equipment market remained weak
• Services net sales increased
• All businesses improved profitability, except for Minerals
capital equipment
Highlights
Fourth quarter 2014
Figures in the brackets refer to same period last year unless otherwise stated
* before non-recurring items
Full-year 2014
• Good development in Flow Control and Services, mining
equipment market weak
• Overall good results, thanks to cost control and strong
product and services businesses
• The Board’s dividend proposal:
- annual dividend of EUR 1.05 per share
- extra dividend of up to EUR 0.40 if the divestment
of PAS is completed
Order intake:
EUR 801 million, -9%
Order intake:
EUR 3,409 million, -8%
Net sales:
EUR 3,658 million, -5%
EBITA margin*:
12.6% (12.8%)
Net sales:
EUR 1,018 million, 0%
EBITA margin*:
13.5% (14.4%)
6
© Metso© Metso Metso
Group order intake
767
826 850 838
1,117
1,466
1,055
828
1,168
1,100
965 982
1,031
968
825
885 875
947
786 801
0
200
400
600
800
1,000
1,200
1,400
1,600
Q1 Q2 Q3 Q4 Q1 Q2 Q3 Q4 Q1 Q2 Q3 Q4 Q1 Q2 Q3 Q4 Q1 Q2 Q3 Q4
2010 2011 2012 2013 2014
EUR million
Services ordersreceived Capital ordersreceived
3,281
4,466
4,215
3,709
3,409
0
1,000
2,000
3,000
4,000
5,000
2010 2011 2012 2013 2014
EUR million
Services ordersreceived Capital ordersreceived
Q4/2014:
• Services orders increased 5%
• Flow Control orders grew 10%
• Mining equipment orders remained weak
FY 2014:
• Mining equipment was the main reason for order decline
Quarterly Annually
7
© Metso© Metso
Orders by country
26 %
20 %
20 %
23 %
11 % Europe,26%
North-America, 20%
South-America, 20%
Asia-Pacific, 23%
Africaand Middle East, 11%8
EUR Million
USA
China
Brazil
Australia
Finland
Canada
Chile
India
Russia
Sweden
Others
Metso Total
2014 2013 Change %
503 486 3
279 317 -12
246 314 -22
207 213 -3
207 183 13
179 147 22
160 245 -35
104 121 -14
101 163 -28
92 152 -44
1331 1 379 -3
3409 3 709 -8
© Metso© Metso Metso
Group net sales
Q4/2014:
• Services net sales increased 12%
FY 2014:
• All businesses grew except for mining equipment
• Net sales were flat using constant currencies
• Services net sales increased 7% using constant currencies
Quarterly Annually
647
726 748
898
744
871 901
1,156
959
1,1161 075
1,132
915
988
937
1,018
817
962
861
1,018
0
200
400
600
800
1 000
1 200
1 400
Q1 Q2 Q3 Q4 Q1 Q2 Q3 Q4 Q1 Q2 Q3 Q4 Q1 Q2 Q3 Q4 Q1 Q2 Q3 Q4
2010 2011 2012 2013 2014
EUR million
Services net sales Capital net sales
3,018
3,672
4,282
3,858
3,658
0
1 000
2 000
3 000
4 000
5 000
2010 2011 2012 2013 2014
EUR million
Services net sales Capital net sales
9
© Metso© Metso * Before non-recurring items
Stable profitability in the challenging market
EBITA* % Q4/2014 Q4/2013 2014 2013
Minerals 13.5% 14.1% 12.6% 13.0%
Flow Control 15.6% 15.4% 15.1% 13.8%
Metso total 13.5% 14.4% 12.6% 12.8%
EBITA* target:
15% by 2017
328
399
486 496
460
10.9 10.9
11.4
12.8 12.6
0
2
4
6
8
10
12
14
0
100
200
300
400
500
600
2010 2011 2012 2013 2014
%
EBITA* EBITA* %
61
74
86
107
67
75
107
149
83
136 129
138
103
118
129
147
88
131
104
138
9.4
10.2
11.6
11.9
9.1
8.7
11,9
12.9
8.7
12.2
12.0
12.2
11.2
11.9
13.7
14.4
10.7
13.6
12.1
13.5
0
2
4
6
8
10
12
14
16
0
50
100
150
200
Q1 Q2 Q3 Q4 Q1 Q2 Q3 Q4 Q1 Q2 Q3 Q4 Q1 Q2 Q3 Q4 Q1 Q2 Q3 Q4
2010 2011 2012 2013 2014
%EUR million
EBITA * EBITA* %
10
© Metso© Metso
The Board’s dividend proposal of EUR 1.05
• The Board proposes an annual dividend of EUR 1.05, i.e. 84% of annual EPS
• In addition, the Board asks for an authorization to pay an extra dividend of up to EUR 0.40 if the
divestment of PAS is completed (closing expected on April 1, 2015)
• The proposed payout will not limit our future growth opportunities
Demerger
2.69 2.75
1.06
1.71
2.38
2.49
1.59
1.25
3.00
0.70 0.70
1.55
1.70
1.85
1.00 1.05
0,0
0,5
1,0
1,5
2,0
2,5
3,0
3,5
2007 2008 2009 2010 2011 2012 2013 2014 *
EUR
EPS (Earnings per share) DPS (Dividend per share) Dividend policy ( at lest 50% of EPS)
11
© Metso© Metso
Divestment of the Process Automation Systems
• Evaluation of strategic alternatives
for PAS started last summer
• The business will be sold to Valmet
for an enterprise value of EUR 340
million
• Transaction expected to close on
April 1, 2015
• We will book a significant capital
gain after the closing
• Metso will continue to serve the
pulp & paper market through its
valve offering
12
Harri Nikunen
CFO
Financial
performance
© Metso© Metso
Group key figures
* Before non-recurring items
** Non-recurring expenses totaled 32 million in Q4/2014 (Q4/2013: 33 million)
and 90 million in FY 2014 (FY 2013: 54 million)
• Major headwind due to lower volumes in the mining equipment business mitigated by cost actions
• Stable gross margins in both Q4/2014 and FY 2014
• Non-recurring items had a negative impact on EBIT and EPS
EUR million Q4/2014 Q4/2013 Change% Q1-Q4/2014 Q1-Q4/2013 Change%
Orders received 801 885 -9 3,409 3,709 -8
without currency impact -11 -4
Services orders received 481 457 5 2,052 2,038 1
without currency impact 5 6
Net sales 1,018 1,018 0 3,658 3,858 -5
without currency impact 0 -1
Services net sales 572 509 12 2,007 1,976 2
% of net sales 56 50 55 51
EBITA * 138 147 -6 460 496 -7
% of net sales 13.5 14.4 12.6 12.8
EBIT ** 101 108 -7 351 423 -17
Earnings per share, EUR 0.36 0.35 3 1.25 1.59 -21
14
© Metso© Metso
Lower EBITA driven by volume
* Before non-recurring items
496
460
75
8
40
7
360
380
400
420
440
460
480
500
520
Q4/2013
EBITA*
Volume Margin S, G & A Others Q4/2014
EBITA*
EUR million
15
© Metso© Metso
Our balance sheet remains strong
Dec 31, 2014 Dec 31, 2013
Return on equity (ROE), % 15.7 19.0
Return on capital employed (ROCE) before taxes, % 16.4 18.6
Gearing, % 45.6 41.6
Cash conversion, % 108 105
Debt to capital, % 41.2 47.0
Net debt / EBITDA 1.3 1.0
Interest cover (EBITDA) 6.2x 9.2x
16
© Metso© Metso
Capital employed development in 2014
Dec 31, 2013 Dec 31, 2014 Comments
Capital employed (MEUR) 2,230 2,092
turnover 1.7 1.7
Capital expenditure (MEUR) 95 74 2014 below depreciation and
amortization
Total net working capital
(MEUR)
651 709 Increase in non-operational
assets
Net working capital
operational (MEUR)
1,006 1,009 Improved inventory and
receivables performance.
Negative impact of declining
project business
Net working capital
operational as % net sales
26.1% 27.5%
Cash (MEUR) 467 279
17
© Metso© Metso
Funding is well in place
Corporate level funding facilities
• EUR 1.5 billion EMTN program
• EUR 400 million 2.75% bond due in 2019
• EUR 170 million private placements due in 2018
– 2022
• Bilateral long-term loans: EUR 215 million
• Committed EUR 500 million 5-year syndicated
revolving credit facility available until 2019 with
two extension options for one year
- currently undrawn
• EUR 500 million domestic CP program
• Uncommitted lines of credit
• Stable credit outlook and rating maintained:
- Standard & Poor’s: BBB
- Moody’s: Baa2
18
© Metso© Metso
Our maturity profile is healthy
No major refinancing needs short term
0
200
400
600
800
1000
1200
1400
1600
1800
2000
1.1.2011 09/2011 06/2012 03/2013 12/2013 9/2014 06/2015 03/2016 12/2016 09/2017 06/2018 03/2019 12/2019
Maturities monthly >
December 2014
MEUR
Euro Bond 2011
Euro Bond 2019
Euro Bond 2014 Private Placements
Other long-term Debt
Short-term Debt
Undrawn Committed Facilities
Syndicated term Loan
19
© Metso© Metso
Minerals key figures
* Before non-recurring items
** Excluding cash and other non-operative balance sheet items,
Q4/2014:
• Impact of lower volumes was mitigated by cost cutting and strong services
FY 2014:
• Mining equipment volumes declined by more than 25%, other businesses grew
EUR million Q4/2014 Q4/2013 Change% 2014 2013 Change%
Orders received 544 667 -18 2,361 2,745 -14
without currency impact -19 -10
Services orders received 353 337 5 1,511 1,506 0
Net sales 743 754 -1 2,676 2,955 -9
without currency impact -1 -5
Services net sales 418 363 15 1,474 1,464 1
% of net sales 56 48 55 50
EBITA * 100 107 -6 338 383 -12
% of net sales 13.5 14.1 12.6 13.0
Return on operative capital
employed **, %
19.4 25.3
20
© Metso© Metso
Minerals rolling net sales and EBITA%
* Before non recurring items
8.4 %
9.4 %
9.8 %
11.0 %
11.3 %
10.9 %
10.4 %
10.7 % 10.9 %
11.6 %
11.9 % 11.9 %
12.5 % 12.3 %
12.7 %
13.0 %
12.7 %
13.2 %
12.8 %
12.6 %
0%
2%
4%
6%
8%
10%
12%
14%
0
500
1 000
1 500
2 000
2 500
3 000
3 500
4 000
Q1 Q2 Q3 Q4 Q1 Q2 Q3 Q4 Q1 Q2 Q3 Q4 Q1 Q2 Q3 Q4 Q1 Q2 Q3 Q4
2010 2011 2012 2013 2014
%
EUR million
Services net sales, rolling 12 months Capital net sales, mining, rolling 12 months Capital net sales, construction, rolling 12 months EBITA* %, rolling 12 mths
21
© Metso© Metso
Flow Control key figures
* Before non-recurring items
** Excluding cash and other non-operative balance sheet items,
Q4/2014:
• Strong order intake, thanks to a big order from pulp industry; oil & gas remained stable
FY 2014:
• Profitability improved due to stable margins and cost control
EUR million Q4/2014 Q4/2013 Change% Q1-Q4/2014 Q1-Q4/2013 Change%
Orders received 256 233 10 1,051 1,012 4
without currency impact 7 6
Services orders received 128 120 7 542 533 2
Net sales 270 279 -3 982 969 1
without currency impact -5 3
Services net sales 154 146 5 533 513 4
% of net sales 57 52 54 53
EBITA * 42 43 -2 148 134 11
% of net sales 15.6 15.4 15.1 13.8
Return on operative capital
employed **, %
36.5 34.7
22
© Metso© Metso
Flow Control rolling net sales and EBITA%
* Before non-recurring items
13.4 %
12.0 % 11.9 % 11.8 %
12.2 %
12.6 %
13.0 %
13.8 %
12.4 %
13.1 %
12.8 %
12.1 % 12.3 % 12.5 %
13.1 %
13.8 %
14.4 % 14.9 % 15.0 % 15.1 %
0%
2%
4%
6%
8%
10%
12%
14%
16%
18%
20%
0
200
400
600
800
1 000
1 200
Q1 Q2 Q3 Q4 Q1 Q2 Q3 Q4 Q1 Q2 Q3 Q4 Q1 Q2 Q3 Q4 Q1 Q2 Q3 Q4
2010 2011 2012 2013 2014
%
EUR Million
Services net sales, rolling 12 months Capital net sales, rolling 12 months EBITA* %, rolling 12 mths
23
Matti Kähkönen
President and CEO
Outlook and guidance
© Metso© Metso
24% of net sales
of which 45% services
Current demand:
• Good in oil and gas with increased
uncertainties due to the oil price;
satisfactory in pulp and paper
• Services good
Market outlook unchanged but challenging
52% of net sales
of which 60% services
Current demand:
• Weak for the equipment and
project business
• Services good
21% of net sales
of which 40% services
Current demand:
• Satisfactory for equipment and good
for services
3-6 months market outlook
Equipment Services Equipment Services Equipment Services
Mining Aggregates Flow Control
25
© Metso© Metso
Order backlog
• Flow Control backlog 19% higher than a year ago
• Minerals services backlog at the same level
• Deliveries for 2015 stand at a little below EUR 1.4 billion
Deliveries in 2015
Deliveries after
2015
Deliveries in 2014
Deliveries after
2014
0
200
400
600
800
1000
1200
1400
1600
1800
2000
Order backlog Dec 31, 2013 Order backlog Dec 31, 2014
EUR million
Flow ControlMinerals, servicesMinerals, capital
2 010
1 364
1 730
2 506
2 324
1 927
1 575
0
1 000
2 000
3 000
Q4 Q4 Q4 Q4 Q4 Q4 Q4
2008 2009 2010 2011 2012 2013 2014
EUR Million
26
© Metso© Metso *before non-recurring items
The guidance for 2015 is based on the current
market activity in our customer industries, our
current backlog for 2015, and the current exchange
rates.
In addition, the divestment of our Process
Automation Systems business is expected to be
completed on April 1, 2015. Annual net sales of the
Process Automation Systems business is about
EUR 300 million.
We estimate that
• our net sales in 2015 will be between EUR
3,000 and 3,300 and
• our EBITA margin* before non- recurring
items for 2015 will be around 13%.
Guidance for 2015
Excluding the Process Automation Systems business
27
company/metso metsogroup metsoworldmetsoworld metsogroup
www.metso.com

Metso Financial Statements Review 2014: presentation

  • 1.
    © Metso Matti Kähkönen,President and CEO Harri Nikunen, CFO February 5, 2015
  • 2.
    © Metso© Metso Forwardlooking statements It should be noted that certain statements herein which are not historical facts, including, without limitation, those regarding expectations for general economic development and the market situation, expectations for customer industry profitability and investment willingness, expectations for company growth, development and profitability and the realization of synergy benefits and cost savings, and statements preceded by ”expects”, ”estimates”, ”forecasts” or similar expressions, are forward-looking statements. These statements are based on current decisions and plans and currently known factors. They involve risks and uncertainties which may cause the actual results to materially differ from the results currently expected by the company. Such factors include, but are not limited to: 1) general economic conditions, including fluctuations in exchange rates and interest levels which influence the operating environment and profitability of customers and thereby the orders received by the company and their margins 2) the competitive situation, especially significant technological solutions developed by competitors 3) the company’s own operating conditions, such as the success of production, product development and project management and their continuous development and improvement 4) the success of pending and future acquisitions and restructuring. 2
  • 3.
    © Metso© Metso Metsoin brief • Strong positions and competencies in the mining, aggregates and oil & gas industries • Ambitious financial targets backed by a solid strategy targeting growth and higher profitability • Major portfolio and structural actions both completed and on-going to add focus and integration across the Group • Balanced capital allocation focusing on growth and shareholder returns Net sales by customer industry Net sales by geographic area © Metso 16,000 employees in 270 locations in more than 50 countries 19 % 32 % 22 % 13 % 8 % 6 % Mining capital, 19% Mining services, 32% Aggregates, 22% Oil & Gas, 13% Pulp & Paper, 8% Other, 6% 29 % 19 %20 % 22 % 10 % Europe 29 % North-America 19 % South-America20 % Asia-Pacific 22 % Africaand Middle East 10 % 3
  • 4.
    © Metso© Metso Safetyis our top priority Continuous focus on our LTIF target of less than 1 leads to results Actions leading to improvement • Active and visible management support, follow up and action plans • Mindset development and self audits • Learning from every incident • Full compliance with minimum safety standards • Continuous development of professional ability Lost time incident frequency (LTIF)Number of LTI's LTIF and number of LTI’s development 2010 through December 2014 * LTIF December 2014 Q4/09 Q1/10 Q2/10 Q3/10 Q4/10 Q1/11 Q2/11 Q3/11 Q4/11 Q1/12 Q2/12 Q3/12 Q4/12 Q1/13 Q2/13 Q3/13 Q4/13 Q1/14 Q2/14 Q3/14 Q4/14 3 5 7 9 11 13 15 50 100 150 200 250 300 350 400 450 Total number of lost time incidents (LTI) Lost time incident frequency (LTIF) LTIF 3.8 * 4
  • 5.
    © Metso© Metso Strategicachievements in 2014 Targeting growth and higher profitability *excluding non-recurring expenses Growth Profitability Capital efficiency • Services and Flow Control continued to grow • 8 new service centers opened • New valve technology center opened in South Korea • Local capabilities strengthened across all market areas • Ongoing product renewal • S,G&A reduced 6%* • Headcount reduced 5% • Footprint rationalization in the mining equipment business • Procurement savings • Simplification of the Group’s legal structure • Launch of Capital Efficiency Program • Balance sheet management culture strengthened • Cash policy redefined • Strict capex policy (capex below depreciation and amortization) • Development of asset- light business models 5
  • 6.
    © Metso© Metso •Orders increased in Flow Control and Services • Mining equipment market remained weak • Services net sales increased • All businesses improved profitability, except for Minerals capital equipment Highlights Fourth quarter 2014 Figures in the brackets refer to same period last year unless otherwise stated * before non-recurring items Full-year 2014 • Good development in Flow Control and Services, mining equipment market weak • Overall good results, thanks to cost control and strong product and services businesses • The Board’s dividend proposal: - annual dividend of EUR 1.05 per share - extra dividend of up to EUR 0.40 if the divestment of PAS is completed Order intake: EUR 801 million, -9% Order intake: EUR 3,409 million, -8% Net sales: EUR 3,658 million, -5% EBITA margin*: 12.6% (12.8%) Net sales: EUR 1,018 million, 0% EBITA margin*: 13.5% (14.4%) 6
  • 7.
    © Metso© MetsoMetso Group order intake 767 826 850 838 1,117 1,466 1,055 828 1,168 1,100 965 982 1,031 968 825 885 875 947 786 801 0 200 400 600 800 1,000 1,200 1,400 1,600 Q1 Q2 Q3 Q4 Q1 Q2 Q3 Q4 Q1 Q2 Q3 Q4 Q1 Q2 Q3 Q4 Q1 Q2 Q3 Q4 2010 2011 2012 2013 2014 EUR million Services ordersreceived Capital ordersreceived 3,281 4,466 4,215 3,709 3,409 0 1,000 2,000 3,000 4,000 5,000 2010 2011 2012 2013 2014 EUR million Services ordersreceived Capital ordersreceived Q4/2014: • Services orders increased 5% • Flow Control orders grew 10% • Mining equipment orders remained weak FY 2014: • Mining equipment was the main reason for order decline Quarterly Annually 7
  • 8.
    © Metso© Metso Ordersby country 26 % 20 % 20 % 23 % 11 % Europe,26% North-America, 20% South-America, 20% Asia-Pacific, 23% Africaand Middle East, 11%8 EUR Million USA China Brazil Australia Finland Canada Chile India Russia Sweden Others Metso Total 2014 2013 Change % 503 486 3 279 317 -12 246 314 -22 207 213 -3 207 183 13 179 147 22 160 245 -35 104 121 -14 101 163 -28 92 152 -44 1331 1 379 -3 3409 3 709 -8
  • 9.
    © Metso© MetsoMetso Group net sales Q4/2014: • Services net sales increased 12% FY 2014: • All businesses grew except for mining equipment • Net sales were flat using constant currencies • Services net sales increased 7% using constant currencies Quarterly Annually 647 726 748 898 744 871 901 1,156 959 1,1161 075 1,132 915 988 937 1,018 817 962 861 1,018 0 200 400 600 800 1 000 1 200 1 400 Q1 Q2 Q3 Q4 Q1 Q2 Q3 Q4 Q1 Q2 Q3 Q4 Q1 Q2 Q3 Q4 Q1 Q2 Q3 Q4 2010 2011 2012 2013 2014 EUR million Services net sales Capital net sales 3,018 3,672 4,282 3,858 3,658 0 1 000 2 000 3 000 4 000 5 000 2010 2011 2012 2013 2014 EUR million Services net sales Capital net sales 9
  • 10.
    © Metso© Metso* Before non-recurring items Stable profitability in the challenging market EBITA* % Q4/2014 Q4/2013 2014 2013 Minerals 13.5% 14.1% 12.6% 13.0% Flow Control 15.6% 15.4% 15.1% 13.8% Metso total 13.5% 14.4% 12.6% 12.8% EBITA* target: 15% by 2017 328 399 486 496 460 10.9 10.9 11.4 12.8 12.6 0 2 4 6 8 10 12 14 0 100 200 300 400 500 600 2010 2011 2012 2013 2014 % EBITA* EBITA* % 61 74 86 107 67 75 107 149 83 136 129 138 103 118 129 147 88 131 104 138 9.4 10.2 11.6 11.9 9.1 8.7 11,9 12.9 8.7 12.2 12.0 12.2 11.2 11.9 13.7 14.4 10.7 13.6 12.1 13.5 0 2 4 6 8 10 12 14 16 0 50 100 150 200 Q1 Q2 Q3 Q4 Q1 Q2 Q3 Q4 Q1 Q2 Q3 Q4 Q1 Q2 Q3 Q4 Q1 Q2 Q3 Q4 2010 2011 2012 2013 2014 %EUR million EBITA * EBITA* % 10
  • 11.
    © Metso© Metso TheBoard’s dividend proposal of EUR 1.05 • The Board proposes an annual dividend of EUR 1.05, i.e. 84% of annual EPS • In addition, the Board asks for an authorization to pay an extra dividend of up to EUR 0.40 if the divestment of PAS is completed (closing expected on April 1, 2015) • The proposed payout will not limit our future growth opportunities Demerger 2.69 2.75 1.06 1.71 2.38 2.49 1.59 1.25 3.00 0.70 0.70 1.55 1.70 1.85 1.00 1.05 0,0 0,5 1,0 1,5 2,0 2,5 3,0 3,5 2007 2008 2009 2010 2011 2012 2013 2014 * EUR EPS (Earnings per share) DPS (Dividend per share) Dividend policy ( at lest 50% of EPS) 11
  • 12.
    © Metso© Metso Divestmentof the Process Automation Systems • Evaluation of strategic alternatives for PAS started last summer • The business will be sold to Valmet for an enterprise value of EUR 340 million • Transaction expected to close on April 1, 2015 • We will book a significant capital gain after the closing • Metso will continue to serve the pulp & paper market through its valve offering 12
  • 13.
  • 14.
    © Metso© Metso Groupkey figures * Before non-recurring items ** Non-recurring expenses totaled 32 million in Q4/2014 (Q4/2013: 33 million) and 90 million in FY 2014 (FY 2013: 54 million) • Major headwind due to lower volumes in the mining equipment business mitigated by cost actions • Stable gross margins in both Q4/2014 and FY 2014 • Non-recurring items had a negative impact on EBIT and EPS EUR million Q4/2014 Q4/2013 Change% Q1-Q4/2014 Q1-Q4/2013 Change% Orders received 801 885 -9 3,409 3,709 -8 without currency impact -11 -4 Services orders received 481 457 5 2,052 2,038 1 without currency impact 5 6 Net sales 1,018 1,018 0 3,658 3,858 -5 without currency impact 0 -1 Services net sales 572 509 12 2,007 1,976 2 % of net sales 56 50 55 51 EBITA * 138 147 -6 460 496 -7 % of net sales 13.5 14.4 12.6 12.8 EBIT ** 101 108 -7 351 423 -17 Earnings per share, EUR 0.36 0.35 3 1.25 1.59 -21 14
  • 15.
    © Metso© Metso LowerEBITA driven by volume * Before non-recurring items 496 460 75 8 40 7 360 380 400 420 440 460 480 500 520 Q4/2013 EBITA* Volume Margin S, G & A Others Q4/2014 EBITA* EUR million 15
  • 16.
    © Metso© Metso Ourbalance sheet remains strong Dec 31, 2014 Dec 31, 2013 Return on equity (ROE), % 15.7 19.0 Return on capital employed (ROCE) before taxes, % 16.4 18.6 Gearing, % 45.6 41.6 Cash conversion, % 108 105 Debt to capital, % 41.2 47.0 Net debt / EBITDA 1.3 1.0 Interest cover (EBITDA) 6.2x 9.2x 16
  • 17.
    © Metso© Metso Capitalemployed development in 2014 Dec 31, 2013 Dec 31, 2014 Comments Capital employed (MEUR) 2,230 2,092 turnover 1.7 1.7 Capital expenditure (MEUR) 95 74 2014 below depreciation and amortization Total net working capital (MEUR) 651 709 Increase in non-operational assets Net working capital operational (MEUR) 1,006 1,009 Improved inventory and receivables performance. Negative impact of declining project business Net working capital operational as % net sales 26.1% 27.5% Cash (MEUR) 467 279 17
  • 18.
    © Metso© Metso Fundingis well in place Corporate level funding facilities • EUR 1.5 billion EMTN program • EUR 400 million 2.75% bond due in 2019 • EUR 170 million private placements due in 2018 – 2022 • Bilateral long-term loans: EUR 215 million • Committed EUR 500 million 5-year syndicated revolving credit facility available until 2019 with two extension options for one year - currently undrawn • EUR 500 million domestic CP program • Uncommitted lines of credit • Stable credit outlook and rating maintained: - Standard & Poor’s: BBB - Moody’s: Baa2 18
  • 19.
    © Metso© Metso Ourmaturity profile is healthy No major refinancing needs short term 0 200 400 600 800 1000 1200 1400 1600 1800 2000 1.1.2011 09/2011 06/2012 03/2013 12/2013 9/2014 06/2015 03/2016 12/2016 09/2017 06/2018 03/2019 12/2019 Maturities monthly > December 2014 MEUR Euro Bond 2011 Euro Bond 2019 Euro Bond 2014 Private Placements Other long-term Debt Short-term Debt Undrawn Committed Facilities Syndicated term Loan 19
  • 20.
    © Metso© Metso Mineralskey figures * Before non-recurring items ** Excluding cash and other non-operative balance sheet items, Q4/2014: • Impact of lower volumes was mitigated by cost cutting and strong services FY 2014: • Mining equipment volumes declined by more than 25%, other businesses grew EUR million Q4/2014 Q4/2013 Change% 2014 2013 Change% Orders received 544 667 -18 2,361 2,745 -14 without currency impact -19 -10 Services orders received 353 337 5 1,511 1,506 0 Net sales 743 754 -1 2,676 2,955 -9 without currency impact -1 -5 Services net sales 418 363 15 1,474 1,464 1 % of net sales 56 48 55 50 EBITA * 100 107 -6 338 383 -12 % of net sales 13.5 14.1 12.6 13.0 Return on operative capital employed **, % 19.4 25.3 20
  • 21.
    © Metso© Metso Mineralsrolling net sales and EBITA% * Before non recurring items 8.4 % 9.4 % 9.8 % 11.0 % 11.3 % 10.9 % 10.4 % 10.7 % 10.9 % 11.6 % 11.9 % 11.9 % 12.5 % 12.3 % 12.7 % 13.0 % 12.7 % 13.2 % 12.8 % 12.6 % 0% 2% 4% 6% 8% 10% 12% 14% 0 500 1 000 1 500 2 000 2 500 3 000 3 500 4 000 Q1 Q2 Q3 Q4 Q1 Q2 Q3 Q4 Q1 Q2 Q3 Q4 Q1 Q2 Q3 Q4 Q1 Q2 Q3 Q4 2010 2011 2012 2013 2014 % EUR million Services net sales, rolling 12 months Capital net sales, mining, rolling 12 months Capital net sales, construction, rolling 12 months EBITA* %, rolling 12 mths 21
  • 22.
    © Metso© Metso FlowControl key figures * Before non-recurring items ** Excluding cash and other non-operative balance sheet items, Q4/2014: • Strong order intake, thanks to a big order from pulp industry; oil & gas remained stable FY 2014: • Profitability improved due to stable margins and cost control EUR million Q4/2014 Q4/2013 Change% Q1-Q4/2014 Q1-Q4/2013 Change% Orders received 256 233 10 1,051 1,012 4 without currency impact 7 6 Services orders received 128 120 7 542 533 2 Net sales 270 279 -3 982 969 1 without currency impact -5 3 Services net sales 154 146 5 533 513 4 % of net sales 57 52 54 53 EBITA * 42 43 -2 148 134 11 % of net sales 15.6 15.4 15.1 13.8 Return on operative capital employed **, % 36.5 34.7 22
  • 23.
    © Metso© Metso FlowControl rolling net sales and EBITA% * Before non-recurring items 13.4 % 12.0 % 11.9 % 11.8 % 12.2 % 12.6 % 13.0 % 13.8 % 12.4 % 13.1 % 12.8 % 12.1 % 12.3 % 12.5 % 13.1 % 13.8 % 14.4 % 14.9 % 15.0 % 15.1 % 0% 2% 4% 6% 8% 10% 12% 14% 16% 18% 20% 0 200 400 600 800 1 000 1 200 Q1 Q2 Q3 Q4 Q1 Q2 Q3 Q4 Q1 Q2 Q3 Q4 Q1 Q2 Q3 Q4 Q1 Q2 Q3 Q4 2010 2011 2012 2013 2014 % EUR Million Services net sales, rolling 12 months Capital net sales, rolling 12 months EBITA* %, rolling 12 mths 23
  • 24.
    Matti Kähkönen President andCEO Outlook and guidance
  • 25.
    © Metso© Metso 24%of net sales of which 45% services Current demand: • Good in oil and gas with increased uncertainties due to the oil price; satisfactory in pulp and paper • Services good Market outlook unchanged but challenging 52% of net sales of which 60% services Current demand: • Weak for the equipment and project business • Services good 21% of net sales of which 40% services Current demand: • Satisfactory for equipment and good for services 3-6 months market outlook Equipment Services Equipment Services Equipment Services Mining Aggregates Flow Control 25
  • 26.
    © Metso© Metso Orderbacklog • Flow Control backlog 19% higher than a year ago • Minerals services backlog at the same level • Deliveries for 2015 stand at a little below EUR 1.4 billion Deliveries in 2015 Deliveries after 2015 Deliveries in 2014 Deliveries after 2014 0 200 400 600 800 1000 1200 1400 1600 1800 2000 Order backlog Dec 31, 2013 Order backlog Dec 31, 2014 EUR million Flow ControlMinerals, servicesMinerals, capital 2 010 1 364 1 730 2 506 2 324 1 927 1 575 0 1 000 2 000 3 000 Q4 Q4 Q4 Q4 Q4 Q4 Q4 2008 2009 2010 2011 2012 2013 2014 EUR Million 26
  • 27.
    © Metso© Metso*before non-recurring items The guidance for 2015 is based on the current market activity in our customer industries, our current backlog for 2015, and the current exchange rates. In addition, the divestment of our Process Automation Systems business is expected to be completed on April 1, 2015. Annual net sales of the Process Automation Systems business is about EUR 300 million. We estimate that • our net sales in 2015 will be between EUR 3,000 and 3,300 and • our EBITA margin* before non- recurring items for 2015 will be around 13%. Guidance for 2015 Excluding the Process Automation Systems business 27
  • 28.