Downloaded 1,249 times
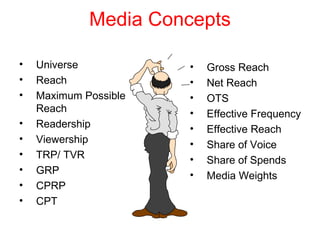
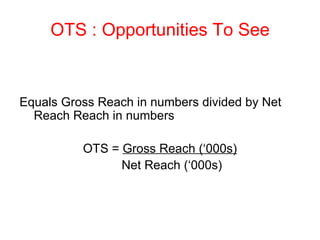
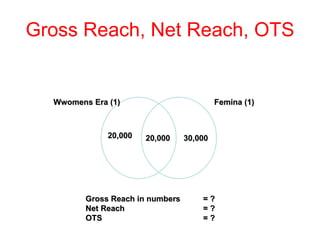
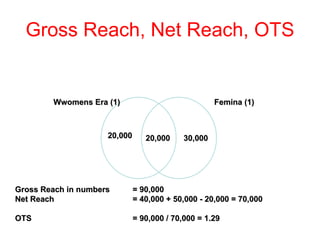
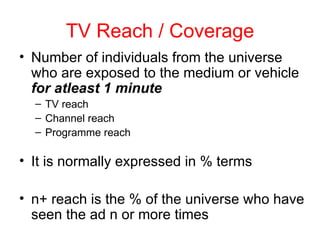
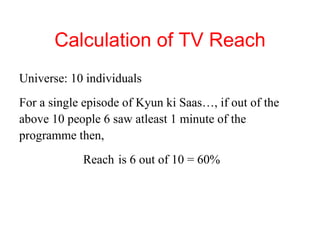
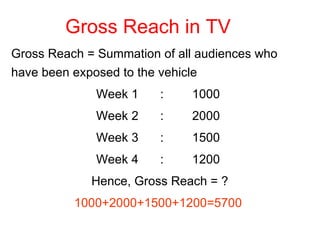
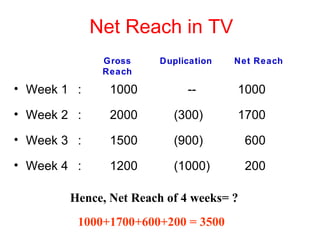
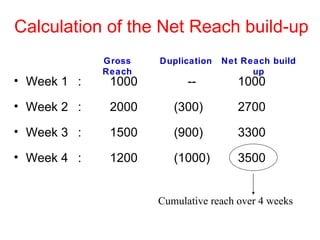
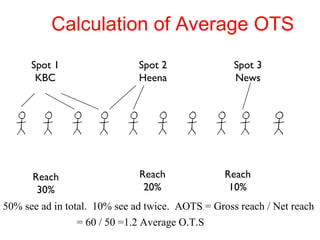
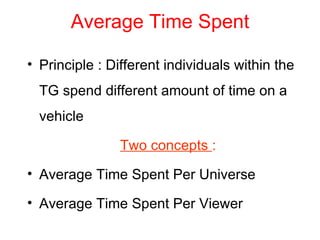
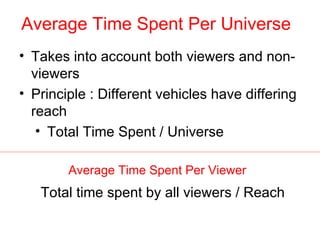
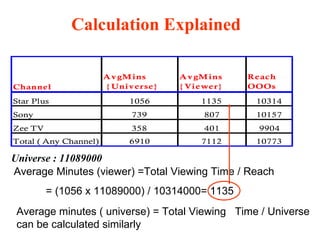
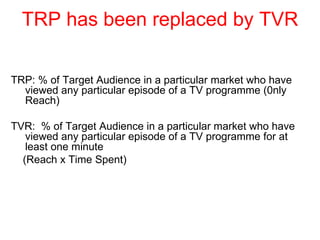


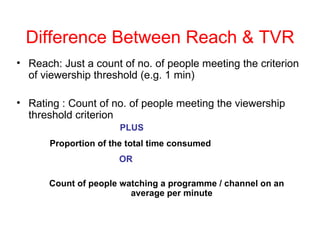
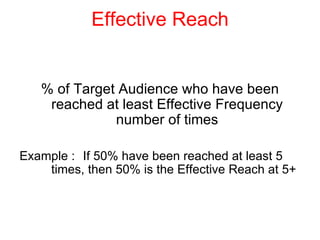
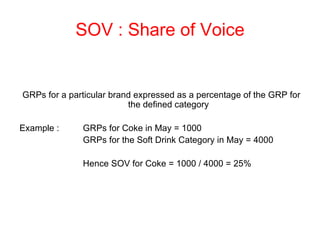
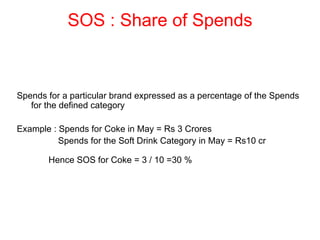


This document defines key media terminology used to measure audience reach and engagement. It explains concepts like universe, reach, gross reach, net reach, opportunities to see, ratings, share of voice, and media weights. Reach refers to the number of people exposed, while ratings consider both reach and time spent viewing. Gross and net reach differentiate counting audiences multiple times.


![[Young Marketers Elite 2013] Assignment 9.1 - Hoang Thach - Thao Nghi](https://cdn.slidesharecdn.com/ss_thumbnails/youngmarketerselite2013-assignment9-140213220747-phpapp01-thumbnail.jpg?width=640&height=640&fit=bounds)


