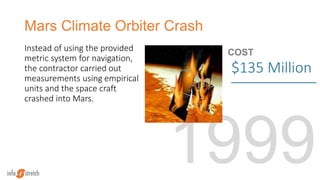
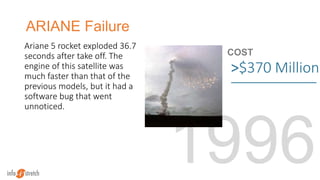
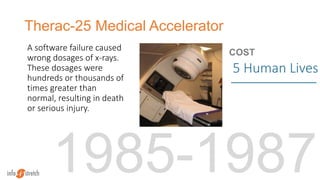
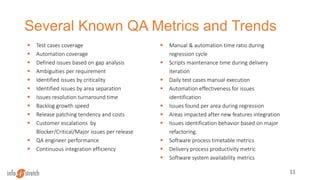
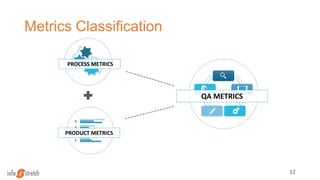
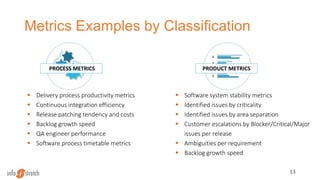
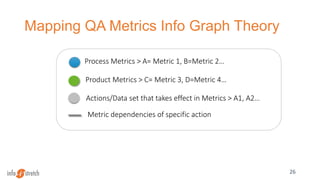
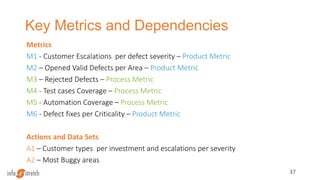
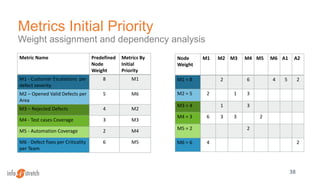
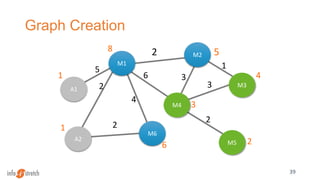
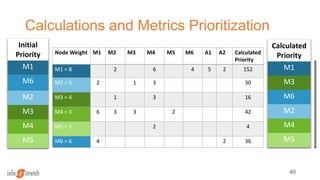
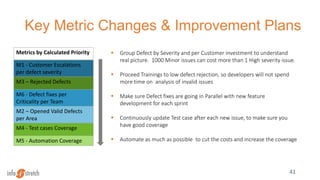
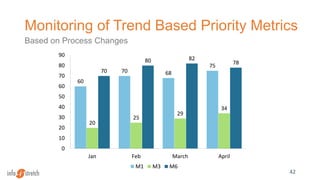
This document discusses quality assurance metrics and trends in practice. It begins by providing examples of costly technology failures from bugs in various systems. It then defines various known QA metrics that can be classified as product, process, or QA metrics. The document discusses representing metrics and their dependencies using a graph theory approach to analyze and prioritize metrics based on their calculated weights and dependencies. It provides an example of applying this approach to define and analyze key metrics for a test project. The analysis reveals that certain metrics should be prioritized for improvement based on the calculated weights.