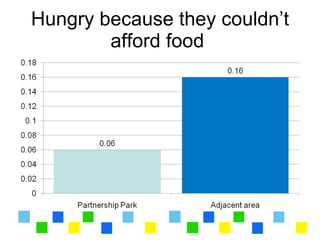
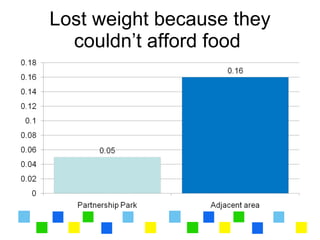
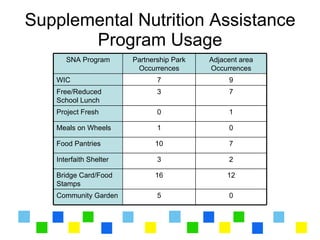
Measuring Food
Security in Jackson
          Phil Tocco
      Extension Educator
     MSUE-Jackson County
Why Measure Food Security?
What is a Food Security Survey?
• An assessment of
  need within a
  community
• Fairly quantitative and
  repeatable
• Highly configurable
  based on research
  goals
Developing the Survey
• Begin with the end in mind

• Seek input from a diverse stakeholder group

• Craft a basic survey instrument

• Pilot and revise survey as necessary

• Collect and analyze data
Components of the Survey?
• Demographic and Socioeconomic profile

• Community food resource profile

• Household food security assessment

• Assessment of food resource accessibility

• Food availability and affordability assessment

• Community food production resources
  assessment
Demographic Profile
• Helps to describe
  what the community
  looks like.
• Parameters can
  include:
  – Age, Race
  – Employment
• Poverty status
                        Photo Credit Getty Images
  – Income
Food Resource Profile
• Determines the
  adequacy of
  community resources.
• Are food assistance
  programs available?
• Is the community
  participating?
• Are emergency
  resources available?
Household Food Security
              Assessment
• Main driver is to
  determine if household
  food security is a direct
  personal problem.
• Key assessment
  indicators:
   – Perceptions of inadequacy.
   – food budget anxiety.
   – reports of reduced food
     intake or consequences.
Food Resource Accessibility
• Assesses physical
  access to food.
• Do grocery stores
  exist in the
  neighborhood?
• What barriers to
  access exist?
• Is transportation
  adequate?
Food Availability and Affordability
• Is there a variety of
  food available in local
  stores?
• Is the food
  affordable?
• Can include a survey
  of local grocery
  stores.
                            Photo Credit Getty Images
Community Food Production
           Resources
• Assesses the
  community capacity for
  local production and low
  income access.
• Indicators include:
  – Community gardens
  – Local food purchases by
    institutions and schools
  – Value added production
    or food processing
Partnership Park Demographics
• 20 square blocks
  adjacent to
  downtown.
• 85% renter occupied
• Median household
  income is $15,966
• More racially diverse
  than rest of city
Branded Neighborhood
• Gateway sign and
  street banners.
• Historic street lighting.
• Monthly
  neighborhood
  stakeholder meetings.
• Annual neighborhood
  events.
Community Activism Around Food
            Security
• Active community
  garden group in
  neighborhood.
• MSUE, Faith-based
  collaborations to
  educate gardeners.
• Emphasis on hand-up

                        Photo Credit Citizen Patriot
Other Neighborhood Investments
• $12 million in
  Public/Private
  investments.
• 24 rehabs.
• 16 new urban in-fills.
• Significant sidewalk
  repairs (191 squares).
Research Methods
• Developed and validated food security
  instrument.

• 19 households randomly picked from each
  subject area.

• Data subjected to simple T-test to determine
  significance of differences among populations.
Home Ownership Rates
Hungry because they couldn’t
        afford food
Lost weight because they
  couldn’t afford food
Supplemental Nutrition Assistance
       Program Usage
      SNA Program       Partnership Park   Adjacent area
                         Occurrences       Occurrences
   WIC                         7                9
   Free/Reduced                3                7
   School Lunch
   Project Fresh               0                1

   Meals on Wheels             1                0

   Food Pantries              10                7

   Interfaith Shelter          3                2

   Bridge Card/Food           16                12
   Stamps
   Community Garden            5                0
Key Takeaways
• Begin with the end in
  mind

• Develop stakeholder
  group

• Remember the data
  are the starting point

                           Photo Credit Getty Images

Measuring Food Security In Jackson

  • 1.
    Measuring Food Security inJackson Phil Tocco Extension Educator MSUE-Jackson County
  • 2.
  • 3.
    What is aFood Security Survey? • An assessment of need within a community • Fairly quantitative and repeatable • Highly configurable based on research goals
  • 4.
    Developing the Survey •Begin with the end in mind • Seek input from a diverse stakeholder group • Craft a basic survey instrument • Pilot and revise survey as necessary • Collect and analyze data
  • 5.
    Components of theSurvey? • Demographic and Socioeconomic profile • Community food resource profile • Household food security assessment • Assessment of food resource accessibility • Food availability and affordability assessment • Community food production resources assessment
  • 6.
    Demographic Profile • Helpsto describe what the community looks like. • Parameters can include: – Age, Race – Employment • Poverty status Photo Credit Getty Images – Income
  • 7.
    Food Resource Profile •Determines the adequacy of community resources. • Are food assistance programs available? • Is the community participating? • Are emergency resources available?
  • 8.
    Household Food Security Assessment • Main driver is to determine if household food security is a direct personal problem. • Key assessment indicators: – Perceptions of inadequacy. – food budget anxiety. – reports of reduced food intake or consequences.
  • 9.
    Food Resource Accessibility •Assesses physical access to food. • Do grocery stores exist in the neighborhood? • What barriers to access exist? • Is transportation adequate?
  • 10.
    Food Availability andAffordability • Is there a variety of food available in local stores? • Is the food affordable? • Can include a survey of local grocery stores. Photo Credit Getty Images
  • 11.
    Community Food Production Resources • Assesses the community capacity for local production and low income access. • Indicators include: – Community gardens – Local food purchases by institutions and schools – Value added production or food processing
  • 12.
    Partnership Park Demographics •20 square blocks adjacent to downtown. • 85% renter occupied • Median household income is $15,966 • More racially diverse than rest of city
  • 13.
    Branded Neighborhood • Gatewaysign and street banners. • Historic street lighting. • Monthly neighborhood stakeholder meetings. • Annual neighborhood events.
  • 14.
    Community Activism AroundFood Security • Active community garden group in neighborhood. • MSUE, Faith-based collaborations to educate gardeners. • Emphasis on hand-up Photo Credit Citizen Patriot
  • 15.
    Other Neighborhood Investments •$12 million in Public/Private investments. • 24 rehabs. • 16 new urban in-fills. • Significant sidewalk repairs (191 squares).
  • 17.
    Research Methods • Developedand validated food security instrument. • 19 households randomly picked from each subject area. • Data subjected to simple T-test to determine significance of differences among populations.
  • 18.
  • 19.
    Hungry because theycouldn’t afford food
  • 20.
    Lost weight becausethey couldn’t afford food
  • 21.
    Supplemental Nutrition Assistance Program Usage SNA Program Partnership Park Adjacent area Occurrences Occurrences WIC 7 9 Free/Reduced 3 7 School Lunch Project Fresh 0 1 Meals on Wheels 1 0 Food Pantries 10 7 Interfaith Shelter 3 2 Bridge Card/Food 16 12 Stamps Community Garden 5 0
  • 22.
    Key Takeaways • Beginwith the end in mind • Develop stakeholder group • Remember the data are the starting point Photo Credit Getty Images