Download to read offline


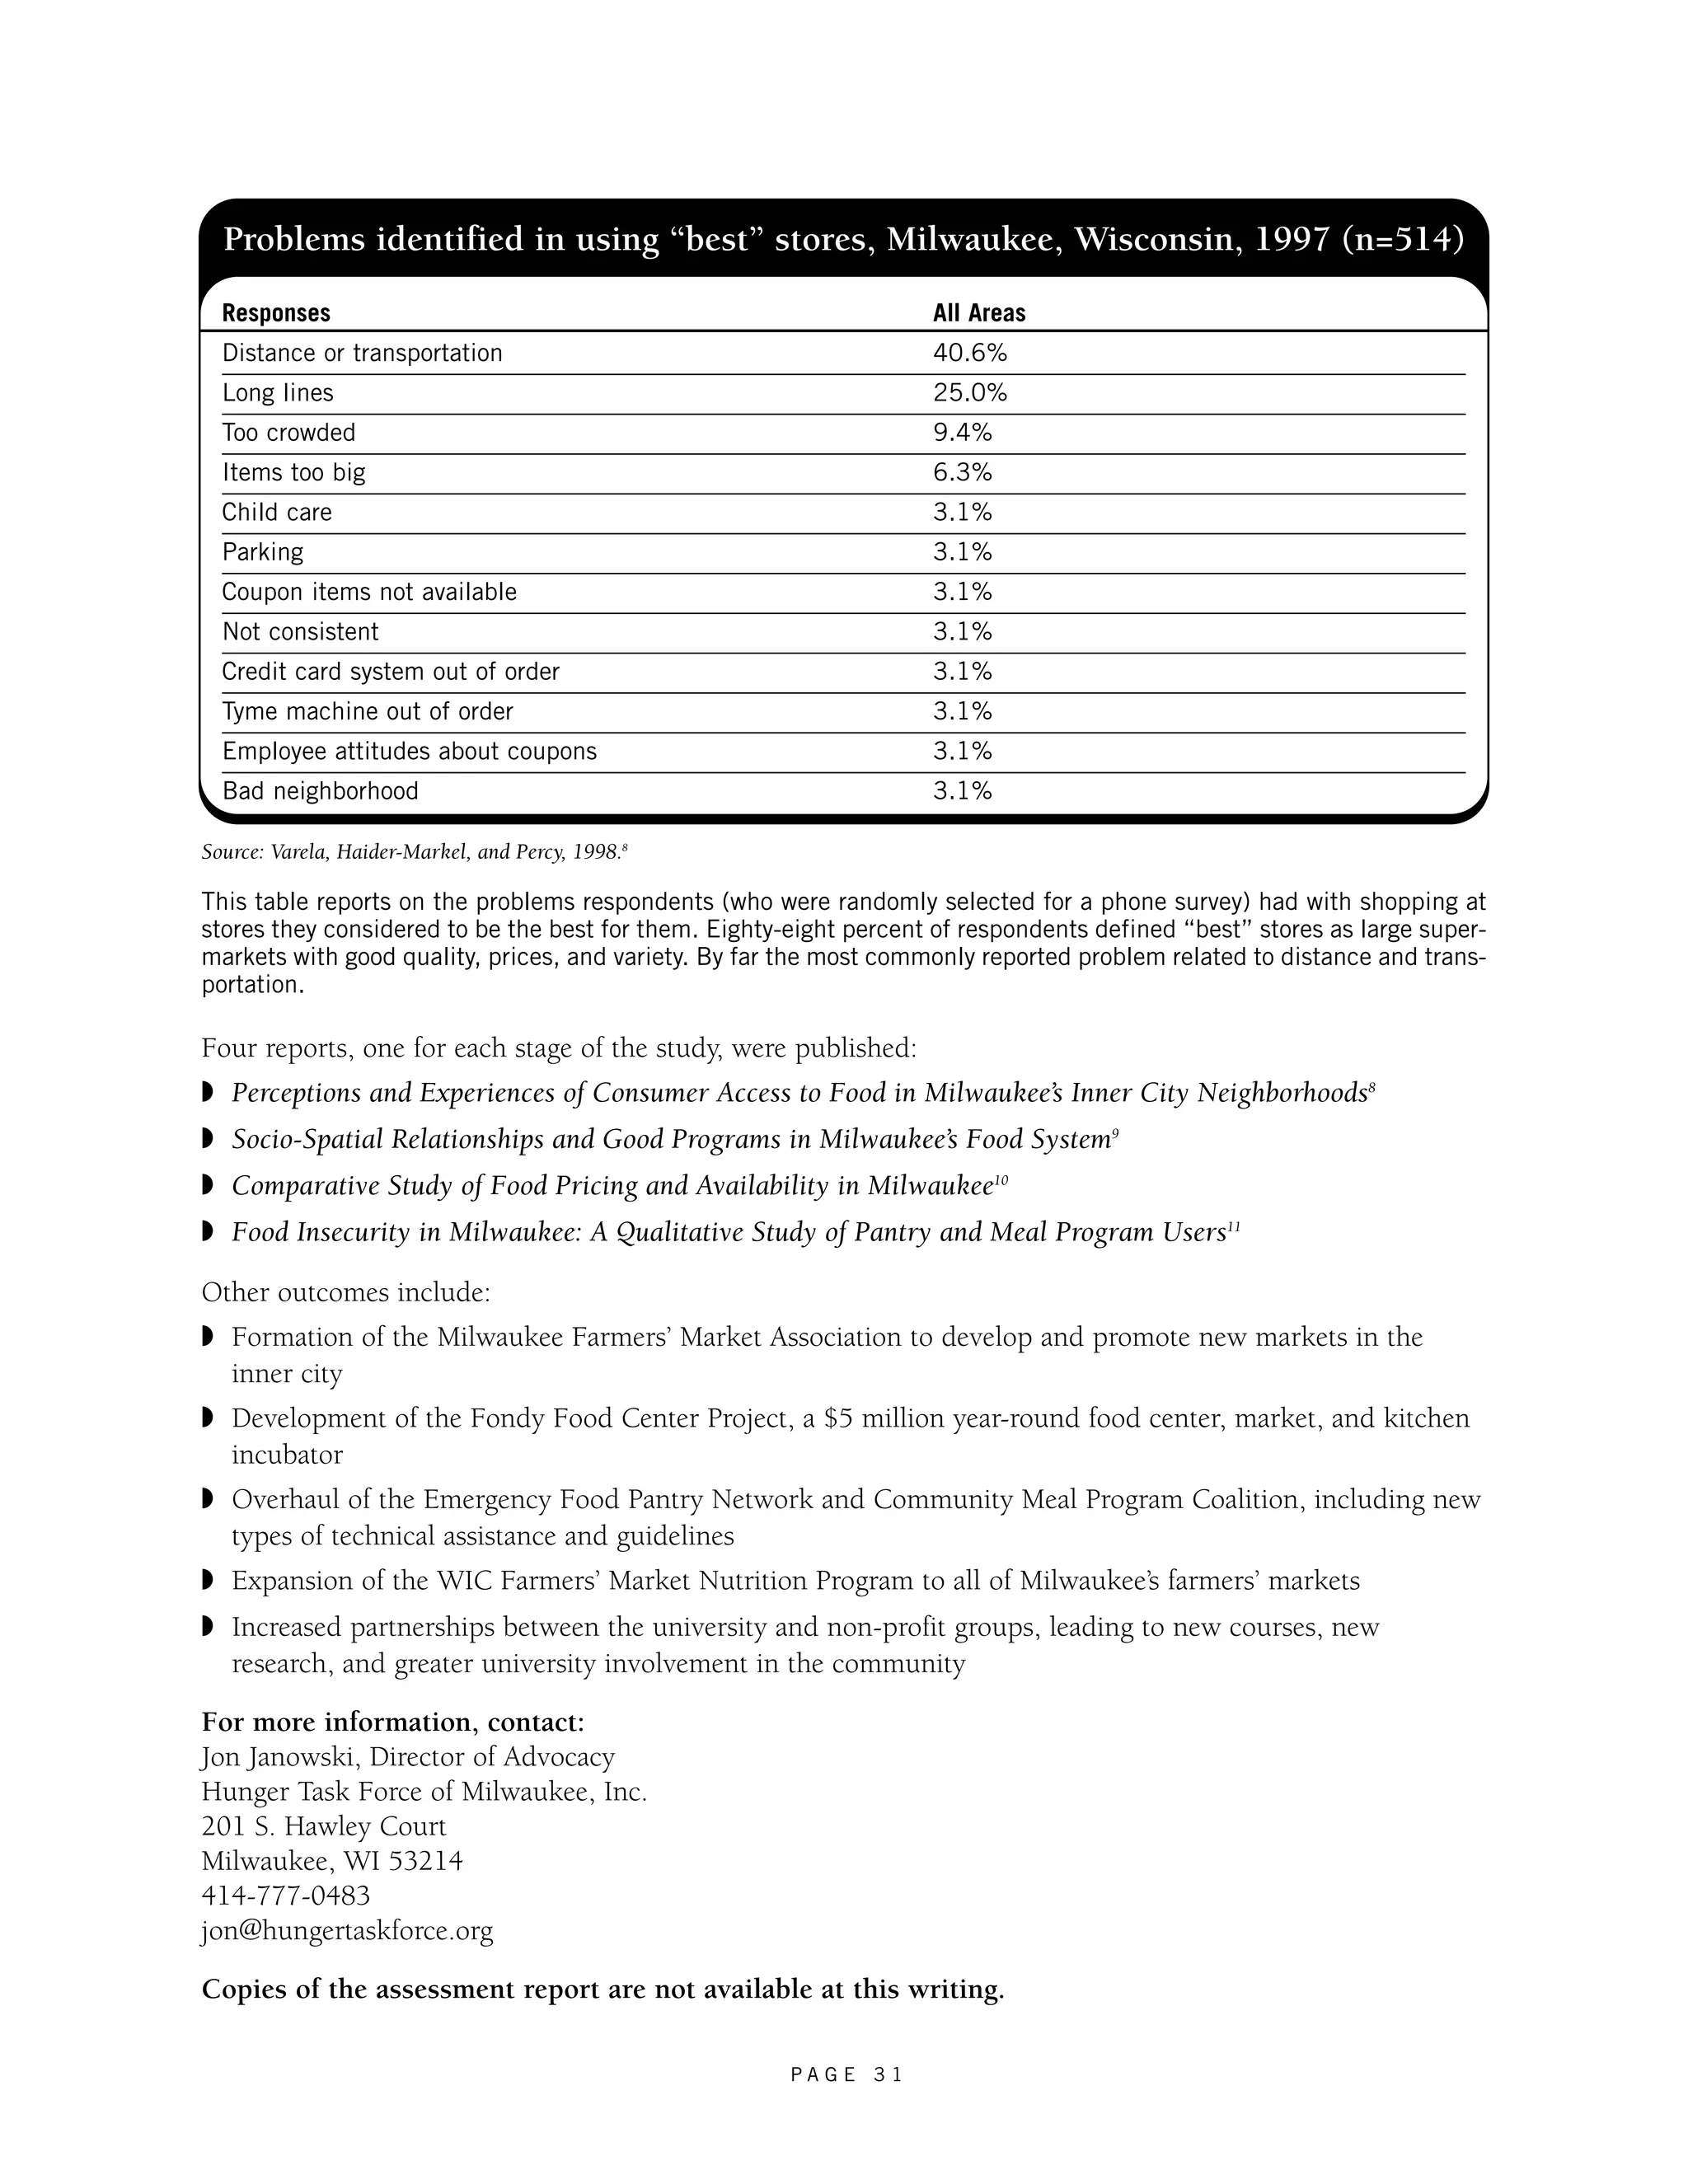
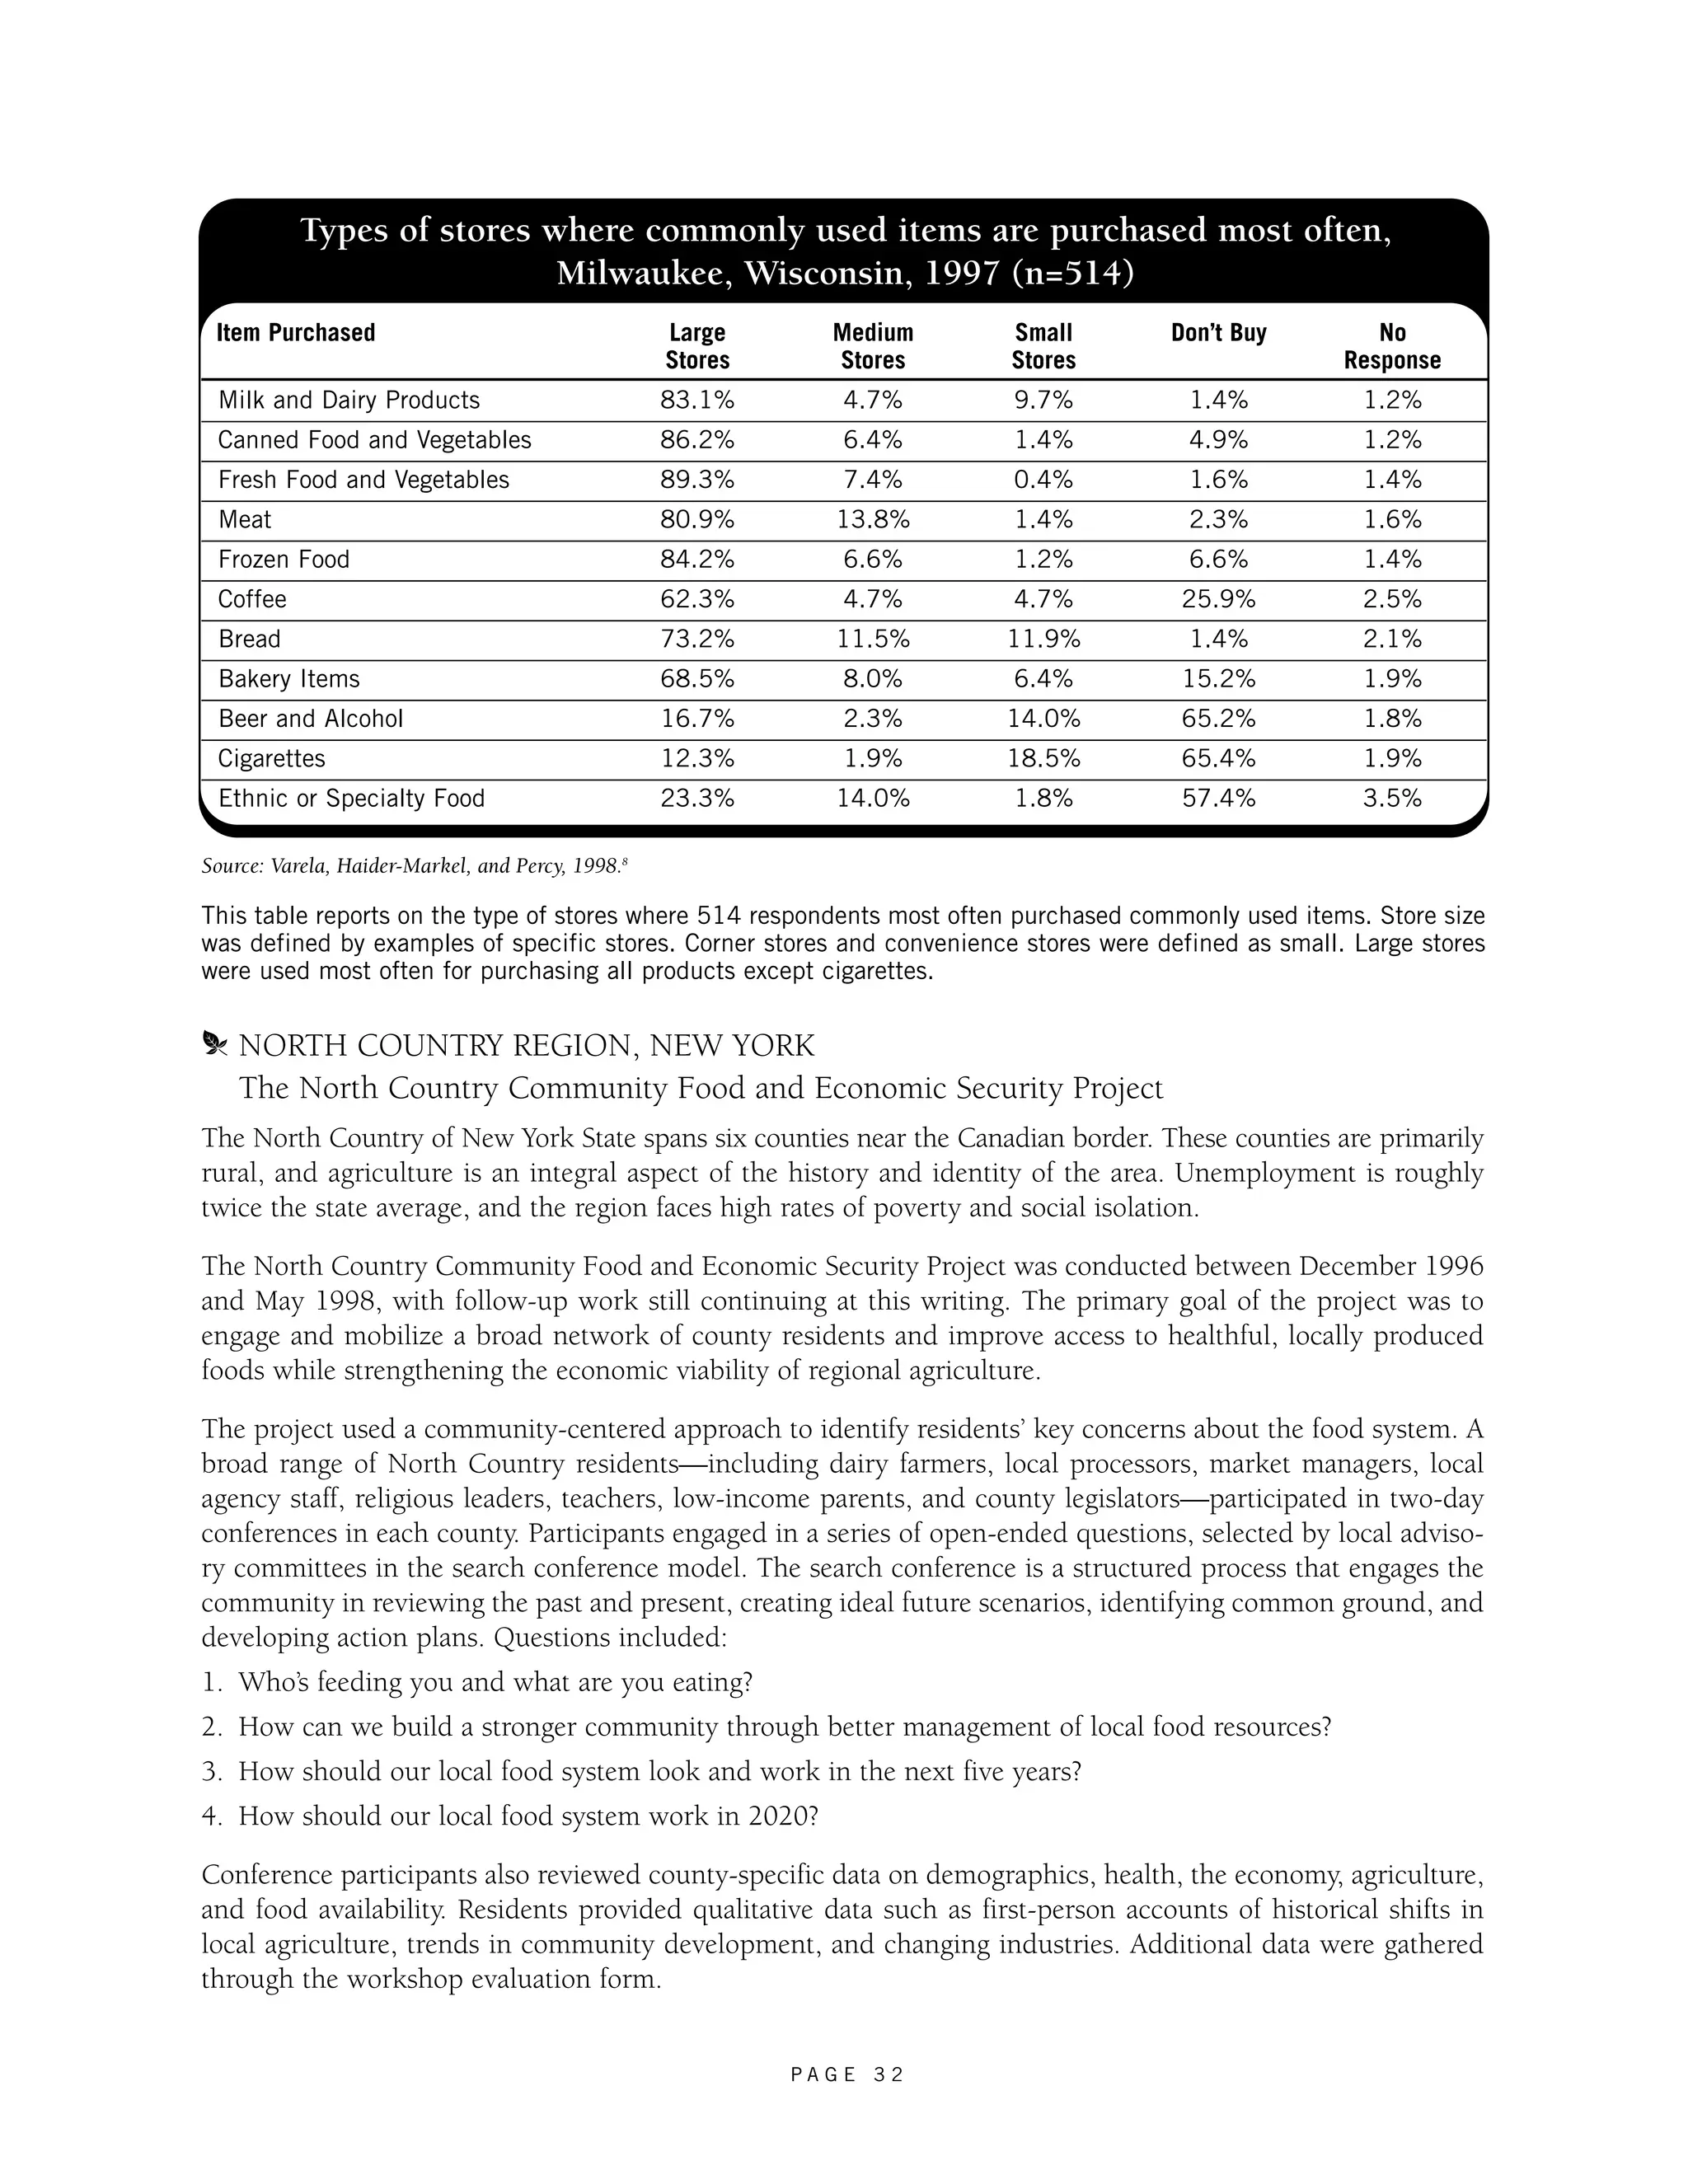
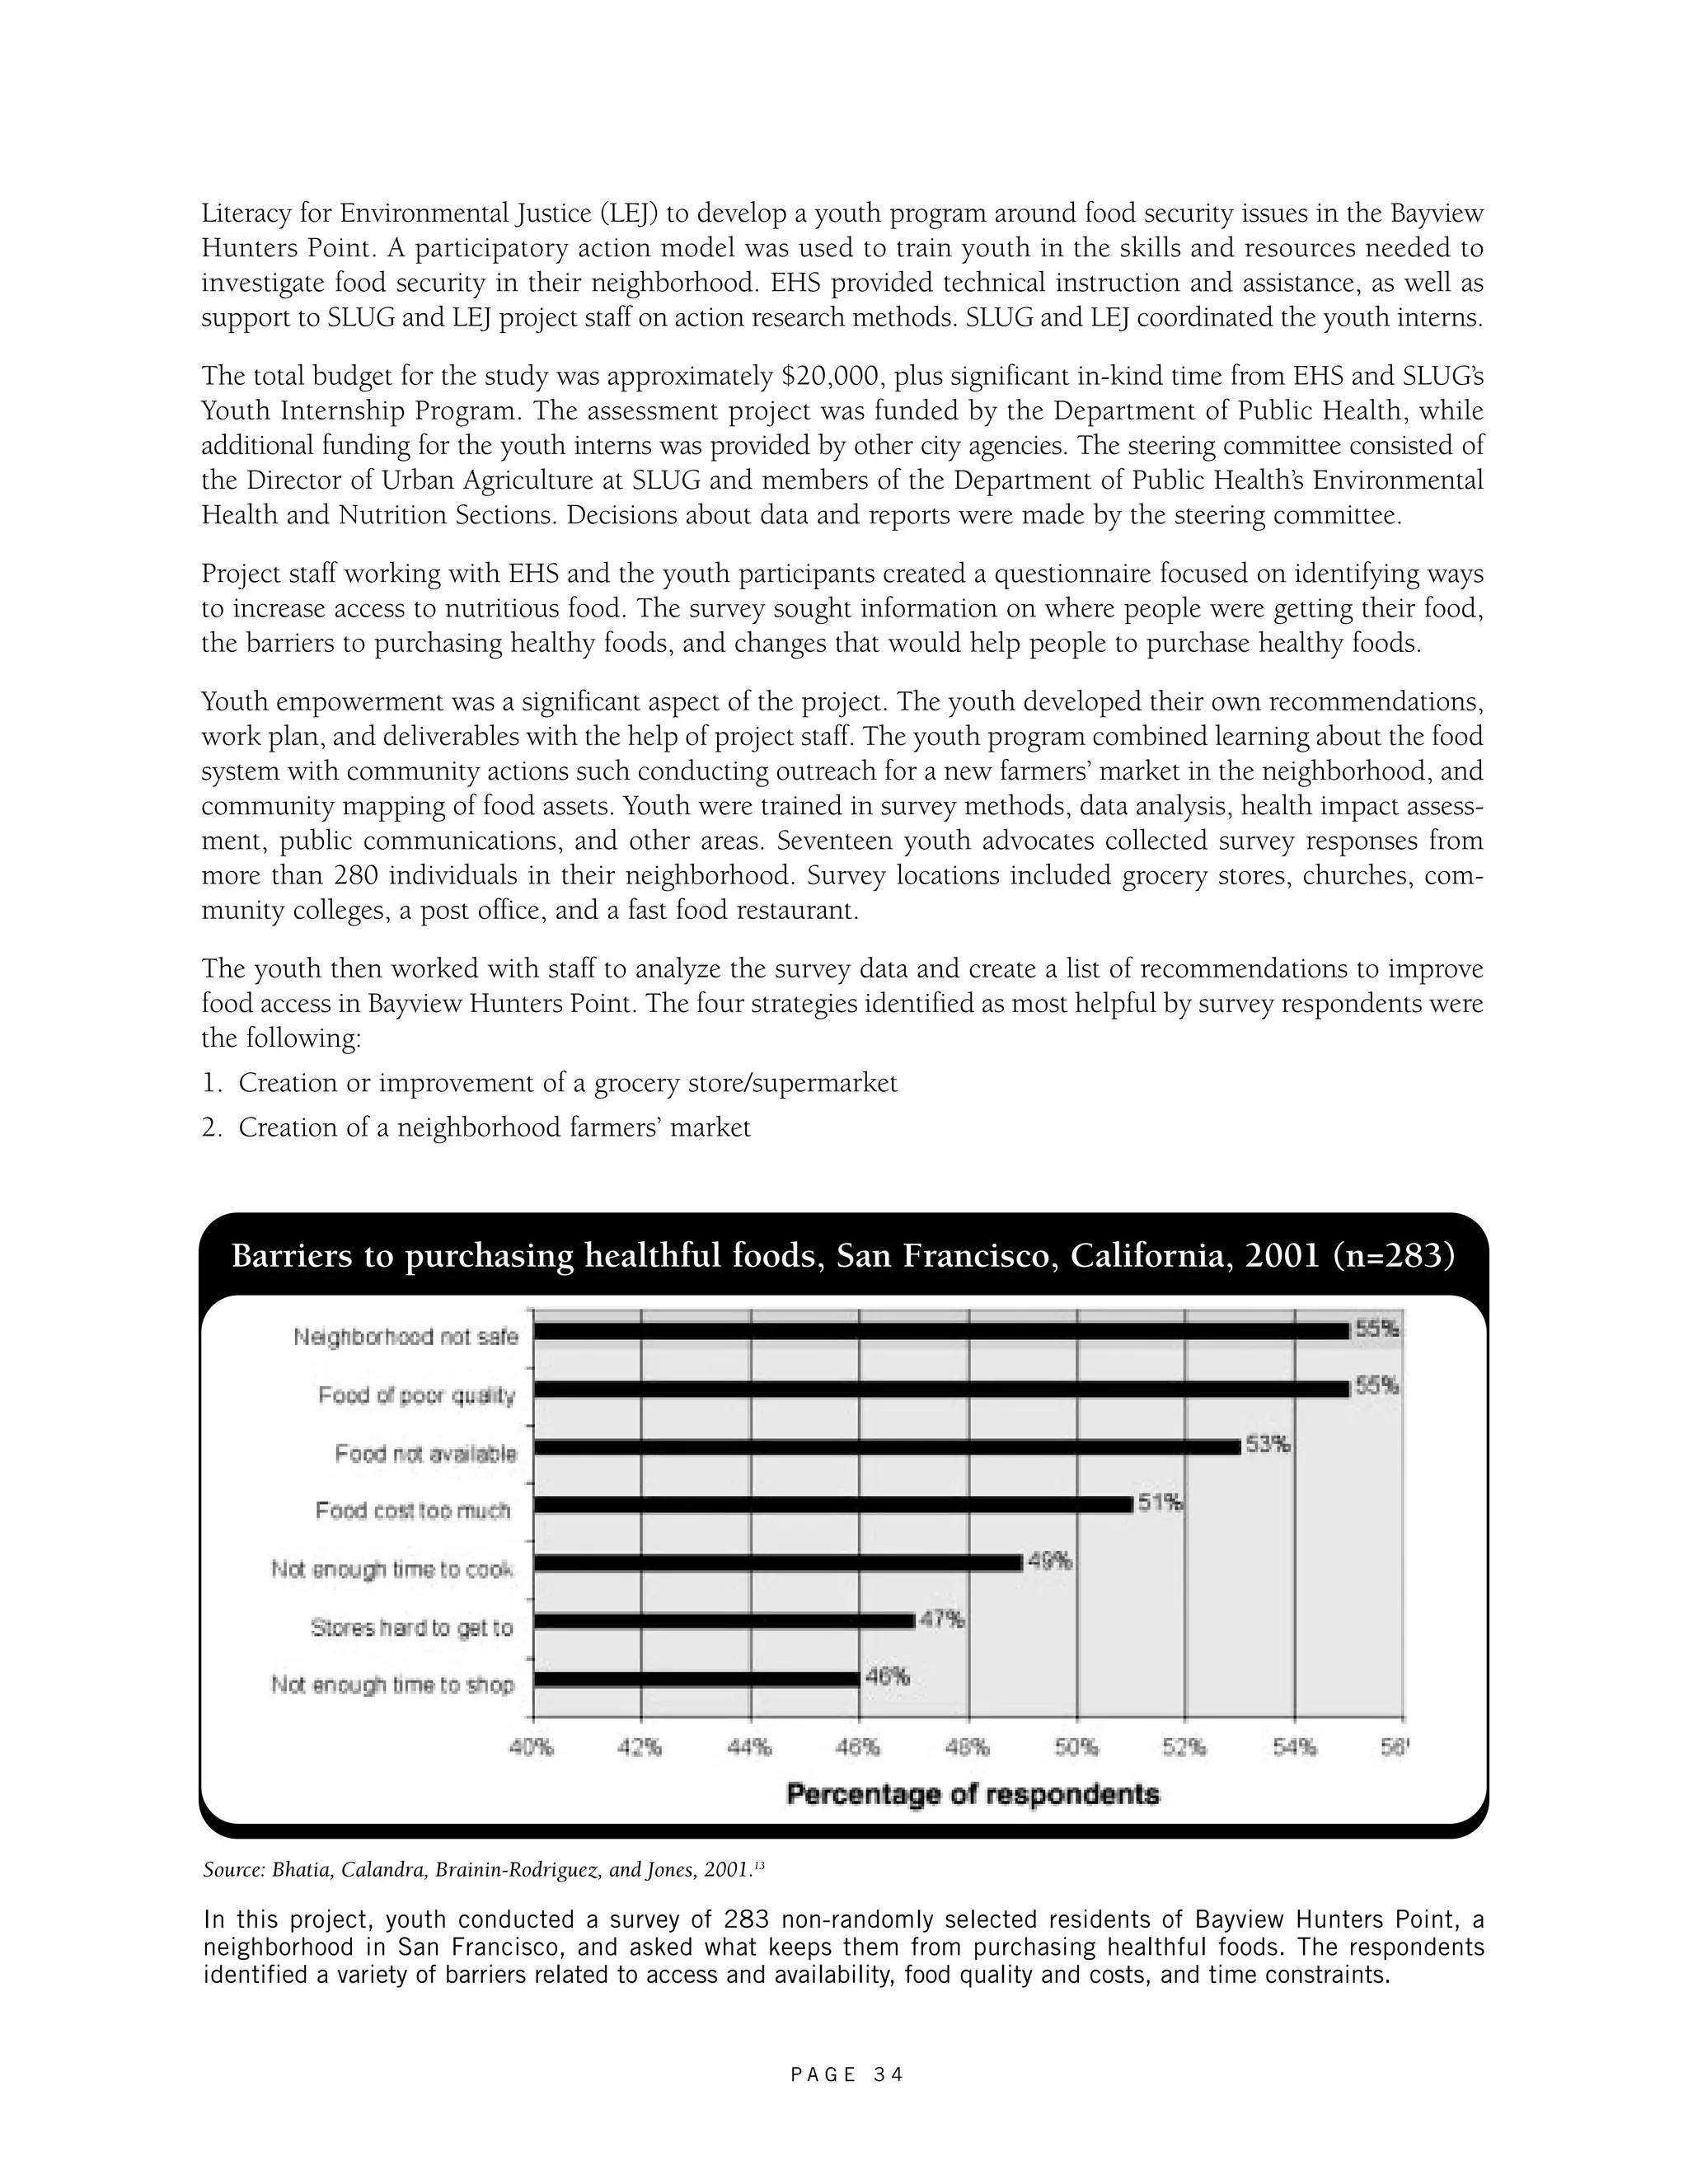
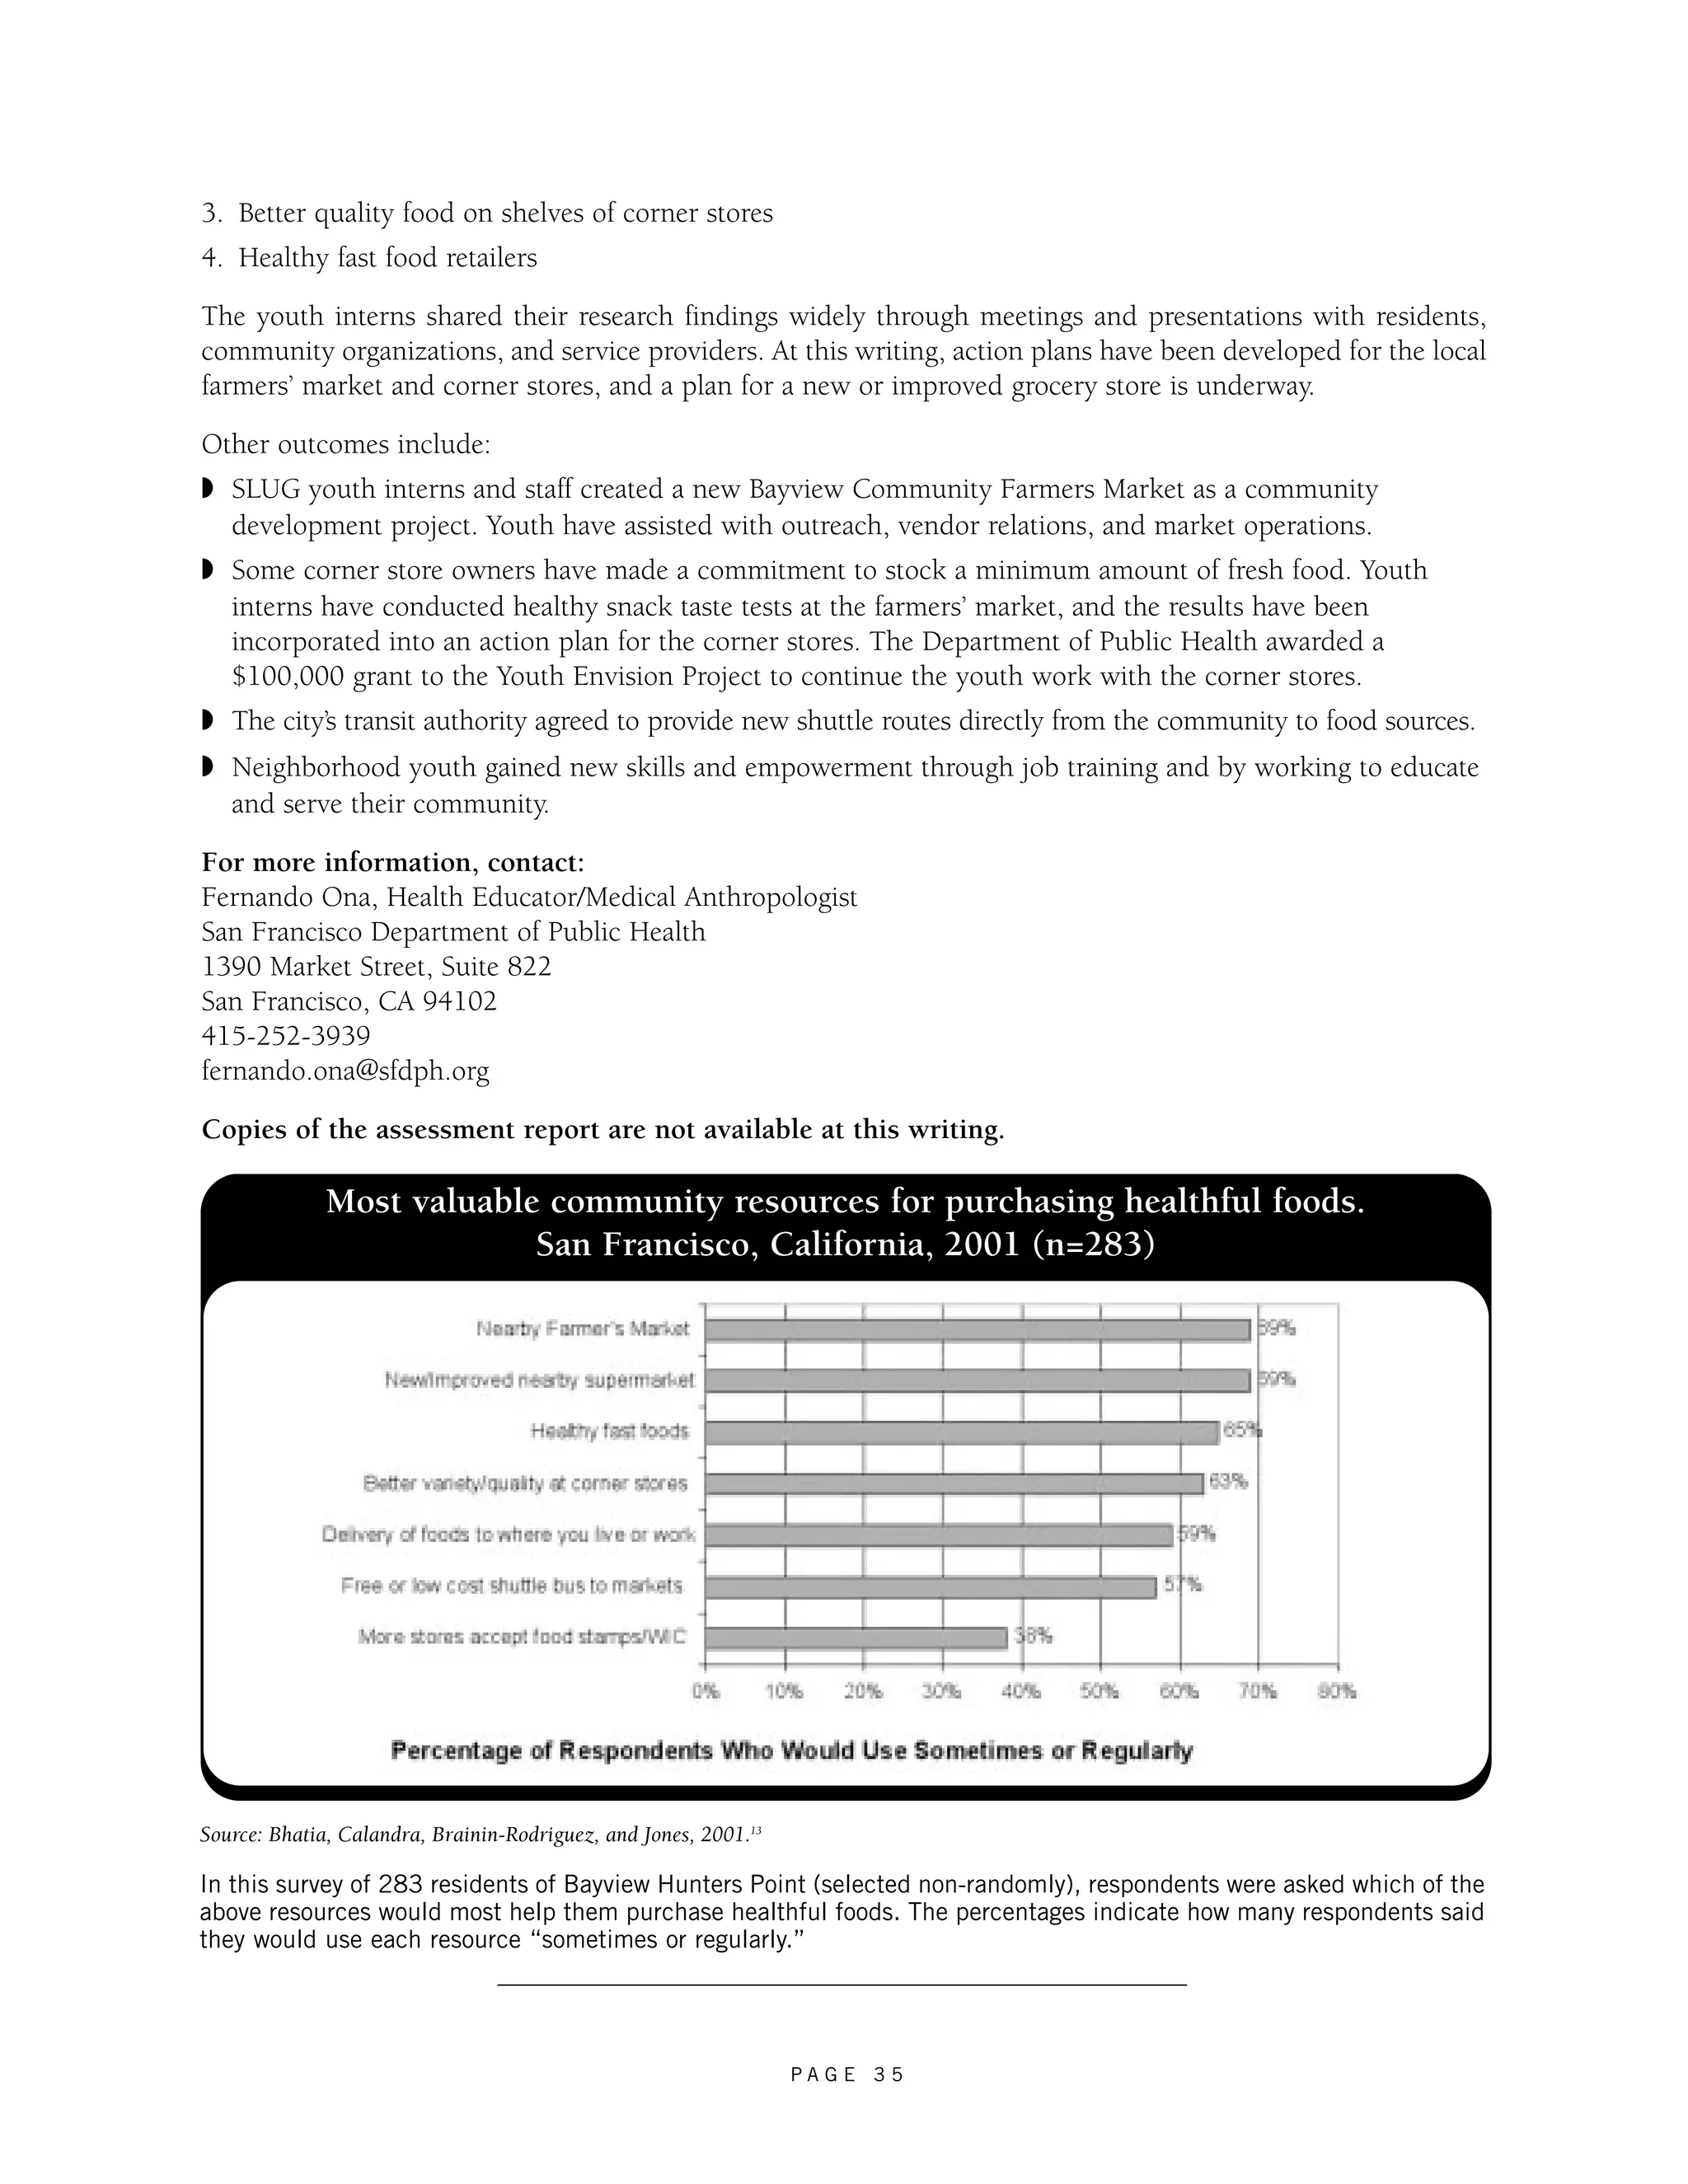
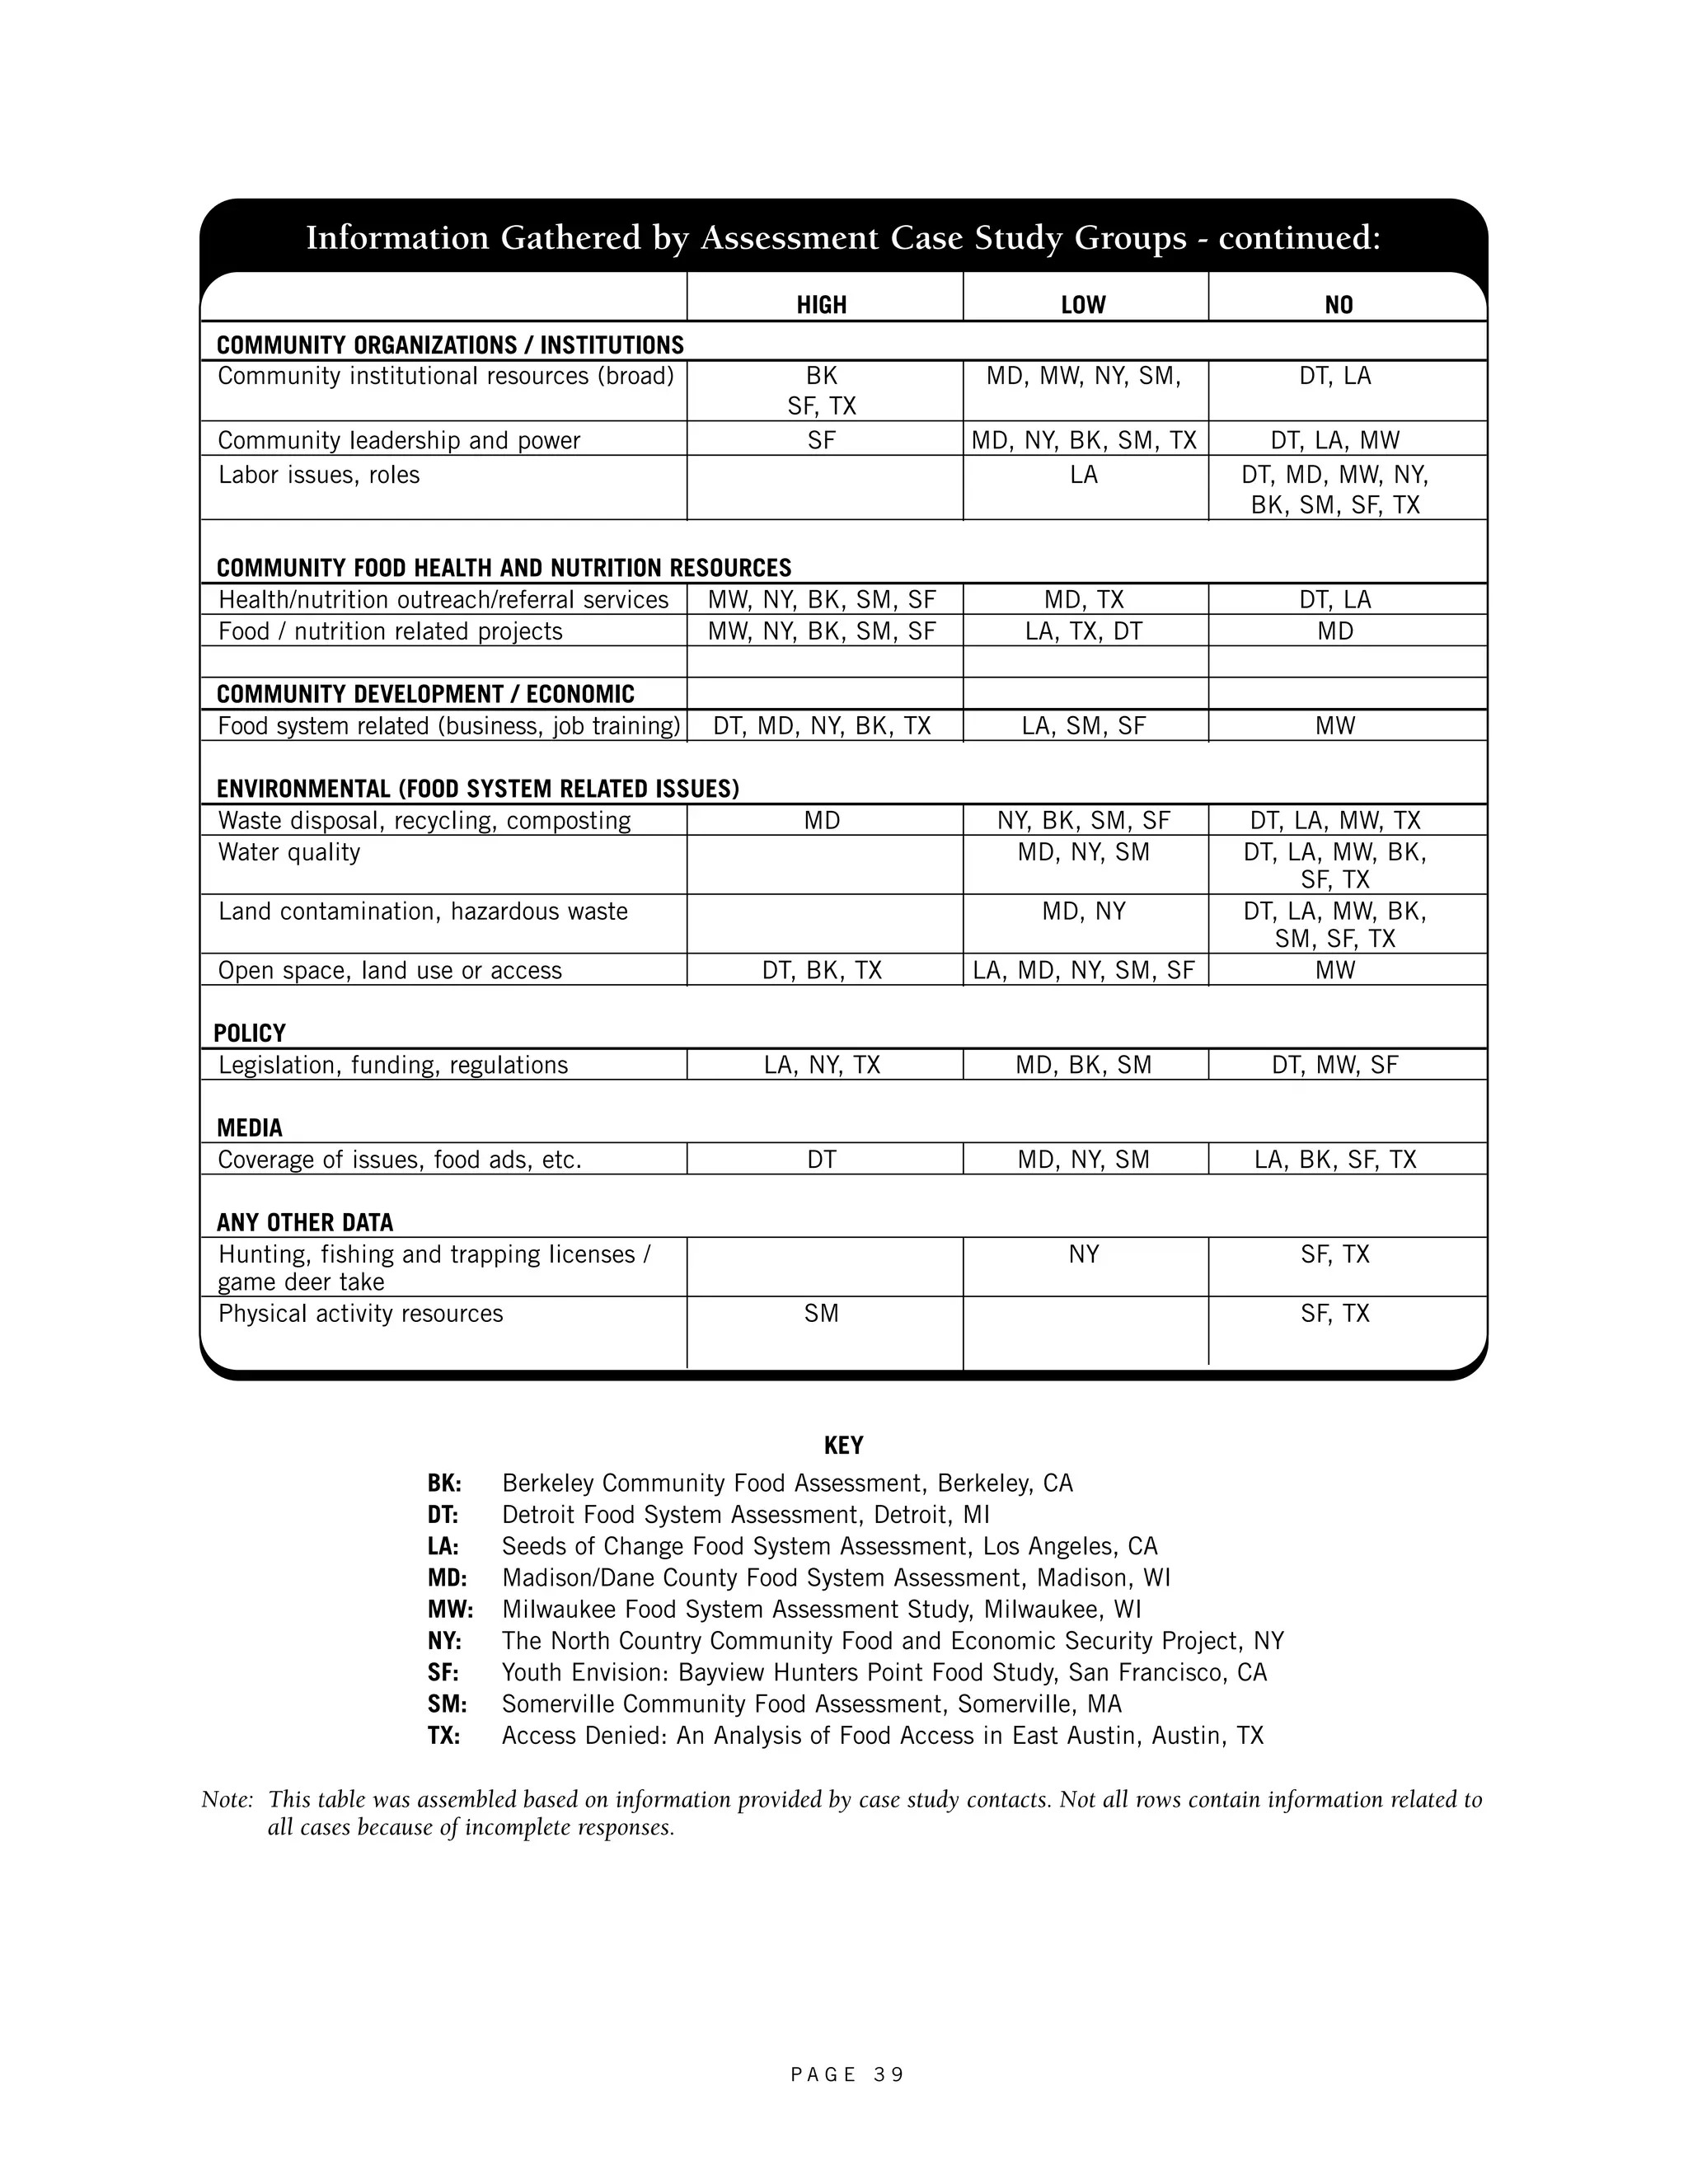
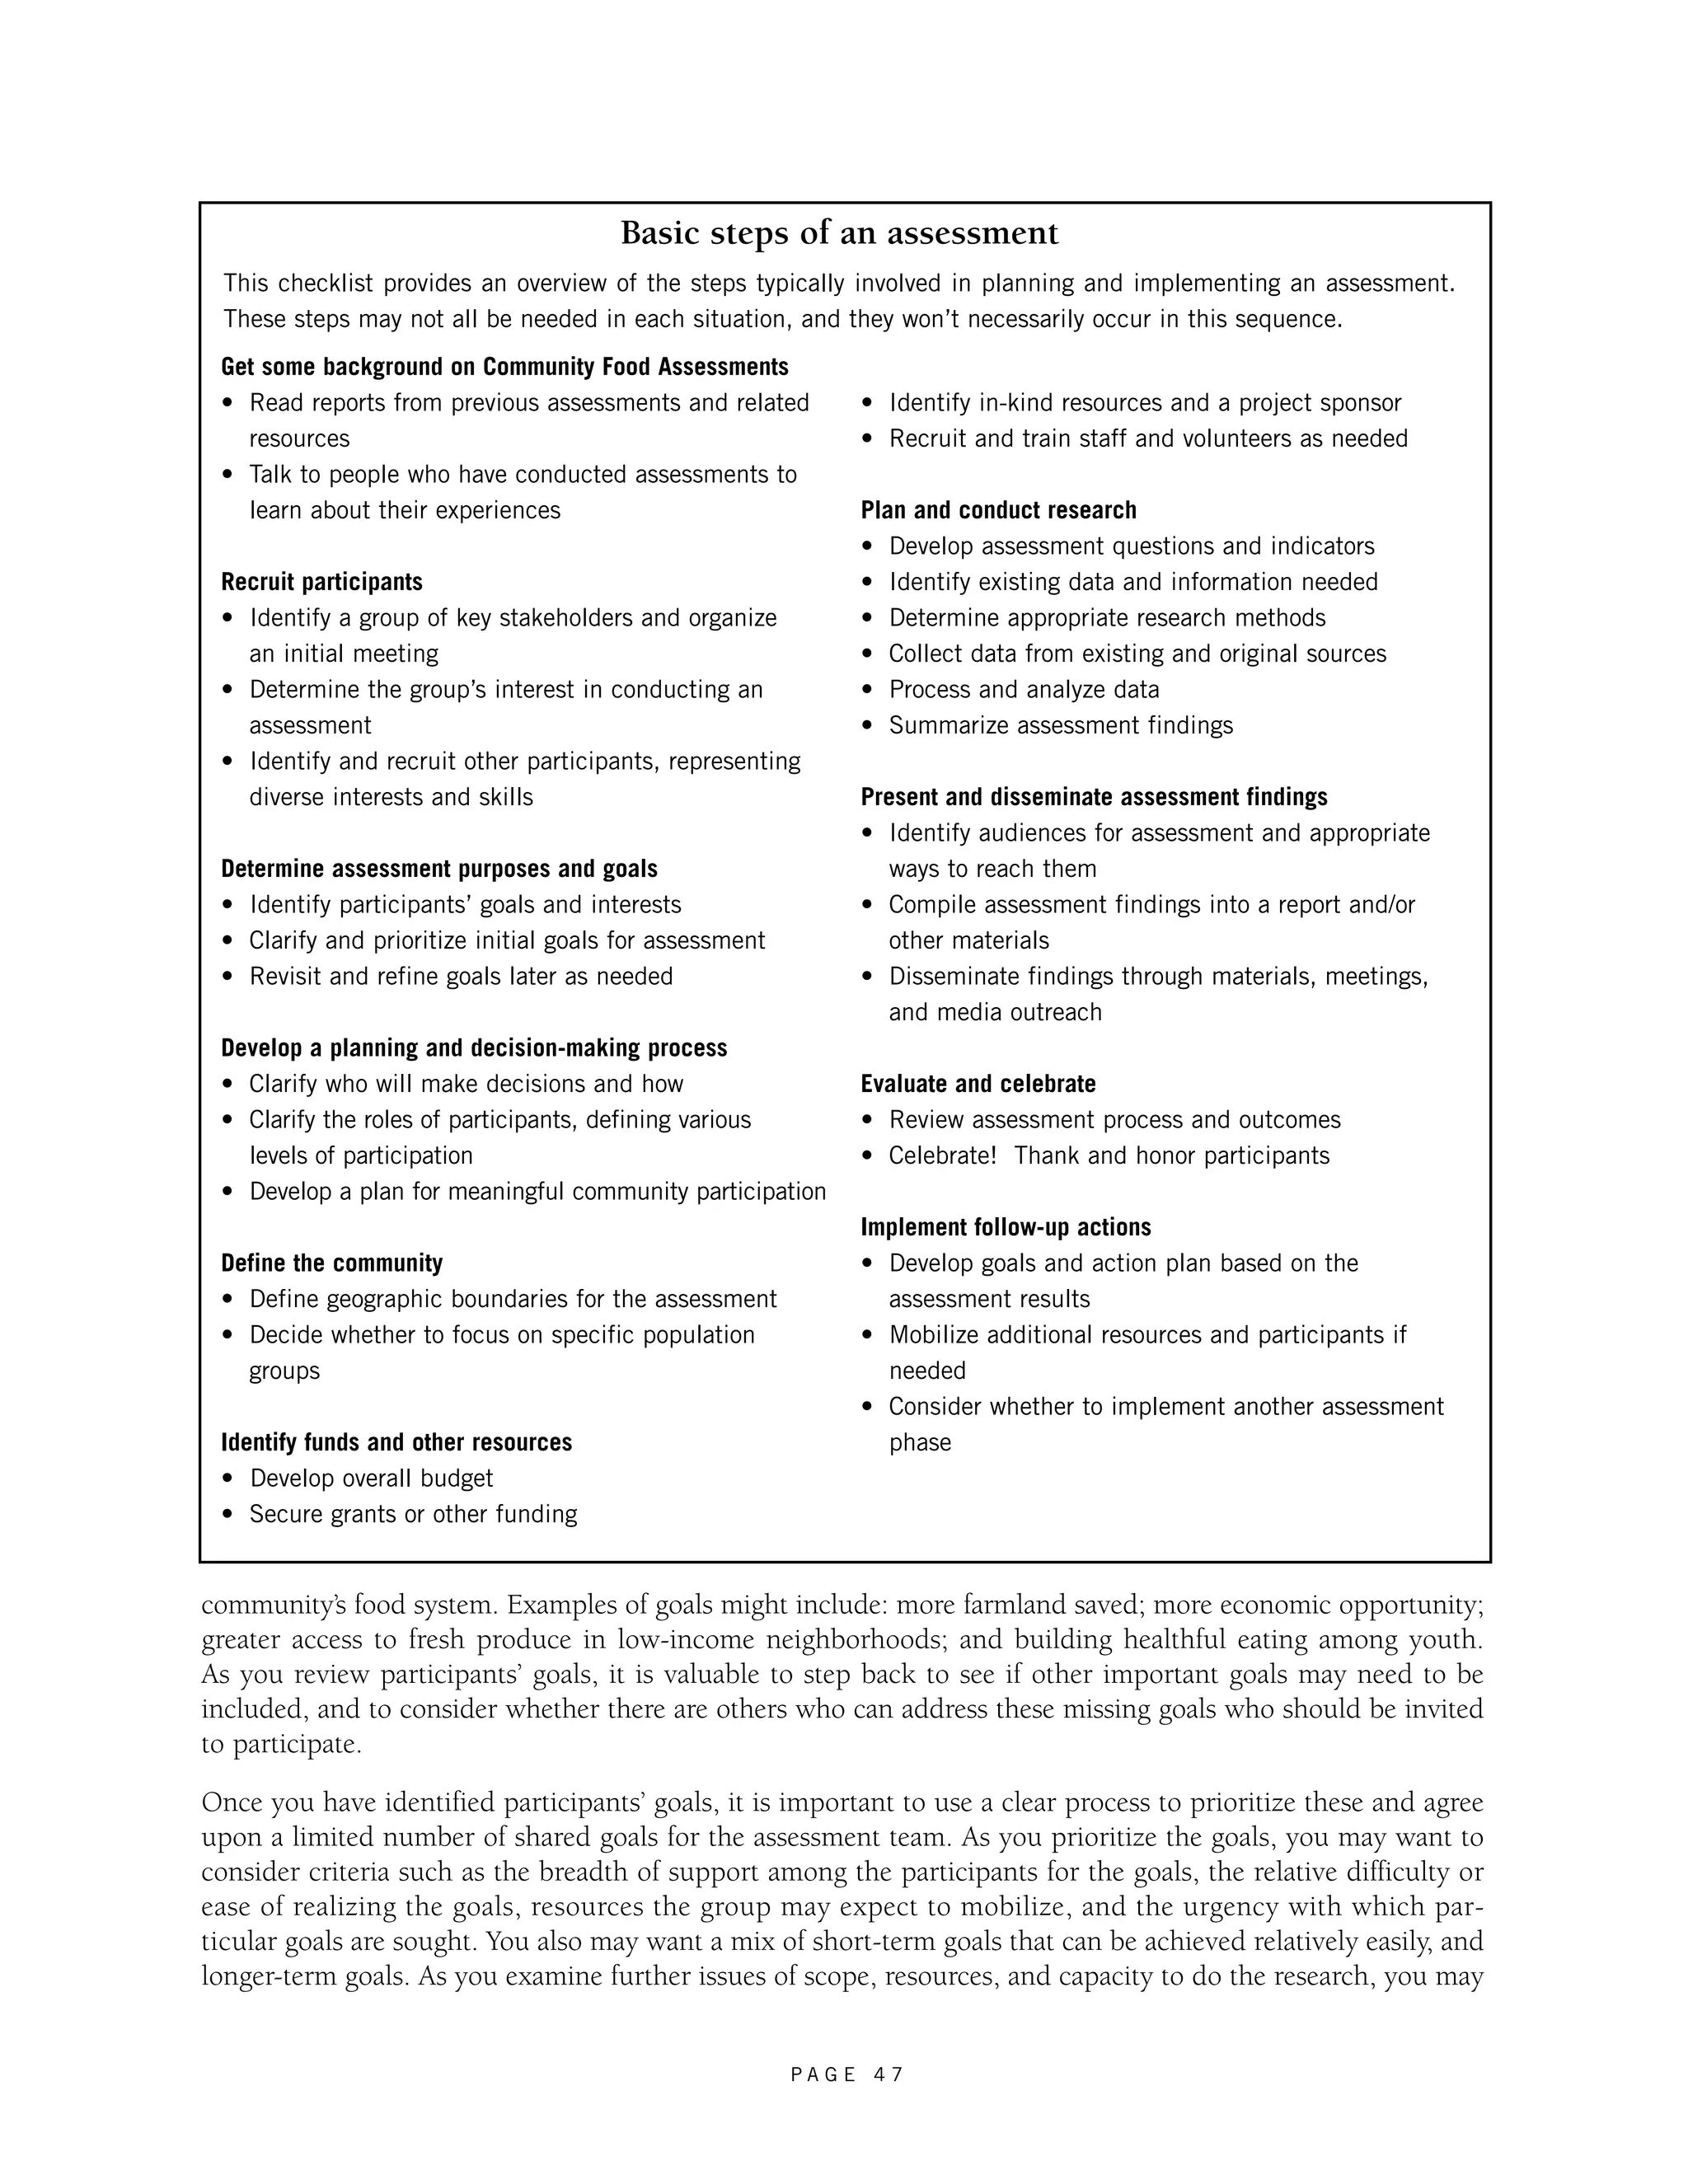

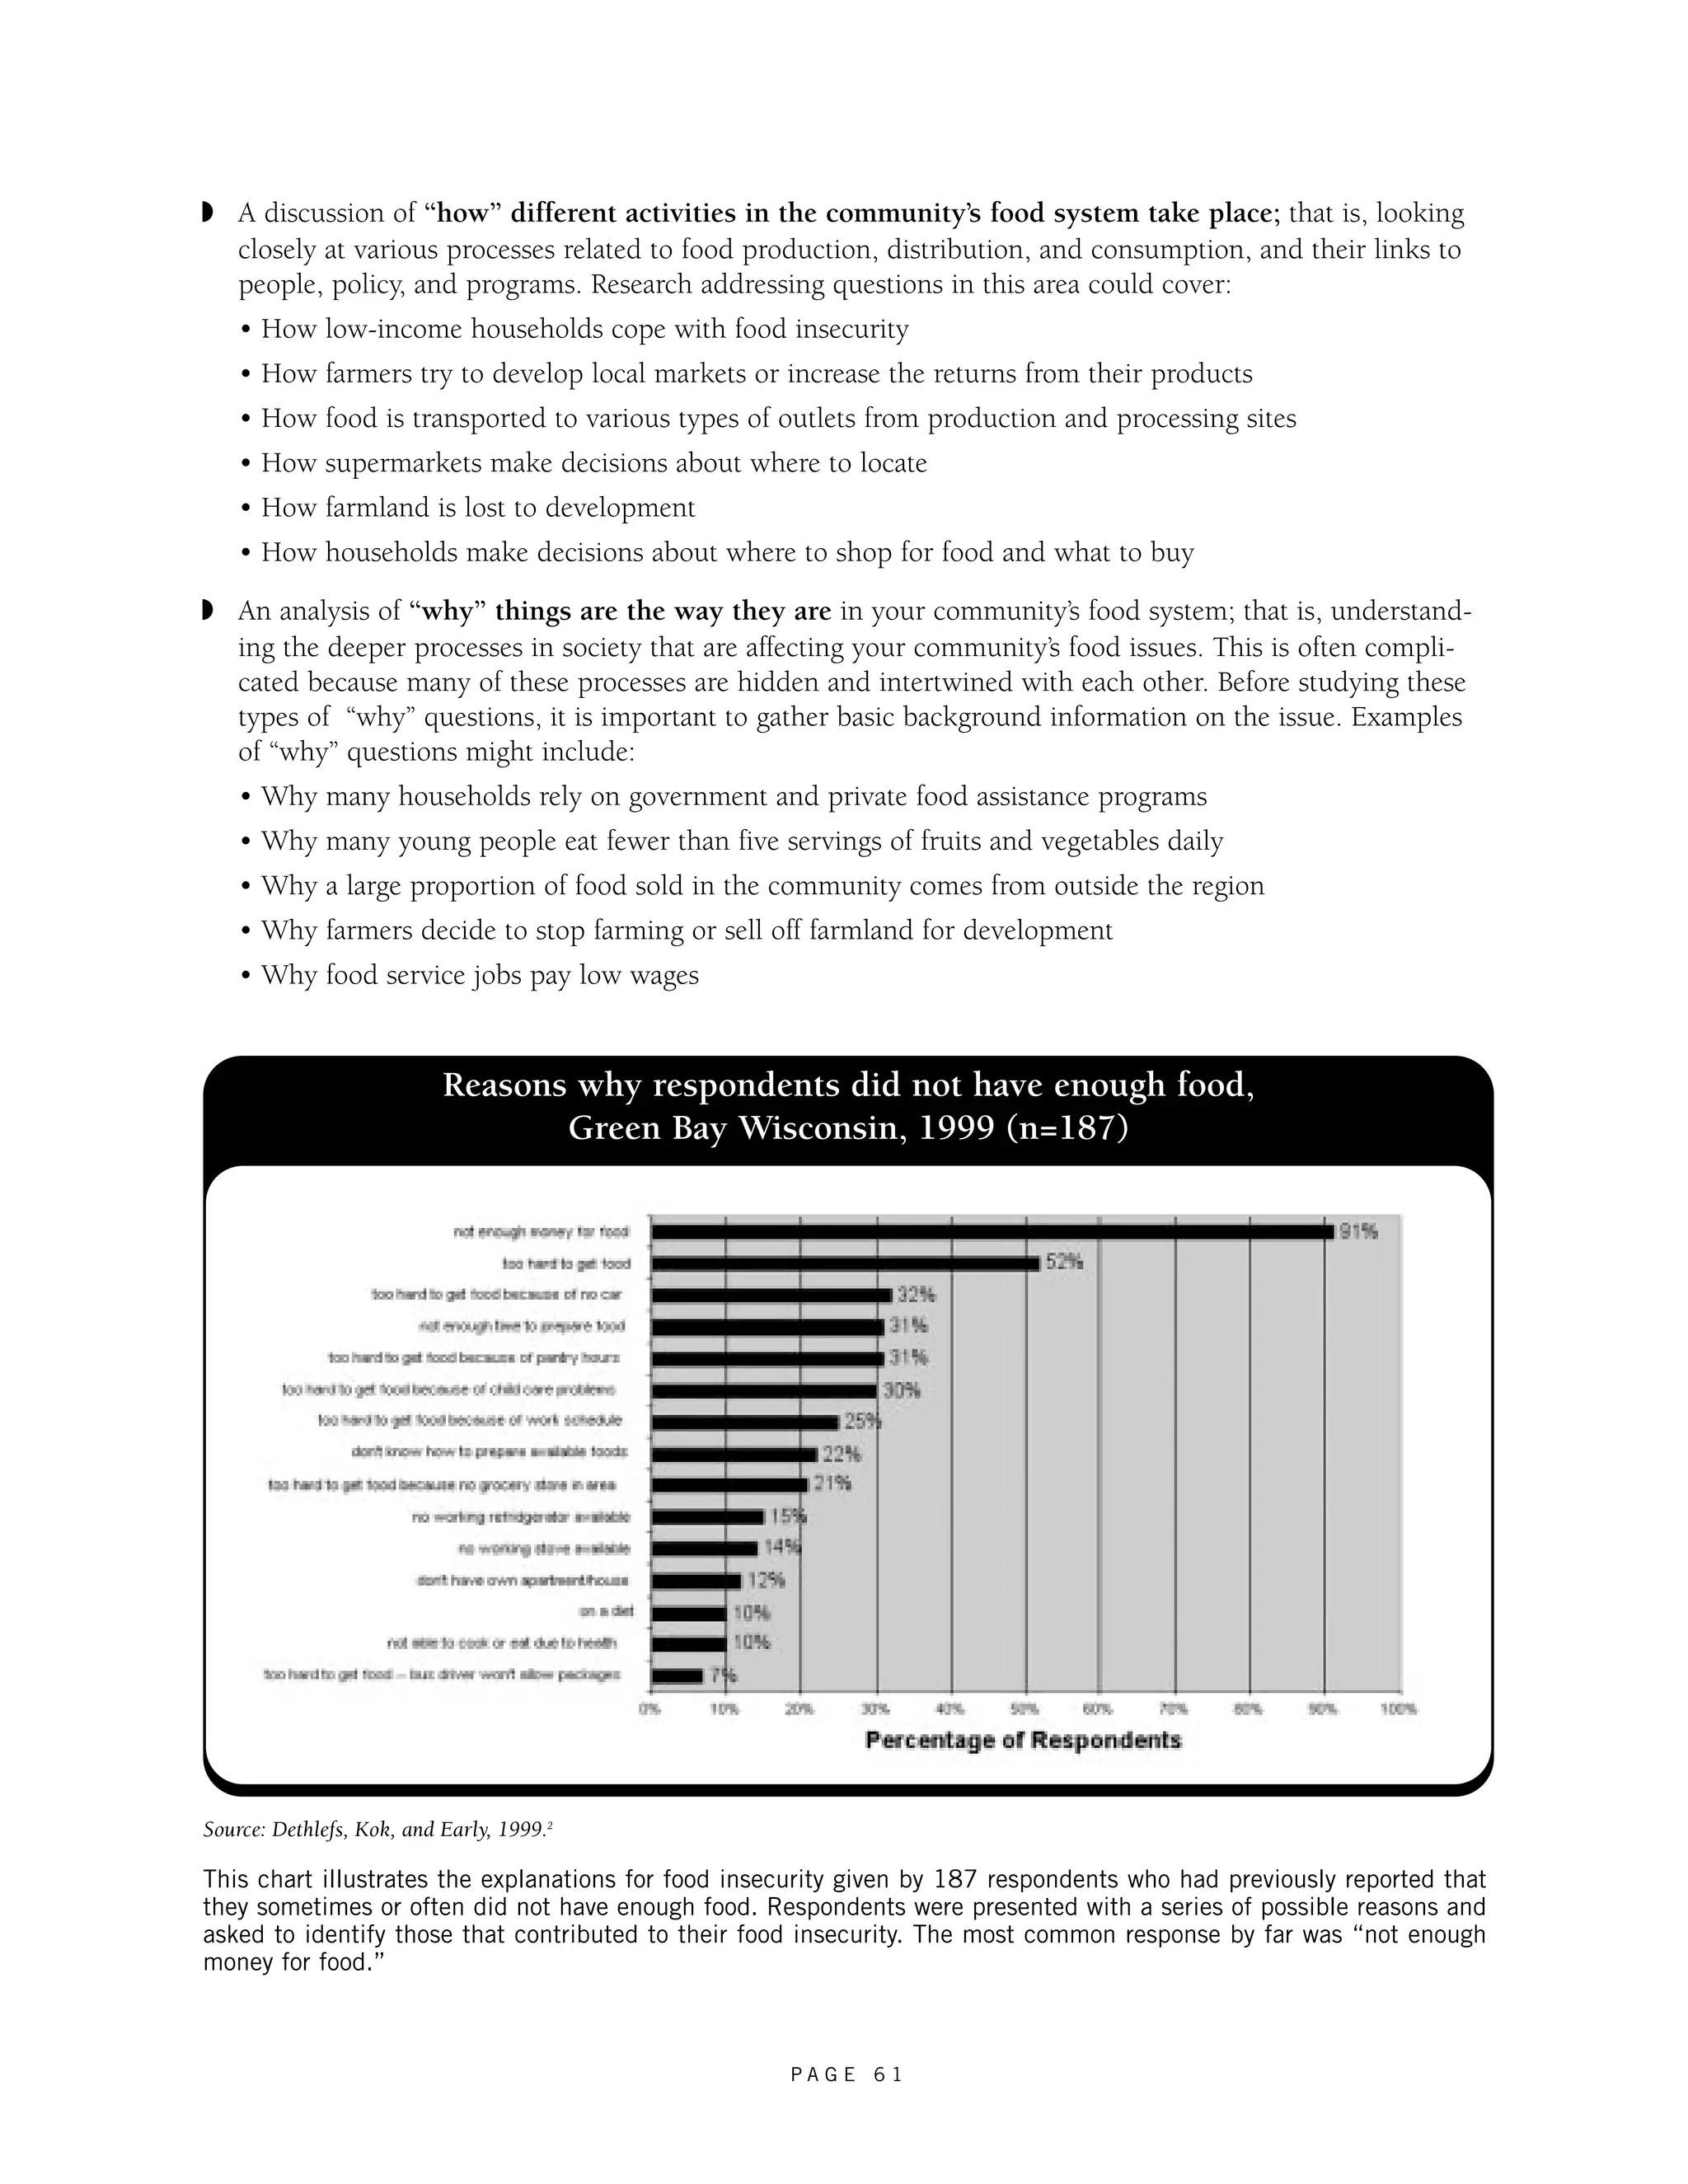

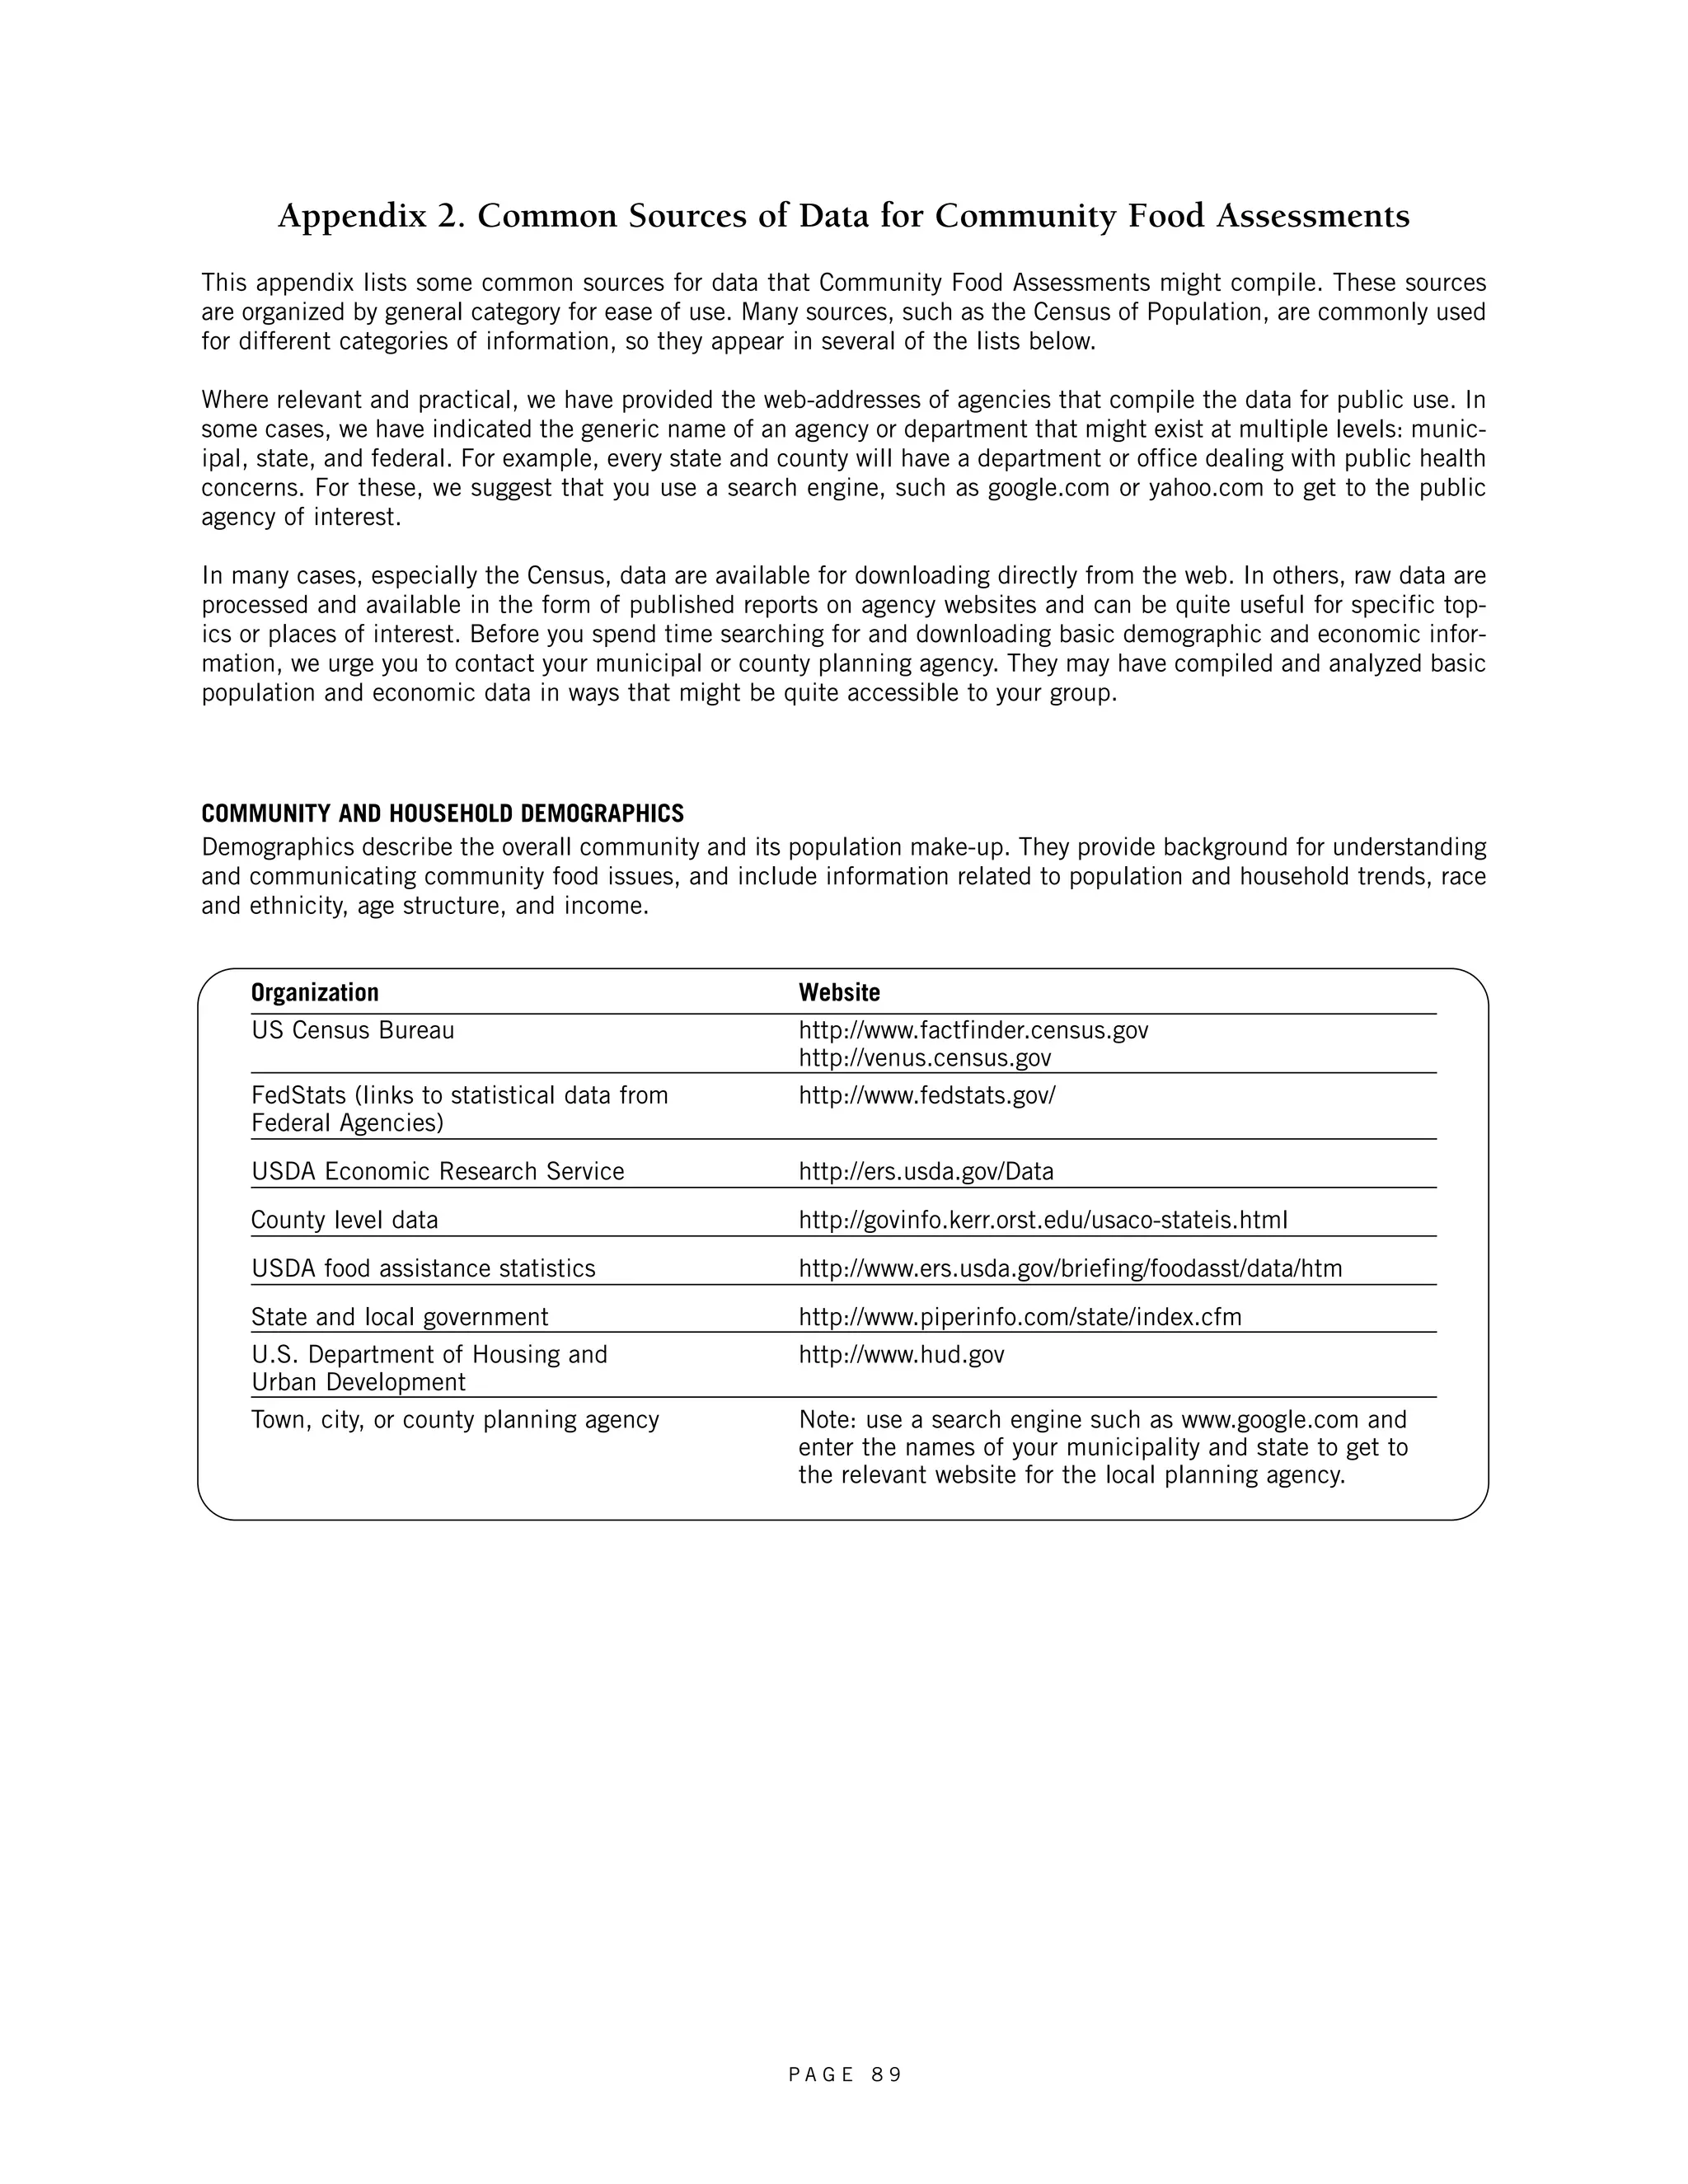


This document provides an introduction to community food assessments. It discusses problems with the current food system, including food insecurity, diet-related health issues, industry concentration, and threats to farming. It then describes the community food security movement, which aims to address these issues through local and sustainable approaches. The document presents community food assessments as a tool that can help communities understand their local food systems and identify opportunities for improvement in line with community food security goals like access, self-reliance, and social justice. It provides an overview of the contents of the guide, which will discuss how to plan, conduct, and apply a community food assessment.


![[브로셔]X-SSW (소프트 스위치)](https://cdn.slidesharecdn.com/ss_thumbnails/x-ssw-110823235741-phpapp02-thumbnail.jpg?width=640&height=640&fit=bounds)


