Download as PDF, PPTX


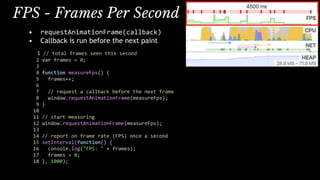
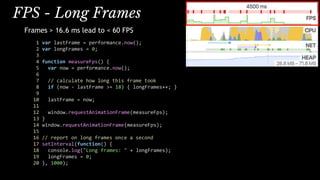
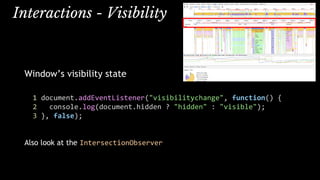
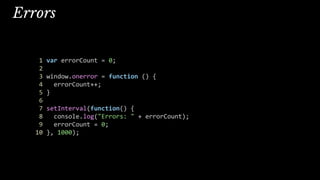
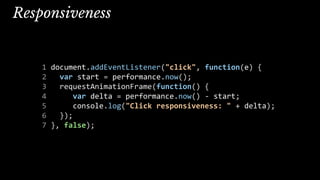
![FPS - Video
HTML5 VIDEO metrics (Chrome/FF)
1 var latestFrame = 0;
2 var latestReportedFrame = 0;
3
4 setInterval(function() {
5 // find the first VIDEO element on the page
6 var vids = document.getElementsByTagName("video");
7 if (vids && vids.length) {
8 var vid = vids[0];
9 if (vid.webkitDecodedFrameCount || vid.mozPaintedFrames) {
10 latestFrame = vid.webkitDecodedFrameCount || vid.mozPaintedFrames;
11 }
12 }
13
14 console.log("Video FPS: "
15 + Math.max(latestFrame - latestReportedFrame, 0));
16
17 // reset count
18 latestReportedFrame = latestFrame;
19 }, 1000);](https://image.slidesharecdn.com/lhph3xisjw57jmuorpht-signature-ec852b1e0ab0808a01cf567d391a606d0dbdf7440a89002fe706d25e353d18a5-poli-160623012341/85/Measuring-Continuity-14-320.jpg)
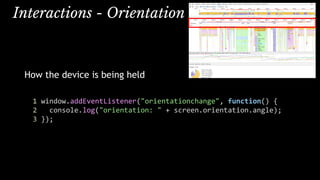
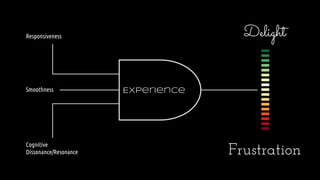
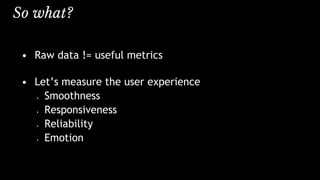
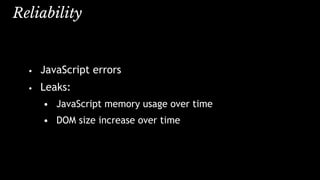
![MutationObserver == change over time
1 var d = document;
2 var mutationCount = 0;
3 var domLength =
4 d.getElementsByTagName("*").length;
5
6 // create an observer instance
7 var observer = new MutationObserver(function(mutations) {
8 mutations.forEach(function(mutation) {
9 if (mutation.type !== "childList") { return; }
10 for (var i = 0; i < mutation.addedNodes.length; i++) {
11 var node = mutation.addedNodes[i];
12 mutationCount++;
13 mutationCount += node.getElementsByTagName ?
14 node.getElementsByTagName("*").length : 0;
15 }
16 });
17 });
18
19 // configure the observer
20 observer.observe(d, { childList: true, subtree: true });
Size - DOM Changes](https://image.slidesharecdn.com/lhph3xisjw57jmuorpht-signature-ec852b1e0ab0808a01cf567d391a606d0dbdf7440a89002fe706d25e353d18a5-poli-160623012341/85/Measuring-Continuity-26-320.jpg)


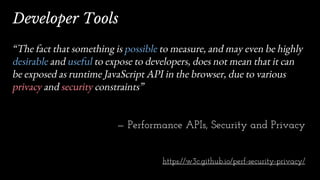
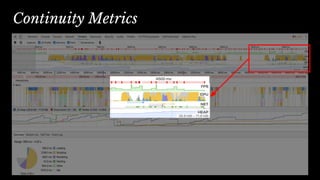
The document discusses various methods for measuring user experience continuity in web applications, focusing on metrics such as frame rate, responsiveness, and user interactions. It details the use of JavaScript for collecting performance data, including techniques for monitoring resource usage, memory, and user engagement through events like clicks and scrolling. Additionally, it emphasizes the importance of interpreting raw data into meaningful metrics that reflect smoothness, responsiveness, and user emotions.


![[1C1]Service Workers](https://cdn.slidesharecdn.com/ss_thumbnails/1c1serviceworkers-140927225946-phpapp02-thumbnail.jpg?width=640&height=640&fit=bounds)