Measuring Brand Equity


OUR PERSPECTIVE
March, 2012
Who Are We?


                                                                                                 INTRODUCTIONS
  Brand Amplitude is an insights-based brand strategy consulting firm.

  Clients include CPG, Retail, B2B, Higher Education, Healthcare.

  Relationships are led by experienced marketing practitioners and industry
   thought leaders, Carol Phillips and Judy Hopelain.

  Supported by a virtual team of research, analytic and consulting associates.


         Client-Side                       Consulting               Agency    Business Faculty
   Illuminations                     Accenture                JWT
   Patagonia                         BCG                      Leo Burnett
   Whirlpool                         Prophet                  Mullen
                                     Swander Pace & Co.       Y&R


           A strong brand is one of a company’s most important assets. By growing
           brand equity, marketers help achieve the organization’s business objectives.

2012 Brand Amplitude, LLC All Rights Reserved            1
 May not be reproduced without permission
What Services Do We Offer?


                                                                                               INTRODUCTIONS
   We help clients solve strategic business and brand issues by leveraging a
    range of proven tools and frameworks.

                                                 – Brand audit

                                                 – Market segmentation

                                                 – Target insights (motivations, culture and
                                                   decision-making)

                                                 – Brand identity and rallying cry

                                                 – Brand positioning

                                                 – Brand architecture

                                                 – Brand activation

                                                 – Brand measurement
2012 Brand Amplitude, LLC All Rights Reserved         2
 May not be reproduced without permission
Why Measure Brand Equity?


                                                                                            BRAND EQUITY MEASUREMENT
  Metrics are an integral part of the brand strategy process.

       Reasons to Measure Brand Equity                 Strategic Marketing Framework


    Understand drivers of brand strength in                I. Business Strategy
     order to support strategic decision –
     making.
                                                             II. Brand Strategy –
                                                     Architecture, Identity & Positioning
    To evaluate performance of brand
     management in increasing equity over                III. Go-to-Market Strategy
     time.
                                                               Value Proposition
    To evaluate efficacy of brand building
     programs -- ROMI.                                      Messaging & Offer Design

                                                              Customer Experience
    To assess the value of the brand for
     purposes of licensing or sale.                  IV. Marketing Execution & Metrics


2012 Brand Amplitude, LLC All Rights Reserved   3
 May not be reproduced without permission
Brand Equity vs. Brand Value


                                                                                                                       BRAND EQUITY MEASUREMENT
   Brand value and brand equity are not the same. Brand value is a financial
    measure specific to a point in time that is especially useful in M&A or licensing.
    Brand equity represents the potential for your brand to impact your business.

        “(For most companies) the operative question is less what their brand is worth
        than what their brand could do for them in terms of revenue and profit.
        …gaining an understanding of the causal activities related to the changes
        would make brand equity measures more actionable.”

                                                                                    -- Tom Reynolds & Carol Phillips
                                     “In Search of True Brand Equity Metrics: All Market Share Ain’t Created Equal”
                                                                              Journal of Advertising Research, 2005


 2012 Brand Amplitude, LLC All Rights Reserved                4
  May not be reproduced without permission
Brand Equity: What Do Experts Recommend?


                                                                                          BRAND EQUITY MEASUREMENT
   Little consensus among experts about the best way to measure brand equity.

          Key Issues:
         •      Definition of equity – brand value vs. impact of customer knowledge
         •      Measurement complexity – many components, unclear weights
         •      Accountability – hard to relate to market share, profitability
         •      Actionability – hard to link to marketing activities, spend, programs
         •      Engagement – limited organizational uptake of results


                                                Leading Brand Equity Measures & Sources


        Source: Journal of Advertising Research, June 2005


2012 Brand Amplitude, LLC All Rights Reserved                      5
 May not be reproduced without permission
How Is Equity Usually Measured in Practice?


                                                                                           BRAND EQUITY MEASUREMENT
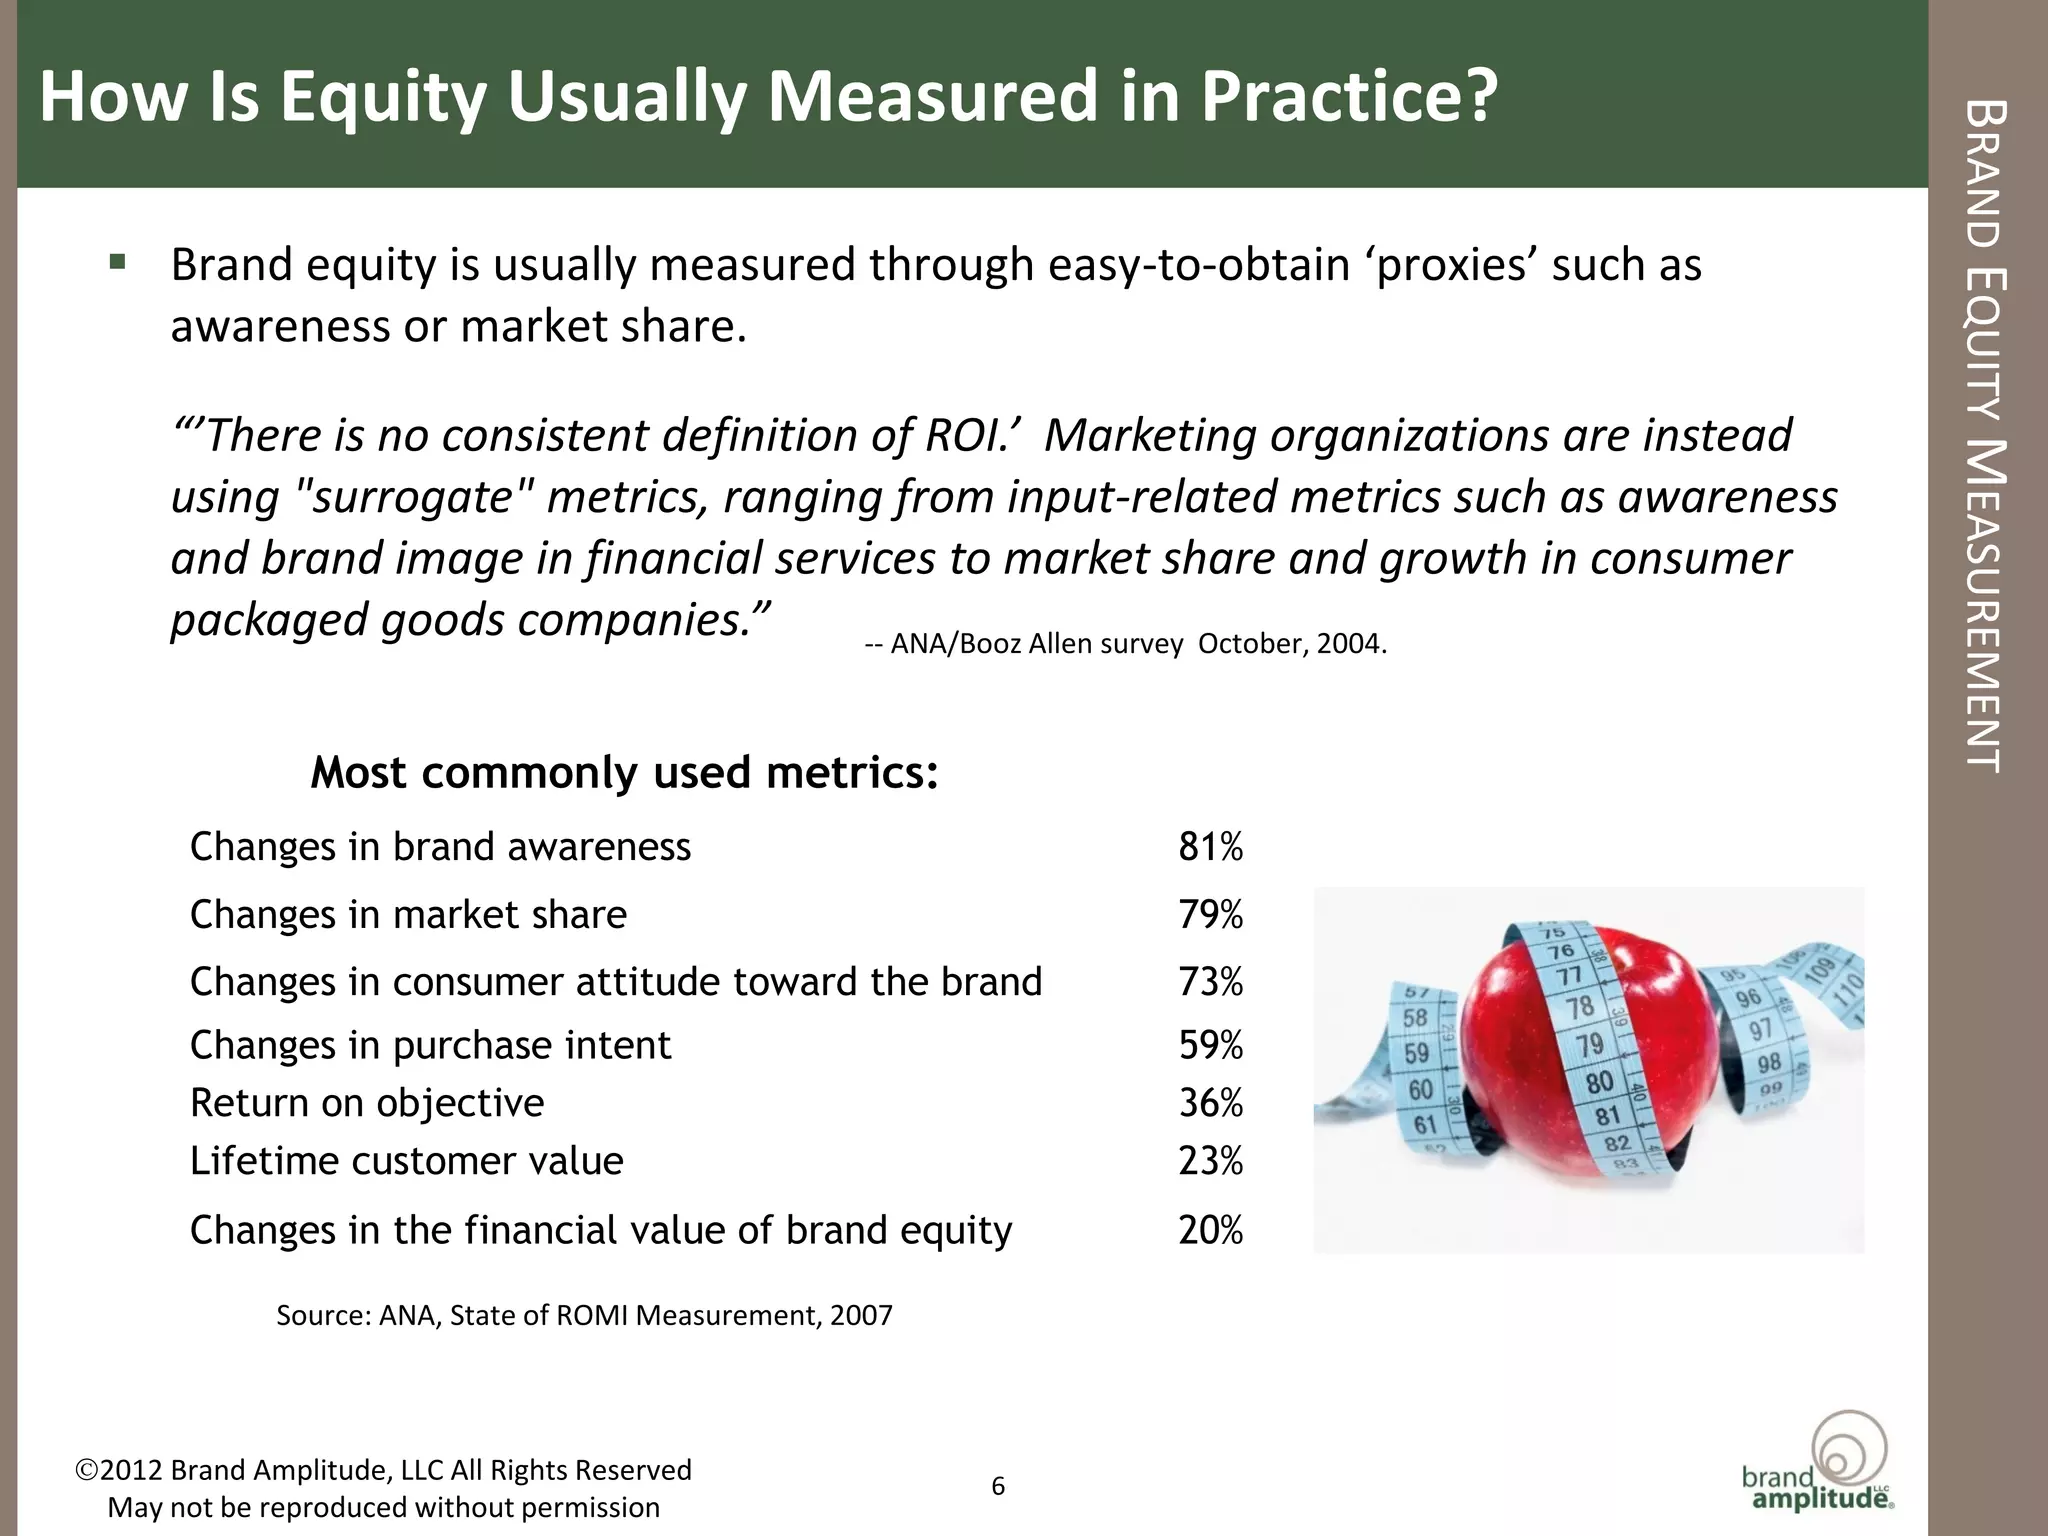
    Brand equity is usually measured through easy-to-obtain ‘proxies’ such as
     awareness or market share.

        “’There is no consistent definition of ROI.’ Marketing organizations are instead
        using "surrogate" metrics, ranging from input-related metrics such as awareness
        and brand image in financial services to market share and growth in consumer
        packaged goods companies.”         -- ANA/Booz Allen survey October, 2004.


                  Most commonly used metrics:
         Changes in brand awareness                                81%
         Changes in market share                                   79%
         Changes in consumer attitude toward the brand             73%
         Changes in purchase intent                                59%
         Return on objective                                       36%
         Lifetime customer value                                   23%
         Changes in the financial value of brand equity            20%

                Source: ANA, State of ROMI Measurement, 2007


 2012 Brand Amplitude, LLC All Rights Reserved                6
  May not be reproduced without permission
Little Standardization – Many Opinions


                                                                                                           BRAND EQUITY MEASUREMENT
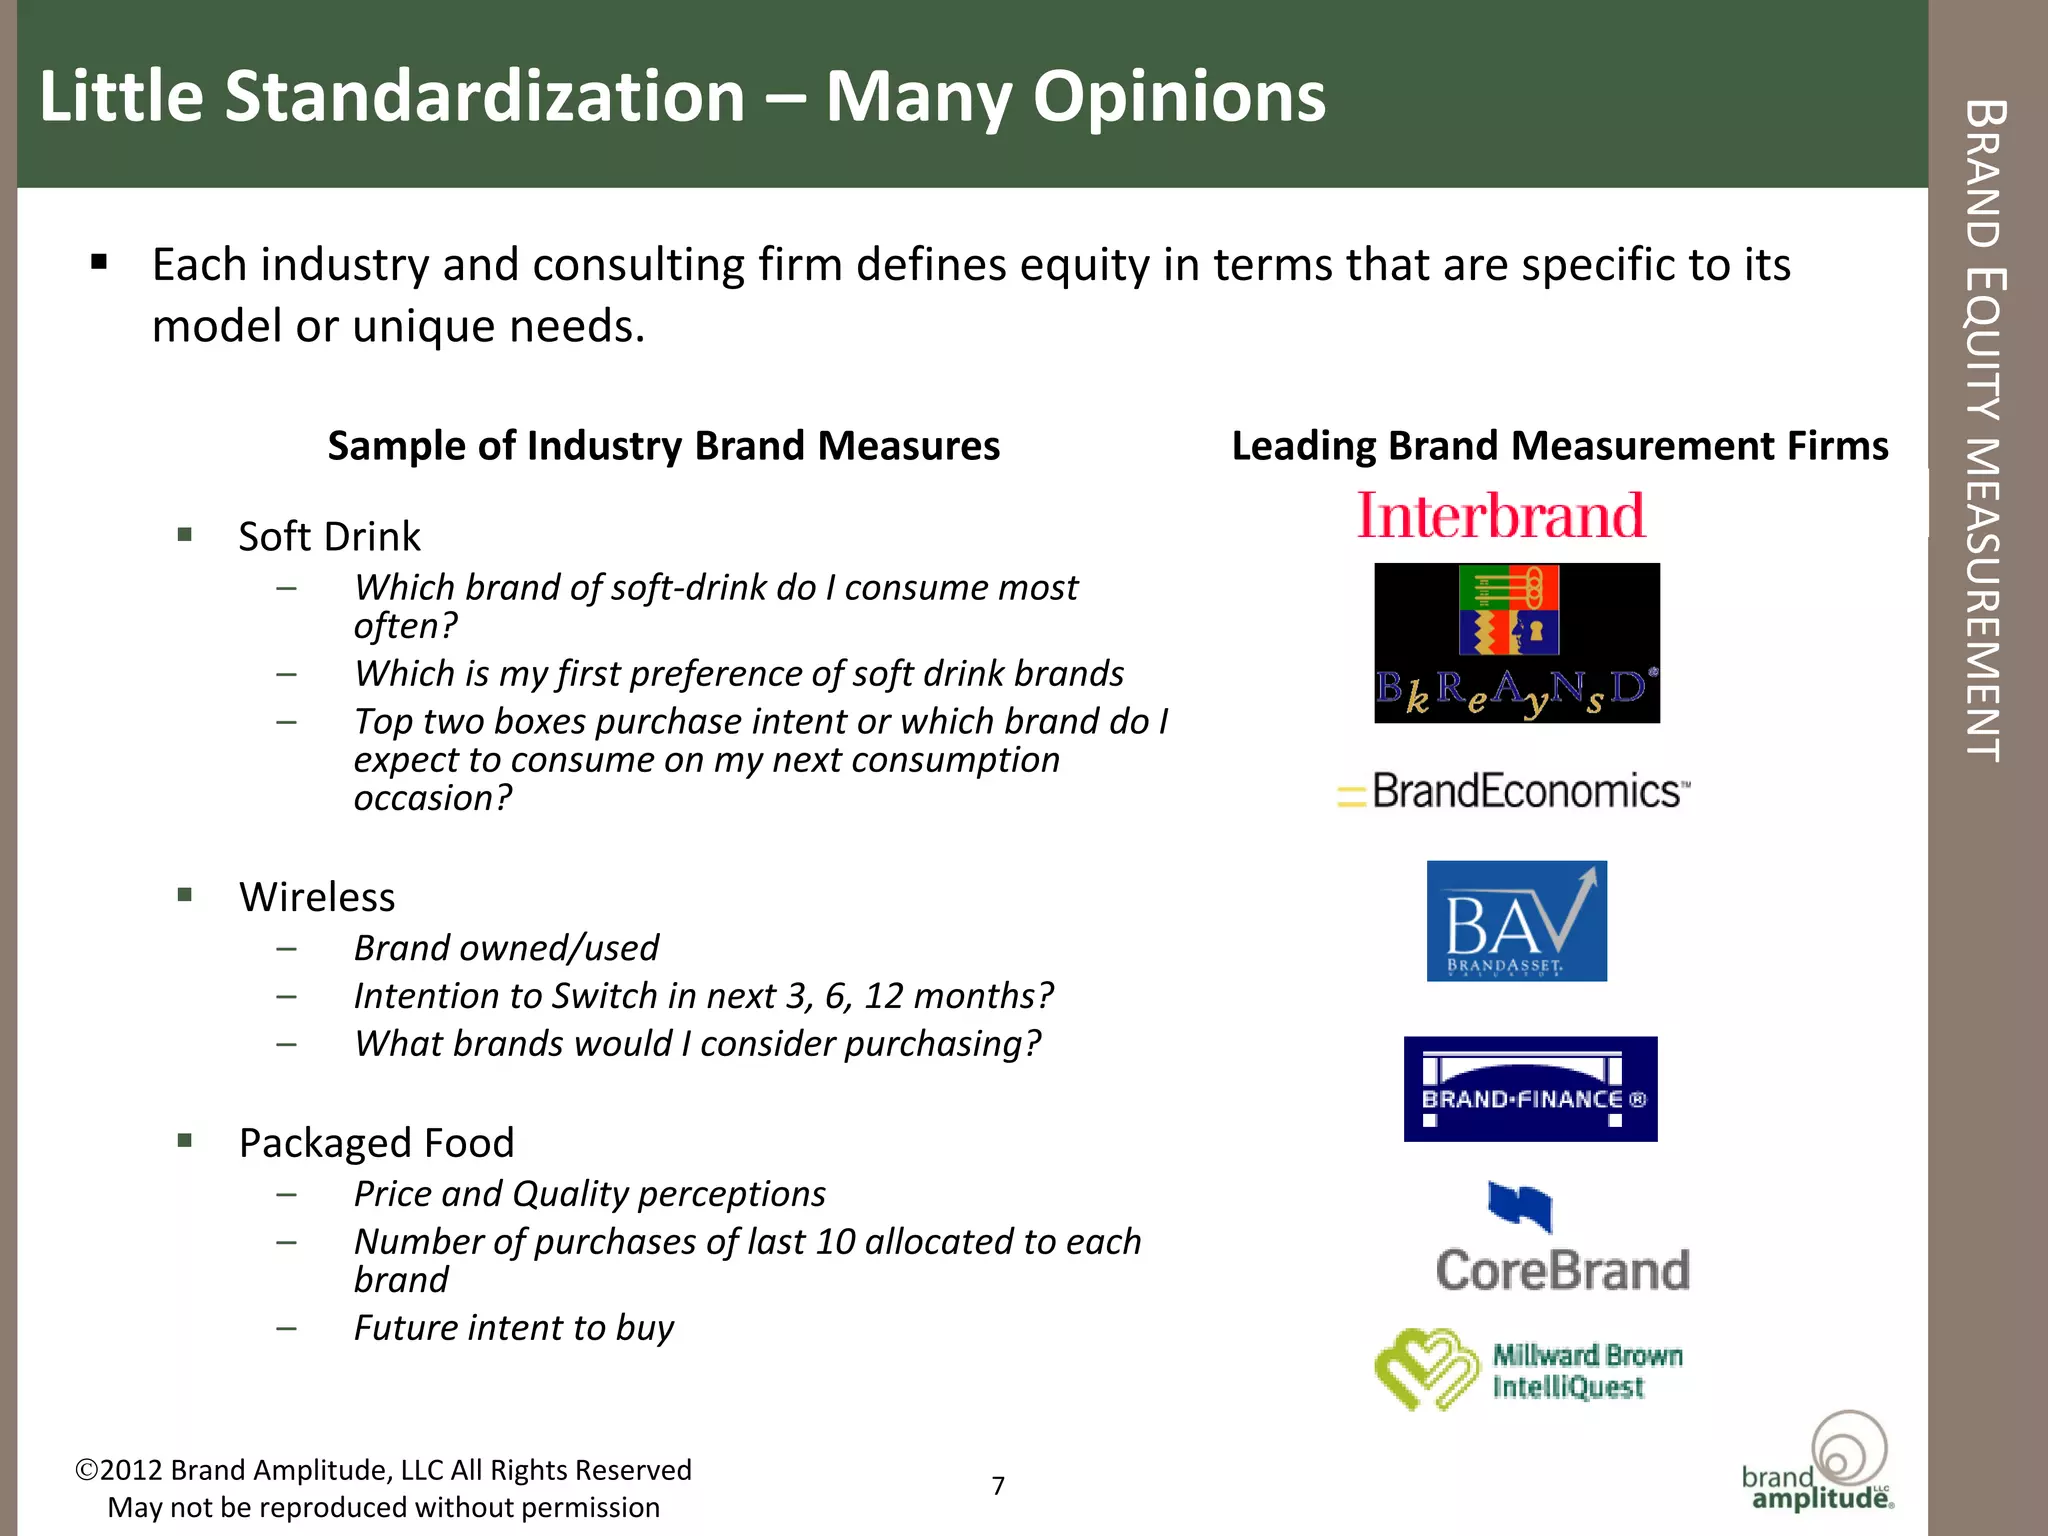
  Each industry and consulting firm defines equity in terms that are specific to its
   model or unique needs.

                    Sample of Industry Brand Measures                    Leading Brand Measurement Firms

         Soft Drink
                –    Which brand of soft-drink do I consume most
                     often?
                –    Which is my first preference of soft drink brands
                –    Top two boxes purchase intent or which brand do I
                     expect to consume on my next consumption
                     occasion?

         Wireless
                –    Brand owned/used
                –    Intention to Switch in next 3, 6, 12 months?
                –    What brands would I consider purchasing?

         Packaged Food
                –    Price and Quality perceptions
                –    Number of purchases of last 10 allocated to each
                     brand
                –    Future intent to buy


 2012 Brand Amplitude, LLC All Rights Reserved              7
  May not be reproduced without permission
What Is the Best Proxy for Brand Equity?


                                                                                                      PERCEPTIONS IMPACT BEHAVIOR
    Brand equity resides in the minds of customers. The best ‘proxy’ is one that best
     captures that intangible idea that impacts choice.

      “Customer-based brand equity is the differential effect that brand knowledge
             has on customer response to the marketing of that brand.”
                                       -- Kevin Keller, Strategic Brand Management, 2008, p. 48


                      $1.99                            $4.18                      $2.29

                                            Which jar would you choose?
       The decision is not driven by price alone, but moderated by the sum of your experiences with
         the brand. This is what enables some brands to charge a premium, while others cannot.

 2012 Brand Amplitude, LLC All Rights Reserved           8
  May not be reproduced without permission
Brand Equity Defined


                                                                                                                                            BRAND EQUITY MEASUREMENT
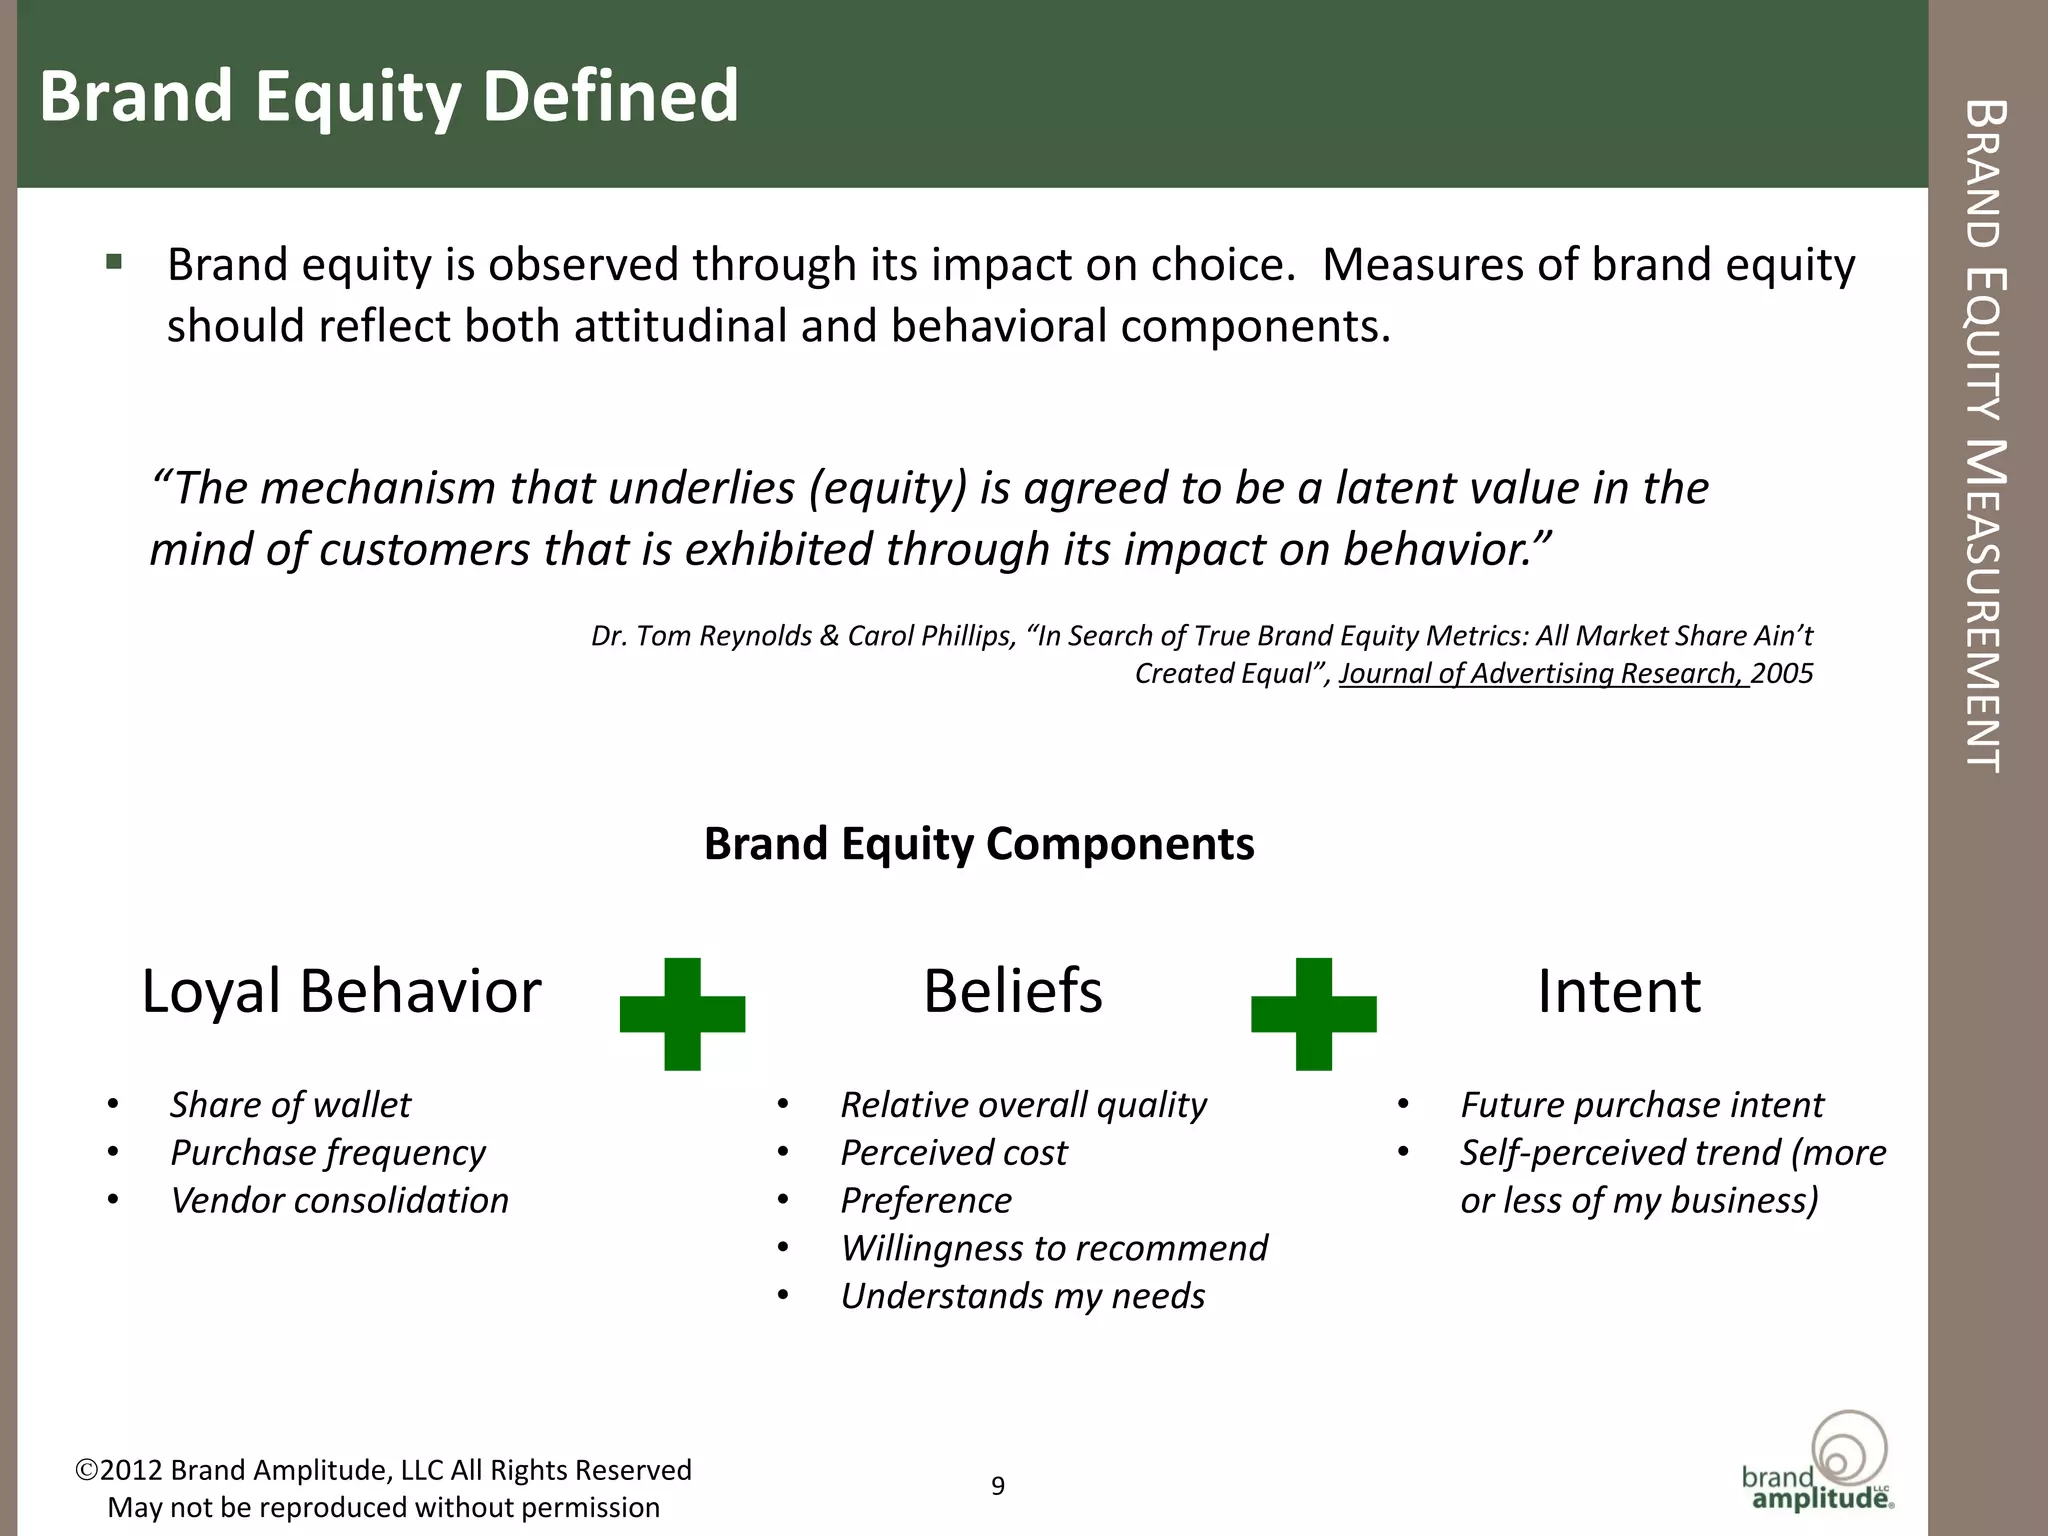
    Brand equity is observed through its impact on choice. Measures of brand equity
     should reflect both attitudinal and behavioral components.


       “The mechanism that underlies (equity) is agreed to be a latent value in the
       mind of customers that is exhibited through its impact on behavior.”
                                       Dr. Tom Reynolds & Carol Phillips, “In Search of True Brand Equity Metrics: All Market Share Ain’t
                                                                                   Created Equal”, Journal of Advertising Research, 2005


                                                  Brand Equity Components

       Loyal Behavior                                            Beliefs                                          Intent
   •    Share of wallet                              •    Relative overall quality                     •    Future purchase intent
   •    Purchase frequency                           •    Perceived cost                               •    Self-perceived trend (more
   •    Vendor consolidation                         •    Preference                                        or less of my business)
                                                     •    Willingness to recommend
                                                     •    Understands my needs


 2012 Brand Amplitude, LLC All Rights Reserved                        9
  May not be reproduced without permission
Share Tiering Approach to Measurement


                                                                                                                               BRAND EQUITY MEASUREMENT
   Just as all calories are not equally nutritious, not all share points contribute equally
    to the health of the brand. Loyal customers are ‘nutrient rich’ and contribute more
    to brand health than the ‘empty calories’ of price sensitive customers.


                                            Loyalty Contribution by Brand
                                       Customers who devote 80% or more of requirements to the brand
                                                                                              37.4%
                                                                  34.5%                                   Sales contributed
                                                                                                          by loyal customers
                                      28.0%
                Market Share


                                                                                                Price
                                  Premium
                               76% Sales                      56% Sales                         Brand?
                                                                                              40% Sales
                                  Brand?


                                    Brand A                     Brand B                      Brand C


            “Size and vitality of the core varies by brand. Every brand could benefit
            from having the core group represent a larger share of its total franchise.”

 2012 Brand Amplitude, LLC All Rights Reserved                       10
  May not be reproduced without permission
Share Tiering Measures


                                                                                                                                      BRAND EQUITY MEASUREMENT
     Goal is to determine how much of a brand’s share is being driven by people
      who are loyal in both attitude and behavior.

        Loyal Behavior                                            Beliefs                                       Intent

      Operationally define loyal                    Classify customers according to                    Classify customers regarding
      behavior in a way that is                     their brand beliefs.                               how typical their recent
      specific to the category (e.g.,                                                                  purchasing has been and
                                                    Determine Total Volume and Loyalty
      80% total category needs).                                                                       whether they expect a shift
                                                    Volume* within each classification.
                                                                                                       in the future.
      Determine what percentage
      of Total Volume is ‘Loyalty
                                                             Superior       Good        Acceptable
      Volume’* by brand.                                      Quality      Quality       Quality

                                             Price Not a
                                                             Advocates   Unconvinced    Indifferents
                                             Barrier

                                             Price a Minor
                                                             Aspirers    Opportunists    Ignorers
                                             Barrier
                                             Price a
                                             Significant     Admirers      Skeptics      Rejectors
                                             Barrier
  *Loyalty volume = brand volume
  contributed by customers who
  are classified as ‘loyal’

 2012 Brand Amplitude, LLC All Rights Reserved                    11
  May not be reproduced without permission
Share Tiering Metrics


                                                                                                       BRAND EQUITY MEASUREMENT
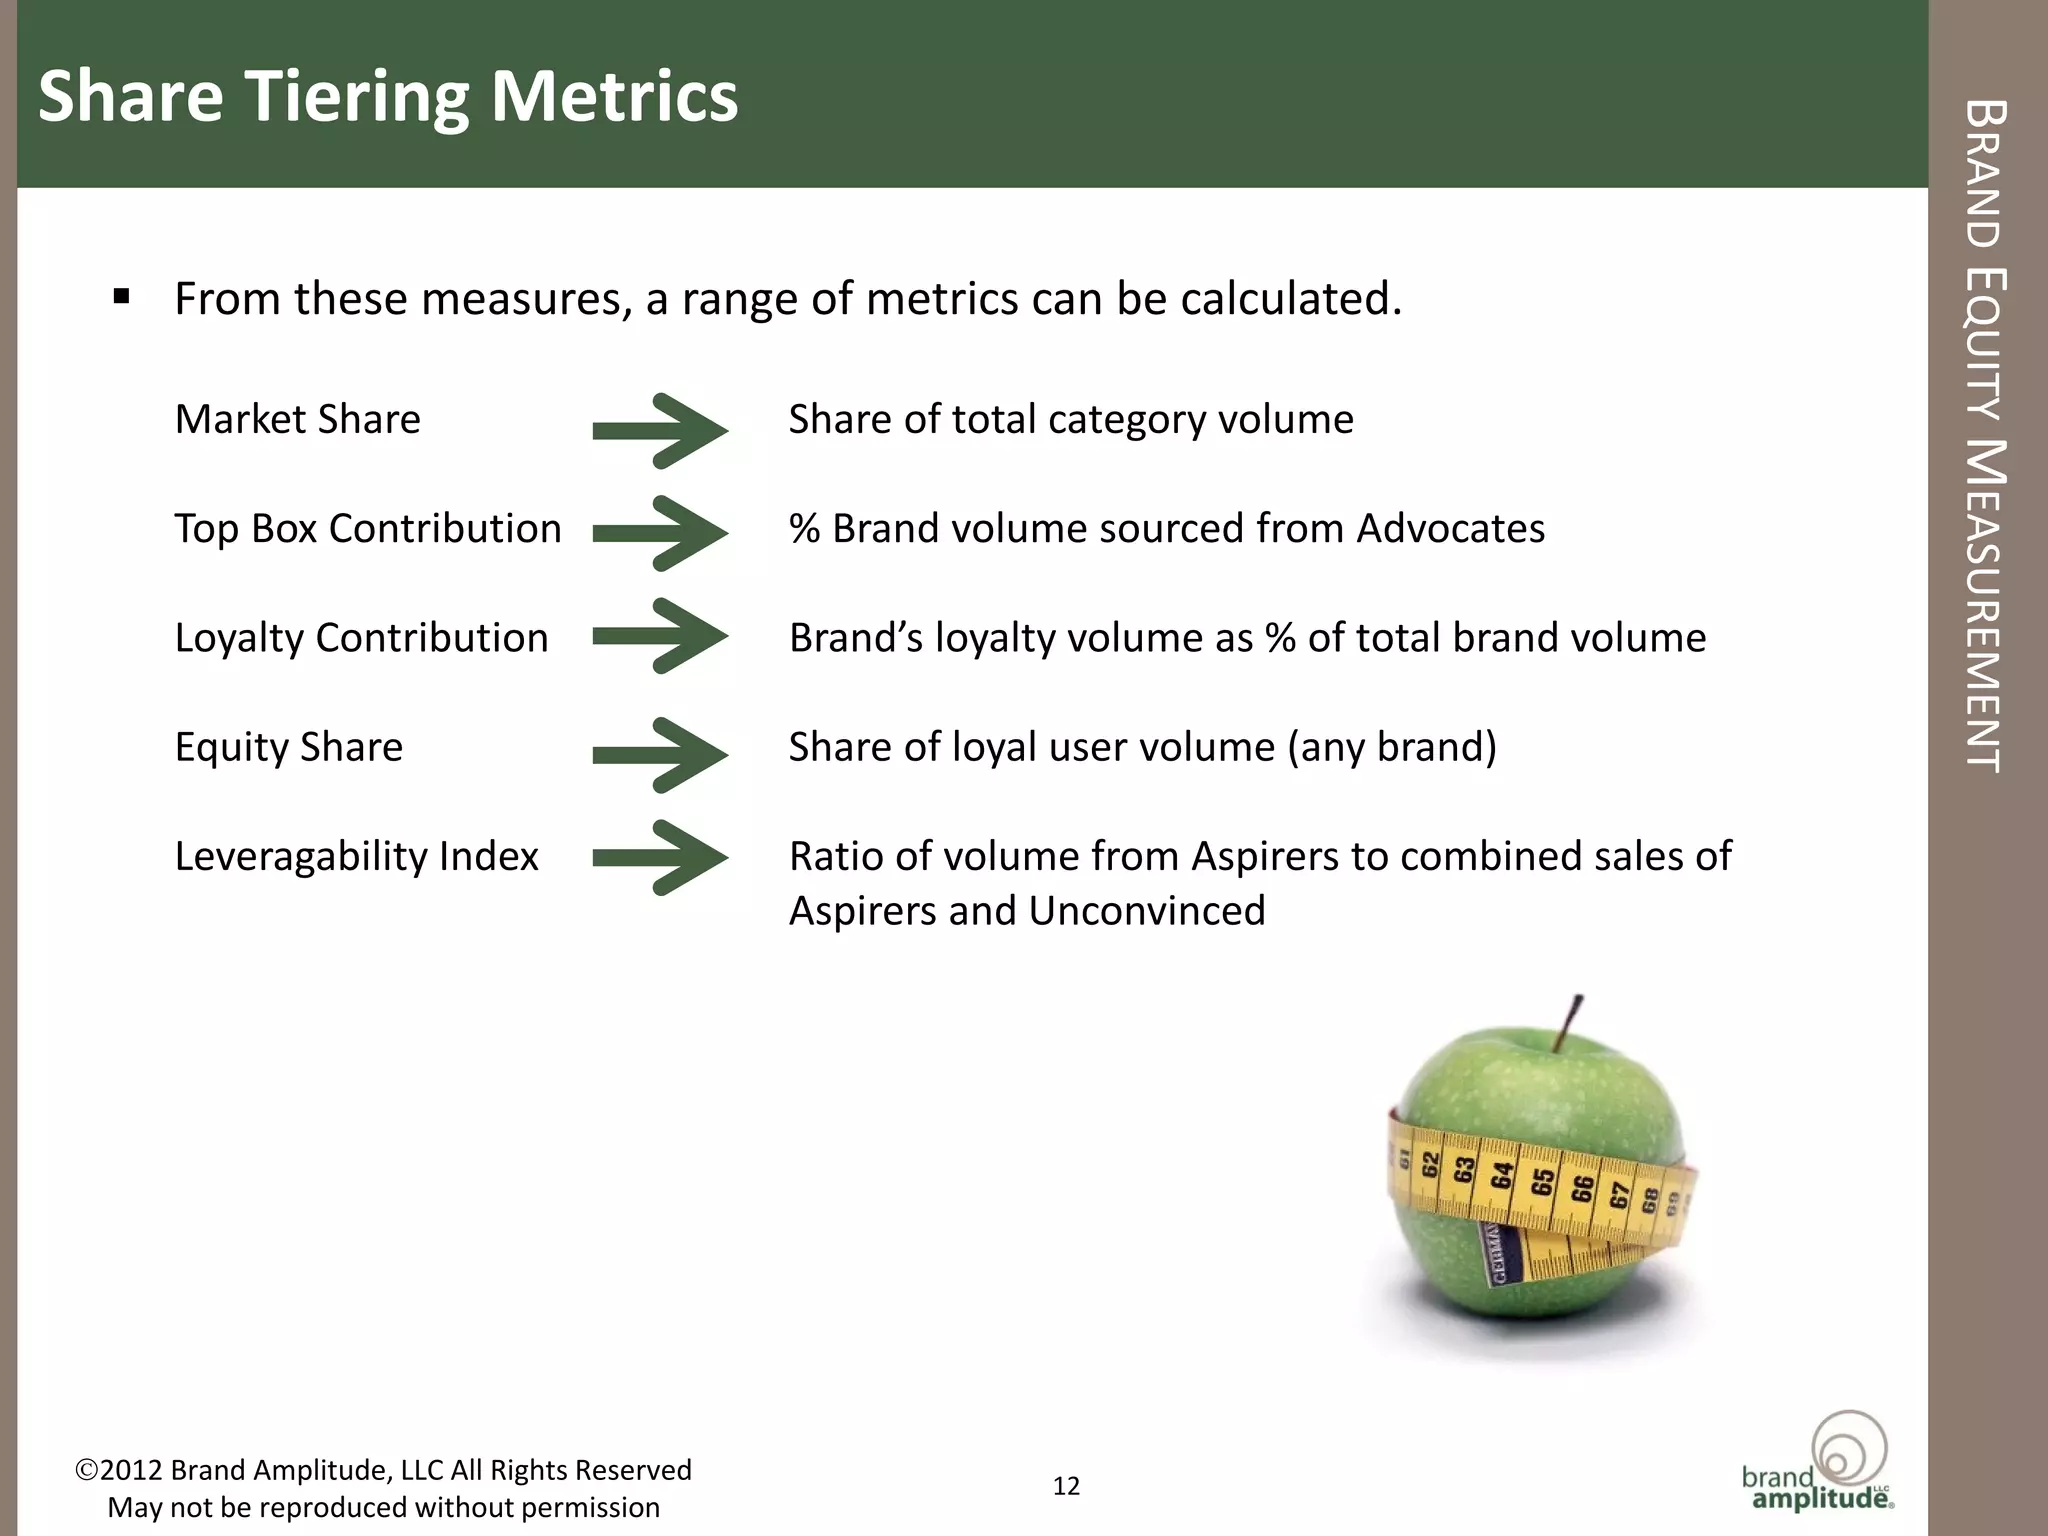
    From these measures, a range of metrics can be calculated.

        Market Share                              Share of total category volume

        Top Box Contribution                      % Brand volume sourced from Advocates

        Loyalty Contribution                      Brand’s loyalty volume as % of total brand volume

        Equity Share                              Share of loyal user volume (any brand)

        Leveragability Index                      Ratio of volume from Aspirers to combined sales of
                                                  Aspirers and Unconvinced


 2012 Brand Amplitude, LLC All Rights Reserved                 12
  May not be reproduced without permission
Example of Sharing Tiering


                                                                                                                              BRAND EQUITY MEASUREMENT
   Consumer beliefs regarding Ragu and Prego are similar – what explains their
    very different market shares?
                               Market Share Spaghetti Sauce Category - Self Report Data*


                                           Other, 23%
                                                                          Ragu, 46%
                        Store, 6%
                                                                                            52% rate quality ‘superior’;
                                                                                            42% say ‘cost is not a barrier’
                                             Prego, 25%                                     to purchase.


         57% rate quality ‘superior’;
         44% say ‘cost is not a
         barrier’ to purchase.


     n=417 male and female primary grocery shoppers who purchased spaghetti sauce in past 3 months, 2005
     Volume expressed in units of jars, cans, tubs.

 2012 Brand Amplitude, LLC All Rights Reserved                     13
  May not be reproduced without permission
Example of Share Tiering


                                                                                                                  BRAND EQUITY MEASUREMENT
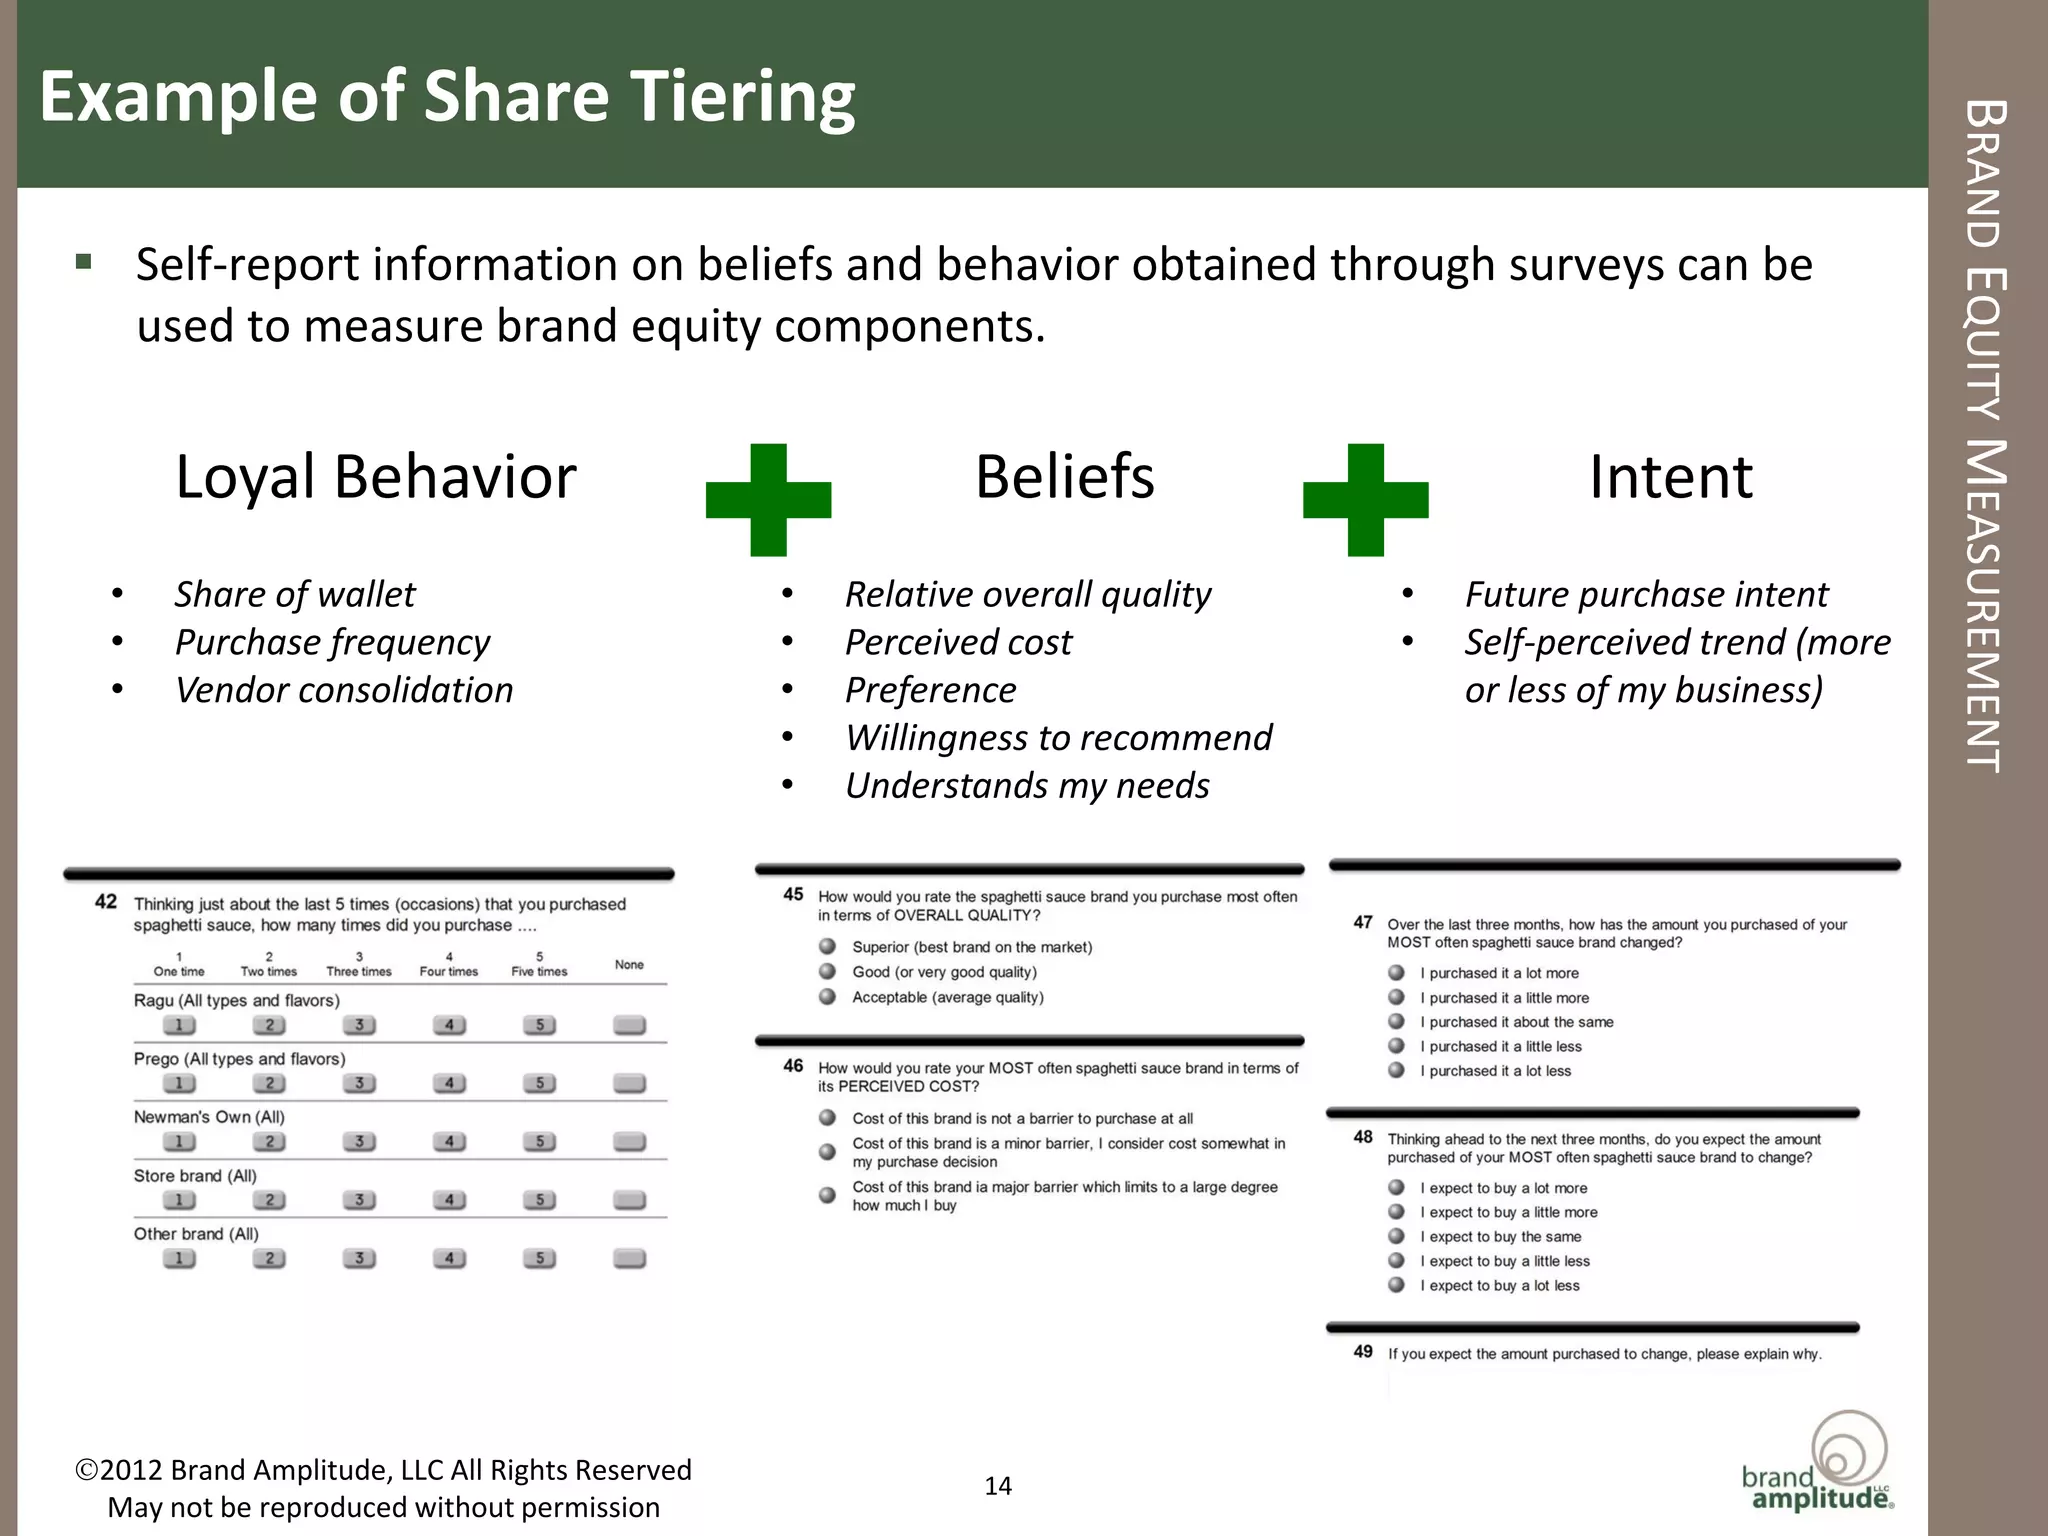
  Self-report information on beliefs and behavior obtained through surveys can be
   used to measure brand equity components.


        Loyal Behavior                                       Beliefs                        Intent
   •    Share of wallet                           •   Relative overall quality   •   Future purchase intent
   •    Purchase frequency                        •   Perceived cost             •   Self-perceived trend (more
   •    Vendor consolidation                      •   Preference                     or less of my business)
                                                  •   Willingness to recommend
                                                  •   Understands my needs


 2012 Brand Amplitude, LLC All Rights Reserved              14
  May not be reproduced without permission
Example of Share Tiering


                                                                                                                      BRAND EQUITY MEASUREMENT
   Share tiering reveals that Ragu derives more volume from its core customers –
    those who think it is superior and worth the price. This data reflects volume;
    profitability is most likely even more skewed.

                    Share Tiers Based on Volume


              Share of Volume                     Share of Volume
                  Q1        Q2      Q3                Q1         Q2      Q3
                                                                              Ragu derives nearly 38% of its
    P1         37.9% 11.4%        1.6%       P1    15.0%      14.3%    7.3%   volume from Advocates while Prego
    P2         26.1% 13.0%        6.2%       P2    32.3%      21.8%    0.4%   derives just 15% from its Advocates.
    P3          0.5%      1.4%    1.8%       P3     2.3%       2.7%    3.8%

               Loyalty Share                       Loyalty Share
                                                                              A higher proportion of Ragu volume is
                  Q1       Q2       Q3                Q1         Q2      Q3
    P1         80.0% 65.8%       76.9%       P1    57.0%     31.0%    90.9%   ‘Loyalty Volume’, even among those
    P2         84.8% 15.2%        0.0%       P2    51.5%     10.7%     0.0%   with high future intent.
    P3          0.0%     0.0%     0.0%       P3     0.0%      0.0%     0.0%


 2012 Brand Amplitude, LLC All Rights Reserved                 15
  May not be reproduced without permission
Example of Share Tiering


                                                                                                                                      BRAND EQUITY MEASUREMENT
   Share tiering provides direction for improving Prego brand equity relative to Ragu.

           Prego is vulnerable - its market share is a misleading indicator of its brand health, as
            much of the volume is driven by non-loyal customers.

           Prego is strongly ‘leveragable’ – the brand should focus on driving volume among
            ‘Aspirers’ by convincing them Prego’s superior quality is ‘worth the price’.


                                                                                         Advocate             Leveragability
                                                Equity Share          Loyalty           Contribution              Index
                           Market Share             (Share of       Contribution      (Contribution of top (Ratio of Aspirer volume
                           (Share of category     category loyal   (Loyal user volume box respondents to      to Total Aspirer +
                                volume)           user volume)         as % total)         volume)          Unconvinced volume)
           Ragu                  46%                  51%                63%                 30%                    70%
           Prego                 25%                  20%                44%                  9%                    69%
           Store                  6%                   4%                33%                 23%                     0%
           Other                 23%                  26%                66%                 16%                    60%
           TOTAL                100%                 100%                57%                 21%                    64%
                   Loyal users = 4 of last 5 purchases devoted to one brand.
                   Advocates = those who rate brand superior on quality, price is no barrier to purchase


 2012 Brand Amplitude, LLC All Rights Reserved                         16
  May not be reproduced without permission
Advantages of Share Tiering


                                                                                     BRAND EQUITY MEASUREMENT
    Measures are understandable, not black box

    Easily translated into financial strength and ROI

    Yields universal metrics that can be applied across categories, brands, SBU’s

    Questions are easy to administer, so equity can be assessed more frequently

    Frequent measurement allows tracking of changes over time

    Allows modeling relative to marketing activities and investments


 2012 Brand Amplitude, LLC All Rights Reserved   17
  May not be reproduced without permission
Other Directions in Brand Equity Measurement


                                                                                                                 BRAND EQUITY MEASUREMENT
    Academics are actively proposing improved ways to measure brand equity, but
     each tends to emphasize a different aspect – belief, behavior, intent.

                Metric                  Publication             Author                  Definition
         Corporate Branding            Leveraging the                         Reputation, communications &
                                                           James R. Gregory
               Index                  Corporate Brand                             financial performance
                                                                              Difference between percentage
         Net Promoter Score           The Loyalty Effect     Fred Reichfeld       of brand promoters and
                                                                                         detractors
          Driving Customer                                                     Sum of the lifetime volues of
                                      Customer Equity         Roland Rust
                Equity                                                         current and future customers

               Energized                                   John Gerzema and Palpable and measurable energy
                                      The Brand Bubble
            Differentiation                                    Ed Lebar       that fosters irrational fidelity


 2012 Brand Amplitude, LLC All Rights Reserved                   18
  May not be reproduced without permission
Recommended Approach


                                                                                                BRAND EQUITY MEASUREMENT
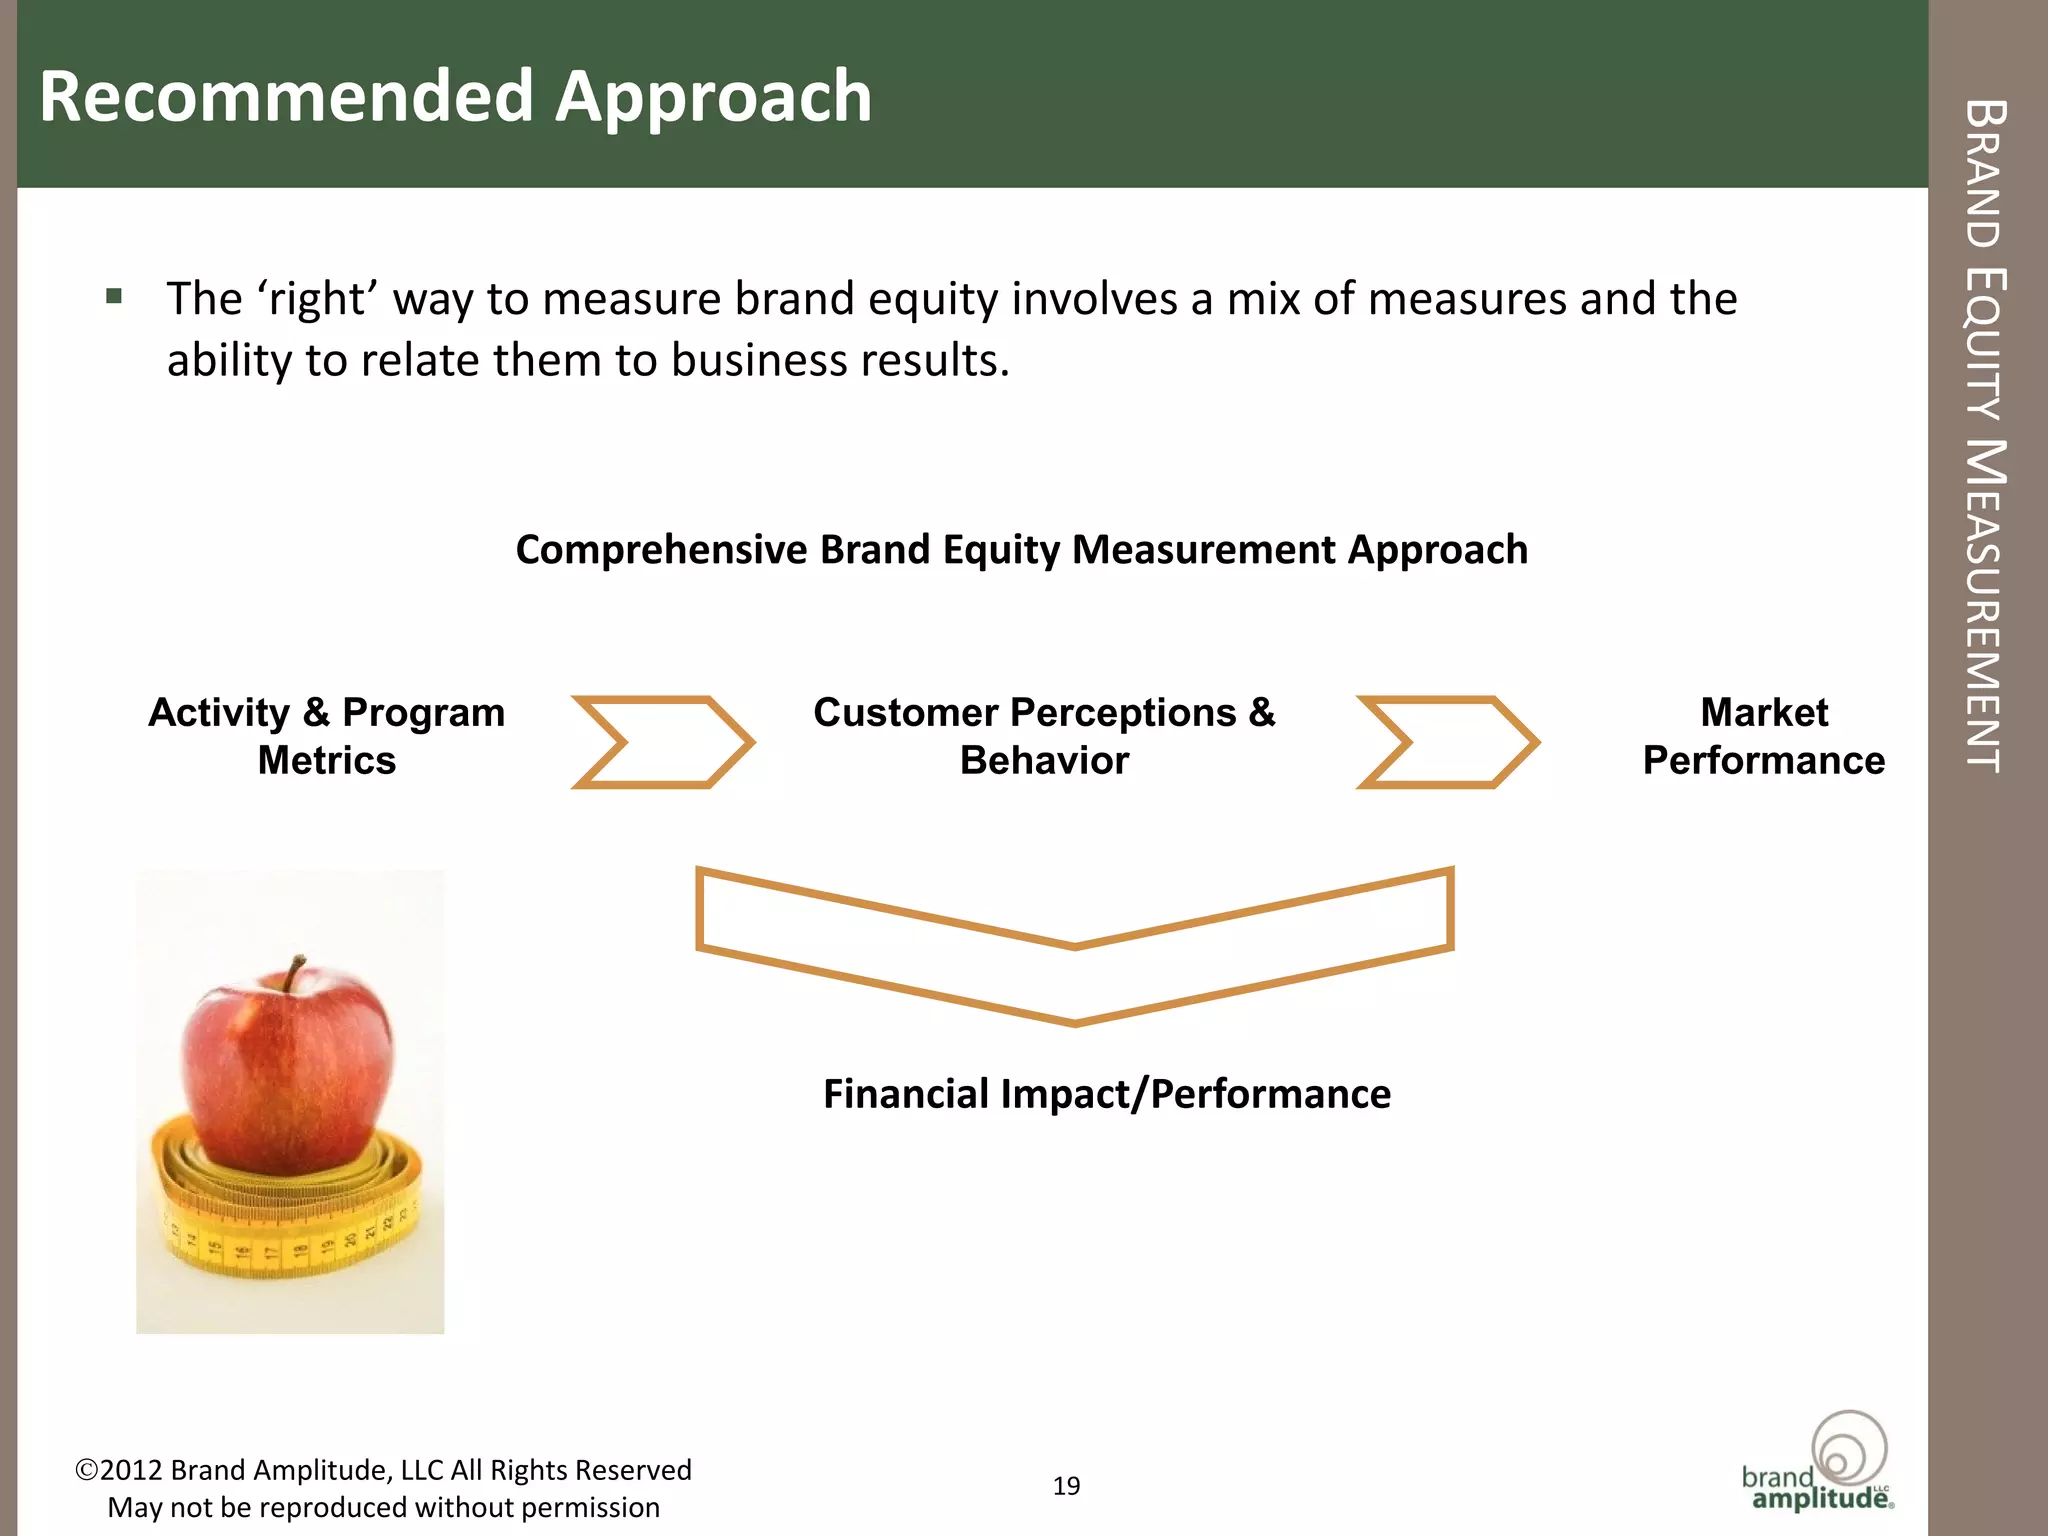
   The ‘right’ way to measure brand equity involves a mix of measures and the
    ability to relate them to business results.


                                Comprehensive Brand Equity Measurement Approach


     Activity & Program                          Customer Perceptions &              Market
           Metrics                                     Behavior                   Performance


                                                 Financial Impact/Performance


2012 Brand Amplitude, LLC All Rights Reserved              19
 May not be reproduced without permission
Key Takeaways


                                                                                               BRAND EQUITY MEASUREMENT
   Understand the difference between brand equity and brand value –
    which is more important to you to know?
   Recognize there is no silver bullet
         –     Requires a thoughtful approach based on a clear idea of how brand equity
               manifests itself in your business -- what behaviors and attitudes drive brand
               value for customers and investors?
         –     Use a mix of measures – belief, behavior, intent, financial
   Tie measures to strategy
         –     If possible, model the relationship between brand equity measures and
               business performance to determine equity drivers
   Be consistent
         –     Movies work better than ‘snapshots’ – pick a method and stay with it to
               build knowledge over time
   Prioritize measures
         –     Don’t confuse data with insight – make it meaningful or it will be ignored
         –     Most companies suffer more from too much data than from too little

2012 Brand Amplitude, LLC All Rights Reserved       20
 May not be reproduced without permission
CONTACT US
                                                                       How Can We Help You Grow?


                                             To Learn More, Contact Us:

             Carol Phillips                                                  Judy Hopelain
             carol@brandamplitude.com                             judy@brandamplitude.com
             269-429-6526                                                      415-810-8268


2012 Brand Amplitude, LLC All Rights Reserved               21
 May not be reproduced without permission