
Recommended
More Related Content
What's hot
What's hot (20)
Similar to Measuring All of YouTube
Similar to Measuring All of YouTube (20)
Recently uploaded
Recently uploaded (20)
Measuring All of YouTube
- 1. The YouTube Social Network Mirjam Wattenhofer Google Zurich mirjam@google.com Roger Wattenhofer ETH Zurich wattenhofer@ethz.ch Zack Zhu∗ ETH Zurich zazhu@ethz.ch Abstract Today, YouTube is the largest user-driven video con- tent provider in the world; it has become a major plat- form for disseminating multimedia information. A ma- jor contribution to its success comes from the user-to- user social experience that differentiates it from tradi- tional content broadcasters. This work examines the so- cial network aspect of YouTube by measuring the full- scale YouTube subscription graph, comment graph, and video content corpus. We find YouTube to deviate sig- nificantly from network characteristics that mark tradi- tional online social networks, such as homophily, re- ciprocative linking, and assortativity. However, compar- ing to reported characteristics of another content-driven online social network, Twitter, YouTube is remarkably similar. Examining the social and content facets of user popularity, we find a stronger correlation between a user’s social popularity and his/her most popular con- tent as opposed to typical content popularity. Finally, we demonstrate an application of our measurements for classifying YouTube Partners, who are selected users that share YouTube’s advertisement revenue. Results are motivating despite the highly imbalanced nature of the classification problem. Introduction YouTube is a key international platform for socially-enabled media diffusion. According to public statistics, more than 48 hours of video content is uploaded every minute and 3 billion views are generated every day. To complement the content broadcast/consume experience, YouTube connects seamlessly with major online social networks (OSNs) such as Facebook, Twitter, and Google+ to facilitate off-site diffu- sion. In fact, 12 million users have linked their YouTube ac- count with at least one such OSN for auto-sharing, and more than 150 years of YouTube content is watched on Facebook every day. More importantly, YouTube serves as a popular social net- work on its own, connecting registered users through sub- scriptions that notify subscribers of social and content up- dates of the subscribed-to users. In this paper, we lever- ∗ Zack Zhu conducted this research while visiting Google. He is currently at the Wearable Computing Laboratory in ETH Zurich. Copyright c 2012, Association for the Advancement of Artificial Intelligence (www.aaai.org). All rights reserved. age full-scale data of the YouTube social network to answer practical questions from a graph theoretic point of view. We shed light on the following: 1. What can be observed from the complete YouTube social network topology? How does it compare with other social networks in terms of intrinsic properties and emergent ob- servations? 2. On the YouTube platform, how do users connect and in- teract with each other? What is the relationship between the explicit and implicit social graphs describing the sub- scription and commenting relationships? 3. What constitutes popularity on YouTube? How does a user’s topological (social) popularity correlate with his/her content popularity? Our analyses will illustrate that YouTube deviates sig- nificantly from traditional OSN characteristics. However, it concurs with the observations of Kwak, Lee, Park, and Moon for the Twittersphere (2010). We will see a surprising dichotomy of content and social activities on the YouTube platform, indicating that YouTube is, distinctly, as much a social network as it is a content-diffusion platform. Finally, we note social popularity on YouTube correlates more with the maximum content popularity achieved as opposed to the summary measures of content popularity. These observations lead to the conjecture that a new class of social network is emerging, a type that facilitates indirect socialization via a gluing content layer in between directed users-to-user interaction. Potentially, a paradigm shift is tak- ing place for OSNs such that what constitutes “social” now incorporates user-content-user interaction in addition to the traditional user-user interaction. Through intrinsically dif- ferent linking and interacting characteristics, these content- driven social networks create new social dynamics and ne- cessitate further research to better understand their role in the processes of socialization and information diffusion. Background and Related Work Recent surge of OSN popularity has attracted the attention of researchers from a variety of fields. Here, the surveyed works are divided into two categories: OSN measurements and machine learning-based OSN applications.
- 2. OSN Measurements Researchers have taken advantage of the YouTube Data API to measure a variety of metrics in relation to video popular- ity on YouTube. Studies by Cha et al. (2007), Benevenuto et al. (2009), and Cheng et al. (2008) all analyze this video corpus for the purposes of understanding video popularity. However, by measuring at the video-level, user-based social characteristics are largely omitted. We build on these works by aggregating YouTube’s video corpus metrics at the user level to complement content metrics with social topology. In this way, we are able to make the connection between video content popularity and corresponding social popular- ity. Even though these works make efforts to avoid sam- pling biases while accessing the data through a rate-limiting YouTube API and/or online crawlers, the datasets collected are only fractions of the entire corpus. In this work, we ob- tain data from within YouTube to allow complete measure- ments. Researchers Mislove, Marcon, Gummadi, Druschel, and Bhattacharjee (2007), Krishnamurthy et al. (2008), and Kwak et al. (2010), have reported measurements of vari- ous major online social networks. In the work of Mislove et al. (2007), an array of graph-based measurements are pre- sented for multiple popular online social networks, includ- ing YouTube. They present a framework of measurements that we adopt here for ease of comparison. In their mea- surement methodology, a mix of API and HTML scraping techniques are used to obtain a sampled version of the social graph. However, as the authors themselves pointed out, their methodology is limited when trying to extrapolate observa- tions to the entire YouTube population. This work addresses this concern and compares our results where appropriate. In Krishnamurthy et al. (2008), the authors examine topologi- cal features of a sampled Twitter network as well as content uploaded from users. This work is similar to what we present for YouTube as we analyze measurements from two social graphs and the video corpus. Recently, Kwak et al. (2010) conducts one of the first full crawls of a major online social network by measuring the entire Twittersphere. The size and coverage of their dataset is comparable to what we present here. OSN Applications In terms of user classification, De Choudhury et al. (2010) proposes threshold networks with non-arbitrary thresholds for increased accuracy in both link prediction and user clas- sification. In this work, the idea of thresholding to prune real-world datasets is used to illustrate an interesting rela- tionship between explicit and implicit social relationships. Hong et al. (2011) leverage network characteristics to suc- cessfully predict popular messages and Bakshy et al. (2011) classify “influential” users according to re-tweet quantities. A key similarity between these works is their use of vari- ous topological metrics calculated from the social graph. In our work, such features are utilized as well in our classifica- tion application. On top of the explicit social graph, topology measures of an implicit social graph and aggregated user- level metrics from the video corpus are used as well. Table 1: Nodal feature descriptions Name Description user Encrypted user id sub.out Out degree on subscription graph sub.in In degree on subscription graph avg.pub.out Average out degree of users subscribed to avg.pub.in Average in degree of users subscribed to avg.sub.out Average out degree of subscribers avg.sub.in Average in degree of subscribers reciprocal # of reciprocal links on subscription graph sub.pagerank PageRank of the subscription graph com.in In degree on the comment graph com.out Out degree on the comment graph com.pagerank PageRank on the comment graph max.fav Max # of times any video is favourited med.fav Median # of times any video is favourited min.fav Min # of times any video is favourited max.views Max # of times any video is viewed med.views Median # of times any video is viewed min.views Min # of times any video is viewed max.coms Max # of comments any video received med.coms Median # of comments any video received min.coms Min # of comments any video received max.raters Max # of raters for any video med.raters Median # of raters for any video min.raters Min # of raters for any video max.avg.rating Max of average ratings for any video med.avg.rating Med of average ratings for any video min.avg.ratings Min of average ratings for any video main.cat Category that most videos are uploaded in uploads Number of videos posted Measuring All of YouTube As mentioned in the previous section, a multitude of work has sampled various major OSNs through online crawls and/or API usage. However, few measurement projects have captured whole social graphs without compromise. This work leverages the data and computing power available within Google to shed light on a major social platform. The data collection process mainly utilizes MapReduce (Dean and Ghemawat 2008) and Pregel (Malewicz et al. 2010), a large-scale proprietary graph computing frame- work, to leverage Google’s computing resources. Therefore, the runtime to capture entire datasets can be completed in tens of minutes, capturing and processing complete social graphs on the YouTube social network. We base our anal- yses of the YouTube social network on three main corpora of data: the explicit social graph depicting subscriptions, the implicit social graph depicting commenting activities, and aggregated metrics of user-uploaded content. These datasets were captured in August 2011. We removed axis labels on our plots to preserve data confidentiality. We compose a directed graph to represent the subscription relationships of registered YouTube users. Each node repre- sents one such user while a link points from a subscriber to the user subscribed-to. Therefore, this graph is composed of
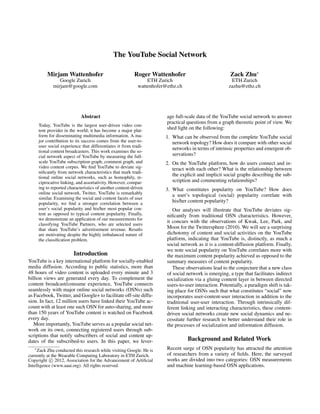
- 3. registered users who have subscribed to at least one user or received at least one subscription. Similarly, the comment graph is composed of users who have posted or received at least one comment. Again, links point from the commenter to the comment-receiving user. Both graphs contain nodes on the order of hundreds of millions and links on the order of billions, comparable to the measurement size of Kwak et al. (2010) for Twitter. The third corpus of data is an aggregation of YouTube video metrics to the uploader level. For each uploader µ ∈ N who has uploaded at least one video, we can construct a video vector vµ. Then, for each of our video-level met- rics (e.g. view count, number of video comments, etc.) we aggregate by taking the minimum, median, and maximum of vµ. For example, a specific user’s median average rating refers to the scalar mµ = median(v1 µ, v2 µ, ..., vn µ), where each vn denotes the average rating for the nth video that user µ has uploaded. Table 1 presents the user features accu- mulated from the three datasets. The naming convention in Table 1 will be referred to consistently from here on. Degree Distribution of Social Graphs Starting off with basic degree distribution analysis of both social graphs, Figure 1 plots the log-log complementary cu- mulative distribution function (CCDF). As done in most OSN studies, the degree distributions are typically gener- ated as log-log CCDF to better illustrate the tail behaviour on both ends. To interpret the plots, it can be understood, for an (x, y) pair, a fraction y of the population has a de- gree more than x. Noticeably, there is a sharp kink in the subscription out-degree curve at x = x∗ . This is an artifact of the YouTube subscription rule that limits the number of subscriptions for users who do not have a significant num- ber of subscribers themselves. In both graphs, there exists extremely popular users who have millions of subscribers and/or commenters. However, about half of the sampled population has one or zero subscriber and/or commenter. In the comment graph, the out-degree distribution also does not fit the power-law signature. Fitting the power-law distribu- tion (via maximum likelihood estimation) to the in-degree of the subscription graph and the comment graph, scaling exponents of 1.55 and 1.44 are found, respectively. These exponents differ from the majority of real-world social net- works, which have been measured between 2 and 3 (Kwak et al. 2010) as well as 1.99 (Mislove et al. 2007) for a sampled YouTube subscription graph. A Content-Driven OSN Traditionally, researchers have modelled social networks, online or offline, as undirected links between users. Intrin- sically different for YouTube, the de facto mode of linking is through directed subscription links. Furthermore, user in- teraction is largely through uploaded video content. For ex- ample, as opposed to interacting directly (e.g. wall posts, direct messages), much of the interaction on YouTube takes place in a video-centered manner, such as rating another’s video or leaving a video comment. Therefore, user inter- action becomes very much a user-content-user relationship Degree Distributions Degrees CCDF q q q q q q qq qq qqqqqqqqqqqqqqqqqqqqqqqqqqqqqqqqqqqqqqqqqqqqqqqqqqqqqqqqqqqqqqqqqqqqqqqqqqqqqqqqqqqqqqqqqqqqqqqqqqqqqqqqqqqqqqqqqqqqqqqqqqqqqqqqqqqqqqqqqqqqqqqqqqqqqqqqqqqqqqqqqqqqqqqqqqqqqqqqqqqqqqqqqqqqqqqqqqqqqqqqqqqqqqqqqqqqqqqqqqqqqqqqqqqqqqqqqqqqqqqqqqqqqqqqqqqqqqqqqqqqqqqqqqqqqqqqqqqqqqqqqqqqqqqqqqqqqqqqqqqqqqqqqqqqqqqqqqqqqqqqqqqqqqqqqqqqqqqqqqqqqqqqqqqqqqqqqqqqqqqqqqqqqqqqqqqqqqqqqqqqqqqqqqqqqqqqqqqqqqqqqqqqqqqqqqqqqqqqqqqqqqqqqqqqqqqqqqqqqqqqqqqqqqqqqqqqqqqqqqqqqqqqqqqqqqqqqqqqqqqqqqqqqqqqqqqqqqqqqqqqqqqqqqqqqqqqqqqqqqqqqqqqqqqqqqqqqqqqqqqqqqqqqqqqqqqqqqqqqqqqqqqqqqqqqqqqqqqqqqqqqqqqqqqqqqqqqqqqqqqqqqqqqqqqqqqqqqqqqqqqqqqqqqqqqqqqqqqqqqqqqqqqqqqqqqqqqqqqqqqqqqqqqqqqqqqqqqqqqqqqqqqqqqqqqqqqqqqqqqqqqqqqqqqqqqqqqqqqqqqqqqqqqqqqqqqqqqqqqqqqqqqqqqqqqqqqqqqqqqqqqqqqqqqqqqqqqqqqqqqqqqqqqqqqqqqqqqqqqqqqqqqqqqqqqqqqqqqqqqqqqqqqqqqqqqqqqqqqqqqqqqqqqqqqqqqqqqqqqqqqqqqqqqqqqqqqqqqqqqqqqqqqqqqqqqqqqqqqqqqqqqqqqqqqqqqqqqqqqqqqqqqqqqqqqqqqqqqqqqqqqqqqqqqqqqqqqqqqqqqqqqqqqqqqqqqqqqqqqqqqqqqqqqqqqqqqqqqqqqqqqqqqqqqqqqqqqqqqqqqqqqqqqqqqqqqqqqqqqqqqqqqqqqqqqqqqqqqqqqqqqqqqqqqqqqqqqqqqqqqqqqqqqqqqqqqqqqqqqqqqqqqqqqqqqqqqqqqqqqqqqqqqqqqqqqqqqqqqqqqqqqqqqqqqqqqqqqqqqqqqqqqqqqqqqqqqqqqqqqqqqqqqqqqqqqqqqqqqqqqqqqqqqqqqqqqqqqqqqqqqqqqqqqqqqqqqqqqqqqqqqqqqqqqqqqqqqqqqqqqqqqqqqqqqqqqqqqqqqqqqqqqqqqqqqqqqqqqqqqqqqqqqqqqqqqqqqqqqqqqqqqqqqqqqqqqqqqqqqqqqqqqqqqqqqqqqqqqqqqqqqqqqqqqqqqqqqqqqqqqqqqqqqqqqqqqqqqqqqqqqqqqqqqqqqqqqqqqqqqqqqqqqqqqqqqqqqqqqqqqqqqqqqqqqqqqqqqqqqqqqqqqqqqqqqqqqqqqqqqqqqqqqqqqqqqqqqqqqqqqqqqqqqqqqqqqqqqqqqqqqqqqqqqqqqqqqqqqqqqqqqqqqqqqqqqqqqqqqqqqqqqqqqqqqqqqqqqqqqqqqqqqqqqqqqqqqqqqqqqqqqqqqqqqqqqqqqqqqqqqqqqqqqqqqqqqqqqqqqqqqqqqqqqqqqqqqqqqqqqqqqqqqqqqqqqqqqqqqqqqqqqqqqqqqqqqqqqqqqqqqqqqqqqqqqqqqqqqqqqqqqqqqqqqqqqqqqqqqqqqqqqqqqqqqqqqqqqqqqqqqqqqqqqqqqqqqqqqqqqqqqqqqqqqqqqqqqqqqqqqqqqqqqqqqqqqqqqqqqqqqqqqqqqqqqqqqqqqqqqqqqqqqqqqqqqqqqqqqqqqqqqqqqqqqqqqqqqqqqqqqqqqqqqqqqqqqqqqqqqqqqqqqqqqqqqqqqqqqqqqqqqqqqqqqqqqqqqqqqqqqqqqqqqqqqqqqqqqqqqqqqqqqqqqqqqqqqqqqqqqqqqqqqqqqqqqqqqqqqqqqqqqqqqqqqqqqqqqqqqqqqqqqqqqqqqqqqqqqqqqqqqqqqqqqqqqqqqqqqqqqqqqqqqqqqqqqqqqqqqqqqqqqqqqqqqqqqqqqqqqqqqqqqqqqqqqqqqqqqqqqqqqqqqqqqqqqqqqqqqqqqqqqqqqqqqqqqqqqqqqqqqqqqqqqqqqqqqqqqqqqqqqqqqqqqqqqqqqqqqqqqqqqqqqqqqqqqqqqqqqqqqqqqqqqqqqqqqqqqqqqqqqqqqqqqqqqqqqqqqqqqqqqqqqqqqqqqqqqqqqqqqqqqqqqqqqqqqqqqqqqqqqqqqqqqqqqqqqqqqqqqqqqqqqqqqqqqqqqqqqqqqqqqqqqqqqqqqqqqqqqqqqqqqqqqqqqqqqqqqqqqqqqqqqqqqqqqqqqqqqqqqqqqqqqqqqqqqqqqqqqqqqqqqqqqqqqqqqqqqqqqqqqqqqqqqqqqqqqqqqqqqqqqqqqqqqqqqqqqqqqqqqqqqqqqqqqqqqqqqqqqqqqqqqqqqqqqqqqqqqqqqqqqqqqqqqqqqqqqqqqqqqqqqqqqqqqqqqqqqqqqqqqqqqqqqqqqqqqqqqqqqqqqqqqqqqqqqqqqqqqqqqqqqqqqqqqqqqqqqqqqqqqqqqqqqqqqqqqqqqqqqqqqqqqqqqqqqqqqqqqqqqqqqqqqqqqqqqqqqqqqqqqqqqqqqqqqqqqqqqqqqqqqqqqqqqqqqqqqqqqqqqqqqqqqqqqqqqqqqqqqqqqqqqqqqqqqqqqqqqqqqqqqqqqqqqqqqqqqqqqqqqqqqqqqqqqqqqqqqqqqqqqqqqqqqqqqqqqqqqqqqqqqqqqqqqqqqqqqqqqqqqqqqqqqqqqqqqqqqqqqqqqqqqqqqqqqqqqqqqqqqqqqqqqqqqqqqqqqqqqqqqqqqqqqqqqqqqqqqqqqqqqqqqqqqqqqqqqqqqqqqqqqqqqqqqqqqqqqqqqqqqqqqqqqqqqqqqqqqqqqqqqqqqqqqqqqqqqqqqqqqqqqqqqqqqqqqqqqqqqqqqqqqqqqqqqqqqqqqqqqqqqqqqqqqqqqqqqqqqqqqqqqqqqqqqqqqqqqqqqqqqqqqqqqqqqqqqqqqqqqqqqqqqqqqqqqqqqqqqqqqqqqqqqqqqqqqqqqqqqqqqqqqqqqqqqqqqqqqqqqqqqqqqqqqqqqqqqqqqqqqqqqqqqqqqqqqqqqqqqqqqqqqqqqqqqqqqqqqqqqqqqqqqqqqqqqqqqqqqqqqqqqqqqqqqqqqqqqqqqqqqqqqqqqqqqqqqqqqqqqqqqqqqqqqqqqqqqqqqqqqqqqqqqqqqqqqqqqqqqqqqqqqqqqqqqqqqqqqqqqqqqqqqqqqqqqqqqqqqqqqqqqqqqqqqqqqqqqqqqqqqqqqqqqqqqqqqqqqqqqqqqqqqqqqqqqqqqqqqqqqqqqqqqqqqqqqqqqqqqqqqqqqqqqqqqqqqqqqqqqqqqqqqqqqqqqqqqqqqqqqqqqqqqqqqqqqqqqqqqqqqqqqqqqqqqqqqqqqqqqqqqqqqqqqqqqqqqqqqqqqqqqqqqqqqqqqqqqqqqqqqqqqqqqqqqqqqqqqqqqqqqqqqqqqqqqqqqqqqqqqqqqqqqqqqqqqqqqqqqqqqqqqqqqqqqqqqqqqqqqqqqqqqqqqqqqqqqqqqqqqqqqqqqqqqqqqqqqqqqqqqqqqqqqqqqqqqqqqqqqqqqqqqqqqqqqqqqqqqqqqqqqqqqqqqqqqqqqqqqqqqqqqqqqqqqqqqqqqqqqqqqqqqqqqqqqqqqqqqqqqqqqqqqqqqqqqqqqqqqqqqqqqqqqqqqqqqqqqqqqqqqqqqqqq q q q q q q q q q q q In−degree Out−degree x* q q q qqqqqqqqqqqqqqqqqqqqqqqqqqqqqqqqqqqqqqqqqqqqqqqqqqqqqqqqqqqqqqqqqqqqqqqqqqqqqqqqqqqqqqqqqqqqqqqqqqqqqqqqqqqqqqqqqqqqqqqqqqqqqqqqqqqqqqqqqqqqqqqqqqqqqqqqqqqqqqqqqqqqqqqqqqqqqqqqqqqqqqqqqqqqqqqqqqqqqqqqqqqqqqqqqqqqqqqqqqqqqqqqqqqqqqqqqqqqqqqqqqqqqqqqqqqqqqqqqqqqqqqqqqqqqqqqqqqqqqqqqqqqqqqqqqqqqqqqqqqqqqqqqqqqqqqqqqqqqqqqqqqqqqqqqqqqqqqqqqqqqqqqqqqqqqqqqqqqqqqqqqqqqqqqqqqqqqqqqqqqqqqqqqqqqqqqqqqqqqqqqqqqqqqqqqqqqqqqqqqqqqqqqqqqqqqqqqqqqqqqqqqqqqqqqqqqqqqqqqqqqqqqqqqqqqqqqqqqqqqqqqqqqqqqqqqqqqqqqqqqqqqqqqqqqqqqqqqqqqqqqqqqqqqqqqqqqqqqqqqqqqqqqqqqqqqqqqqqqqqqqqqqqqqqqqqqqqqqqqqqqqqqqqqqqqqqqqqqqqqqqqqqqqqqqqqqqqqqqqqqqqqqqqqqqqqqqqqqqqqqqqqqqqqqqqqqqqqqqqqqqqqqqqqqqqqqqqqqqqqqqqqqqqqqqqqqqqqqqqqqqqqqqqqqqqqqqqqqqqqqqqqqqqqqqqqqqqqqqqqqqqqqqqqqqqqqqqqqqqqqqqqqqqqqqqqqqqqqqqqqqqqqqqqqqqqqqqqqqqqqqqqqqqqqqqqqqqqqqqqqqqqqqqqqqqqqqqqqqqqqqqqqqqqqqqqqqqqqqqqqqqqqqqqqqqqqqqqqqqqqqqqqqqqqqqqqqqqqqqqqqqqqqqqqqqqqqqqqqqqqqqqqqqqqqqqqqqqqqqqqqqqqqqqqqqqqqqqqqqqqqqqqqqqqqqqqqqqqqqqqqqqqqqqqqqqqqqqqqqqqqqqqqqqqqqqqqqqqqqqqqqqqqqqqqqqqqqqqqqqqqqqqqqqqqqqqqqqqqqqqqqqqqqqqqqqqqqqqqqqqqqqqqqqqqqqqqqqqqqqqqqqqqqqqqqqqqqqqqqqqqqqqqqqqqqqqqqqqqqqqqqqqqqqqqqqqqqqqqqqqqqqqqqqqqqqqqqqqqqqqqqqqqqqqqqqqqqqqqqqqqqqqqqqqqqqqqqqqqqqqqqqqqqqqqqqqqqqqqqqqqqqqqqqqqqqqqqqqqqqqqqqqqqqqqqqqqqqqqqqqqqqqqqqqqqqqqqqqqqqqqqqqqqqqqqqqqqqqqqqqqqqqqqqqqqqqqqqqqqqqqqqqqqqqqqqqqqqqqqqqqqqqqqqqqqqqqqqqqqqqqqqqqqqqqqqqqqqqqqqqqqqqqqqqqqqqqqqqqqqqqqqqqqqqqqqqqqqqqqqqqqqqqqqqqqqqqqqqqqqqqqqqqqqqqqqqqqqqqqqqqqqqqqqqqqqqqqqqqqqqqqqqqqqqqqqqqqqqqqqqqqqqqqqqqqqqqqqqqqqqqqqqqqqqqqqqqqqqqqqqqqqqqqqqqqqqqqqqqqqqqqqqqqqqqqqqqqqqqqqqqqqqqqqqqqqqqqqqqqqqqqqqqqqqqqqqqqqqqqqqqqqqqqqqqqqqqqqqqqqqqqqqqqqqqqqqqqqqqqqqqqqqqqqqqqqqqqqqqqqqqqqqqqqqqqqqqqqqqqqqqqqqqqqqqqqqqqqqqqqqqqqqqqqqqqqqqqqqqqqqqqqqqqqqqqqqqqqqqqqqqqqqqqqqqqqqqqqqqqqqqqqqqqqqqqqqqqqqqqqqqqqqqqqqqqqqqqqqqqqqqqqqqqqqqqqqqqqqqqqqqqqqqqqqqqqqqqqqqqqqqqqqqqqqqqqqqqqqqqqqqqqqqqqqqqqqqqqqqqqqqqqqqqqqqqqqqqqqqqqqqqqqqqqqqqqqqqqqqqqqqqqqqqqqqqqqqqqqqqqqqqqqqqqqqqqqqqqqqqqqqqqqqqqqqqqqqqqqqqqqqqqqqqqqqqqqqqqqqqqqqqqqqqqqqqqqqqqqqqqqqqqqqqqqqqqqqqqqqqqqqqqqqqqqqqqqqqqqqqqqqqqqqqqqqqqqqqqqqqqqqqqqqqqqqqqqqqqqqqqqqqqqqqqqqqqqqqqqqqqqqqqqqqqqqqqqqqqqqqqqqqqqqqqqqqqqqqqqqqqqqqqqqqqqqqqqqqqqqqqqqqqqqqqqqqqqqqqqqqqqqqqqqqqqqqqqqqqqqqqqqqqqqqqqqqqqqqqqqqqqqqqqqqqqqqqqqqqqqqqqqqqqqqqqqqqqqqqqqqqqqqqqqqqqqqqqqqqqqqqqqqqqqqqqqqqqqqqqqqqqqqqqqqqqqqqqqqqqqqqqqqqqqqqqqqqqqqqqqqqqqqqqqqqqqqqqqqqqqqqqqqqqqqqqqqqqqqqqqqqqqqqqqqqqqqqqqqqqqqqqqqqqqqqqqqqqqqqqqqqqqqqqqqqqqqqqqqqqqqqqqqqqqqqqqqqqqqqqqqqqqqqqqqqqqqqqqqqqqqqqqqqqqqqqqqqqqqqqqqqqqqqqqqqqqqqqqqqqqqqqqqqqqqqqqqqqqqqqqqqqqqqqqqqqqqqqqqqqqqqqqqqqqqqqqqqqqqqqqqqqqqqqqqqqqqqqqqqqqqqqqqqqqqqqqqqqqqqqqqqqqqqqqqqqqqqqqqqqqqqqqqqqqqqqqqqqqqqqqqqqqqqqqqqqqqqqqqqqqqqqqqqqqqqqqqqqqqqqqqqqqqqqqqqqqqqqqqqqqqqqqqqqqqqqqqqqqqqqqqqqqqqqqqqqqqqqqqqqqqqqqqqqqqqqqqqqqqqqqqqqqqqqqqqqqqqqqqqqqqqqqqqqqqqqqqqqqqqqqqqqqqqqqqqqqqqqqqqqqqqqqqqqqqqqqqqqqqqqqqqqqqqqqqqqqqqqqqqqqqqqqqqqqqqqqqqqqqqqqqqqqqqqqqqqqqqqqqqqqqqqqqqqqqqqqqqqqqqqqqqqqqqqqqqqqqqqqqqqqqqqqqqqqqqqqqqqqqqqqqqqqqqqqqqqqqqqqqqqqqqqqqqqqqqqqqqqqqqqqqqqqqqqqqqqqqqqqqqqqqqqqqqqqqqqqqqqqqqqqqqqqqqqqqqqqqqqqqqqqqqqqqqqqqqqqqqqqqqqqqqqqqqqqqqqqqqqqqqqqqqqqqqqqqqqqqqqqqqqqqqqqqqqqqqqqqqqqqqqqqqqqqqqqqqqqqqqqqqqqqqqqqqqqqqqqqqqqqqqqqqqqqqqqqqqqqqqqqqqqqqqqqqqqqqqqqqqqqqqqqqqqqqqqqqqqqqqqqqqqqqqqqqqqqqqqqqqqqqqqqqqqqqqqqqqqqqqqqqqqqqqqqqqqqqqqqqqqqqqqqqqqqqqqqqqqqqqqqqqqqqqqqqqqqqqqqqqqqqqqqqqqqqqqqqqqqqqqqqqqqqqqqqqqqqqqqqqqqqqqqqqqqqqqqqqqqqqqqqqqqqqqqqqqqqqqqqqqqqqqqqqqqqqqqqqqqqqqqqqqqqqqqqqqqqqqqqqqqqqqqqqqqqqqqqqqqqqqqqqqqqqqqqqqqqqqqqqqqqqqqqqqqqqqqqqqqqqqqqqqqqqqqqqqqqqqqqqqqqqqqqqqqqqqqqqqqqqqqqqqqqqqqqqqqqqqqqqqqqqqqqqqqqqqqqqqqqqqqqqqqqqqqqqqqqqqqqqqqqqqqqqqqqqqqqqqqqqqqqqqqqqqqqqqqqqqqqqqqqqqqqqqqqqqqqqqqqqqqqqqqqqqqqqqqqqqqqqqqqqqqqqqqqqqqqqqqqqqqqqqqqqqqqqqqqqqqqqqqqqqqqqqqqqqqqqqqqqqqqqqqqqqqqqqqqqqqqqqqqqqqqqqqqqqqqqqqqqqqqqqqqqqqqqqqqqqqqqqqqqqqqqqqqqqqqqqqqqqqqqqqqqqqqqqqqqqqqqqqqqqqqqqqqqqqqqqqqqqqqqqqqqqqqqqqqqqqqqqqqqqqqqqqqqqqqqqqqqqqqqqqqqqqqqqqqqqqqqqqqqqqqqqqqqqqqqqqqqqqqqqqqqqqqqqqqqqqqqqqqqqqqqqqqqqqqqqqqqqqqqqqqqqqqqqqqqqqqqqqqqqqqqqqqqqqqqqqqqqqqqqqqqqqqqqqqqqqqqqqqqqqqqqqqqqqqqqqqqqqqqqqqqqqqqqqqqqqqqqqqqqqqqqqqqqqqqqqqqqqqqqqqqqqqqqqqqqqqqqqqqqqqqqqqqqqqqqqqqqqqqqqqqqqqqqqqqqqqqqqqqqqqqqqqqqqqqqqqqqqqqqqqqqqqqqqqqqqqqqqqqqqqqqqqqqqqqqqqqqqqqqqqqqqqqqqqqqqqqqqqqqqqqqqqqqqqqqqqqqqqqqqqqqqqqqqqqqqqqqqqqqqqqqqqqqqqqqqqqqqqqqqqqqqqqqqqqqqqqqqqqqqqqqqqqqqqqqqqqqqqqqqqqqqqqqqqqqqqqqqqqqqqqqqqqqqqqqqqqqqqqqqqqqqqqqqqqqqqqqqqqqqqqqqqqqqqqqqqqqqqqqqqqqqqqqqqqqqqqqqqqqqqqqqqqqqqqqqqqqqqqqqqqqqqqqqqqqqqqqqqqqqqqqqqqqqqqqqqqqqqqqqqqqqqqqqqqqqqqqqqqqqqqqqqqqqqqqqqqqqqqqqqqqqqqqqqqqqqqqqqqqqqqqqqqqqqqqqqqqqqqqqqqqqqqqqqqqqqqqqqqqqqqqqqqqqqqqqqqqqqqqqqqqqqqqqqqqqqqqqqqqqqqqqqqqqqqqqqqqqqqqqqqqqqqqqqqqqqqqqqqqqqqqqqqqqqqqqqqqqqqqqqqqqqqqqqqqqqqqqqqqqqqqqqqqqqqqqqqqqqqqqqqqqqqqqqqqqqqqqqqqqqqqqqqqqqqqqqqqqqqqqqqqqqqqqqqqqqqqqqqqqqqqqqqqqqqqqqqqqqqqqqqqqqqqqqqqqqqqqqqqqqqqqqqqqqqqqqqqqqqqqqqqqqqqqqqqqqqqqqqqqqqqqqqqqqqqqqqqqqqqqqqqqqqqqqqqqqqqqqqqqqqqqqqqqqqqqqqqqqqqqqqqqqqqqqqqqqqqqqqqqqqqqqqqqqqqqqqqqqqqqqqqqqqqqqqqqqqqqqqqqqqqqqqqqqqqqqqqqqqqqqqqqqqqqqqqqqqqqqqqqqqqqqqqqqqqqqqqqqqqqqqqqqqqqqqqqqqqqqqqqqqqqqqqqqqqqqqqqqqqqqqqqqqqqqqqqqqqqqqqqqqqqqqqqqqqqqqqqqqqqqqqqqqqqqqqqqqqqqqqqqqqqqqqqqqqqqqqqqqqqqqqqqqqqqqqqqqqqqqqqqqqqqqqqqqqqqqqqqqqqqqqqqqqqqqqqqqqqqqqqqqqqqqqqqqqqqqqqqqqqqqqqqqqqqqqqqqqqqqqqqqqqqqqqqqqqqqqqqqqqqqqqqqqqqqqqqqqqqqqqqqqqqqqqqqqqqqqqqqqqqqqqqqqqqqqqqqqqqqqqqqqqqqqqqqqqqqqqqqqqqqqqqqqqqqqqqqqqqqqqqqqqqqqqqqqqqqqqqqqqqqqqqqqqqqqqqqqqqqqqqqqqqqqqqqqqqqqqqqqqqqqqqqqqqqqqqqqqqqqqqqqqqqqqqqqqqqqqqqqqqqqqqqqqqqqqqqqqqqqqqqqqqqqqqqqqqqqqqqqqqqqqqqqqqqqqqqqqqqqqqqqqqqqqqqqqqqqqqqqqqqqqqqqqqqqqqqqqqqqqqqqqqqqqqqqqqqqqqqqqqqqqqqqqqqqqqqqqqqqqqqqqqqqqqqqqqqqqqqqqqqqqqqqqqqqqqqqqqqqqqqqqqqqqqqqqqqqqqqqqqqqqqqqqqqqqqqqqqqqqqqqqqqqqqqqqqqqqqqqqqqqqqqqqqqqqqqqqqqqqqqqqqqqqqqqqqqqqqqqqqqqqqqqqqqqqqqqqqqqqqqqqqqqqqqqqqqqqqqqqqqqqqqqqqqqqqqqqqqqqqqqqqqqqqqqqqqqqqqqqqqqqqqqqqqqqqqqqqqqqqqqqqqqqqqqqqqqqqqqqqqqqqqqqqqqqqqqqqqqqqqqqqqqqqqqqqqqqqqqqqqqqqqqqqqqqqqqqqqqqqqqqqqqqqqqqqqqqqqqqqqqqqqqqqqqqqqqqqqqqqqqqqqqqqqqqqqqqqqqqqqqqqqqqqqqqqqqqqqqqqqqqqqqqqqqqqqqqqqqqqqqqqqqqqqqqqqqqqqqqqqqqqqqqqqqqqqqqqqqqqqqqqqqqqqqqqqqqqqqqqqqqqqqqqqqqqqqqqqqqqqqqqqqqqqqqqqqqqqqqqqqqqqqqqqqqqqqqqqqqqqqqqqqqqqqqqqqqqqqqqqqqqqqqqqqqqqqqqqqqqqqqqqqqqqqqqqqqqqqqqqqqqqqqqqqqqqqqqqqqqqqqqqqqqqqqqqqqqqqqqqqqqqqqqqqqqqqqqqqqqqqqqqqqqqqqqqqqqqqqqqqqqqqqqqqqqqqqqqqqqqqqqqqqqqqqqqqqqqqqqqqqqqqqqqqqqqqqqqqqqqqqqqqqqqqqqqqqqqqqqqqqqqqqqqqqqqqqqqqqqqqqqqqqqqqqqqqqqqqqqqqqqqqqqqqqqqqqqqqqqqqqqqqqqqqqqqqqqqqqqqqqqqqqqqqqqqqqqqqqqqqqqqqqqqqqqqqqqqqqqqqqqqqqqqqqqqqqqqqqqqqqqqqqqqqqqqqqqqqqqqqqqqqqqqqqqqqqqqqqqqqqqqqqqqqqqqqqqqqqqqqqqqqqqqqqqqqqqqqqqqqqqqqqqqqqqqqqqqqqqqqqqqqqqqqqqqqqqqqqqqqqqqqqqqqqqqqqqqqqqqqqqqqqqqqqqqqqqqqqqqqqqqqqqqqqqqqqqqqqqqqqqqqqqqqqqqqqqqqqqqqqqqqqqqqqqqqqqqqqqqqqqqqqqqqqqqqqqqqqqqqqqqqqqqqqqqqqqqqqqqqqqqqqqqqqqqqqqqqqqqqqqqqqqqqqqqqqqqqqqqqqqqqqqqqqqqqqqqqqqqqqqqqqqqqqqqqqqqqqqqqqqqqqqqqqqqqqqqqqqqqqqqqqqqqqqqqqqqqqqqqqqqqqqqqqqqqqqqqqqqqqqqqqqqqqqqqqqqqqqqqqqqqqqqqqqqqqqqqqqqqqqqqqqqqqqqqqqqqqqqqqqqqqqqqqqqqqqqqqqqqqqqqqqqqqqqqqqqqqqqqqqqqqqqqqqqqqqqqqqqqqqqqqqqqqqqqqqqqqqqqqqqqqqqqqqqqqqqqqqqqqqqqqqqqqqqqqqqqqqqqqqqqqqqqqqqqqqqqqqqqqqqqqqqqqqqqqqqqqqqqqqqqqqqqqqqqqqqqqqqqqqqqqqqqqqqqqqqqqqqqqqqqqqqqqqqqqqqqqqqqqqqqqqqqqqqqqqqqqqqqqqqqqqqqqqqqqqqqqqqqqqqqqqqqqqqqqqqqqqqqqqqqqqqqqqqqqqqqqqqqqqqqqqqqqqqqqqqqqqqqqqqqqqqqqqqqqqqqqqqqqqqqqqqqqqqqqqqqqqqqqqqqqqqqqqqqqqqqqqqqqqqqqqqqqqqqqqqqqqqqqqqqqqqqqqqqqqqqqqqqqqqqqqqqqqqqqqqqqqqqqqqqqqqqqqqqqqqqqqqqqqqqqqqqqqqqqqqqqqqqqqqqqqqqqqqqqqqqqqqqqqqqqqqqqqqqqqqqqqqqqqqqqqqqqqqqqqqqqqqqqqqqqqqqqqqqqqqqqqqqqqqqqqqqqqqqqqqqqqqqqqqqqqqqqqqqqqqqqqqqqqqqqqqqqqqqqqqqqqqqqqqqqqqqqqqqqqqqqqqqqqqqqqqqqqqqqqqqqqqqqqqqqqqqqqqqqqqqqqqqqqqqqqqqqqqqqqqqqqqqqqqqqqqqqqqqqqqqqqqqqqqqqqqqqqqqqqqqqqqqqqqqqqqqqqqqqqqqqqqqqqqqqqqqqqqqqqqqqqqqqqqqqqqqqqqqqqqqqqqqqqqqqqqqqqqqqqqqqqqqqqqqqqqqqqqqqqqqqqqqqqqqqqqqqqqqqqqqqqqqqqqqqqqqqqqqqqqqqqqqqqqqqqqqqqqqqqqqqqqqqqqqqqqqqqqqqqqqqqqqqqqqqqqqqqqqqqqqqqqqqqqqqqqqqqqqqqqqqqqqqqqqqqqqqqqqqqqqqqqqqqqqqqqqqqqqqqqqqqqqqqqqqqqqqqqqqqqqqqqqqqqqqqqqqqqqqqqqqqqqqqqqqqqqqqqqqqqqqqqqqqqqqqqqqqqqqqqqqqqqqqqqqqqqqqqqqqqqqqqqqqqqqqqqqqqqqqqqqqqqqqqqqqqqqqqqqqqqqqqqqqqqqqqqqqqqqqqqqqqqqqqqqqqqqqqqqqqqqqqqqqqqqqqqqqqqqqqqqqqqqqqqqqqqqqqqqqqqqqqqqqqqqqqqqqqqqqqqqqqqqqqqqqqqqqqqqqqqqqqqqqqqqqqqqqqqqqqqqqqqqqqqqqqqqqqqqqqqqqqqqqqqqqqqqqqqqqqqqqqqqqqqqqqqqqqqqqqqqqqqqqqqqqqqqqqqqqqqqqqqqqqqqqqqqqqqqqqqqqqqqqqqqqqqqqqqqqqqqqqqqqqqqqqqqqqqqqqqqqqqqqqqqqqqqqqqqqqqqqqqqqqqqqqqqqqqqqqqqqqqqqqqqqqqqqqqqqqqqqqqqqqqqqqqqqqqqqqqqqqqqqqqqqqqqqqqqqqqqqqqqqqqqqqqqqqqqqqqqqqqqqqqqqqqqqqqqqqqqqqqqqqqqqqqqqqqqqqqqqqqqqqqqqqqqqqqqqqqqqqqqqqqqqqqqqqqqqqqqqqqqqqqqqqqqqqqqqqqqqqqqqqqqqqqqqqqqqqqqqqqqqqqqqqqqqqqqqqqqqqqqqqqqqqqqqqqqqqqqqqqqqqqqqqqqqqqqqqqqqqqqqqqqqqqqqqqqqqqqqqqqqqqqqqqqqqqqqqqqqqqqqqqqqqqqqqqqqqqqqqqqqqqqqqqqqqqqqqqqqqqqqqqqqqqqqqqqqqqqqqqqqqqqqqqqqqqqqqqqqqqqqqqqqqqqqqqqqqqqqqqqqqqqqqqqqqqqqqqqqqqqqqqqqqqqqqqqqqqqqqqqqqqqqqqqqqqqqqqqqqqqqqqqqqqqqqqqqqqqqqqqqqqqqqqqqqqqqqqqqqqqqqqqqqqqqqqqqqqqqqqqqqqqqqqqqqqqqqqqqqqqqqqqqqqqqqqqqqqqqqqqqqqqqqqqqqqqqqqqqqqqqqqqqqqqqqqqqqqqqqqqqqqqqqqqqqqqqqqqqqqqqqqqqqqqqqqqqqqqqqqqqqqqqqqqqqqqqqqqqqqqqqqqqqqqqqqqqqqqqqqqqqqqqqqqqqqqqqqqqqqqqqqqqqqqqqqqqqqqqqqqqqqqqqqqqqqqqqqqqqqqqqqqqqqqqqqqqqqqqqqqqqqqqqqqqqqqqqqqqqqqqqqqqqqqqqqqqqqqqqqqqqqqqqqqqqqqqqqqqqqqqqqqqqqqqqqqqqqqqqqqqqqqqqqqqqqqqqqqqqqqqqqqqqqqqqqqqqqqqqqqqqqqqqqqqqqqqqqqqqqqqqqqqqqqqqqqqqqqqqqqqqqqqqqqqqqqqqqqqqqqqqqqqqqqqqqqqqqqqqqqqqqqqqqqqqqqqqqqqqqqqqqqqqqqqqqqqqqqqqqqqqqqqqqqqqqqqqqqqqqqqqqqqqqqqqqqqqqqqqqqqqqqqqqqqqqqqqqqqqqqqqqqqqqqqqqqqqqqqqqqqqqqqqqqqqqqqqqqqqqqqqqqqqqqqqqqqqqqqqqqqqqqqqqqqqqqqqqqqqqqqqqqqqqqqqqqqqqqqqqqqqqqqqqqqqqqqqqqqqqqqqqqqqqqqqqqqqqqqqqqqqqqqqqqqqqqqqqqqqqqqqqqqqqqqqqqqqqqqqqqqqqqqqqqqqqqqqqqqqqqqqqqqqqqqqqqqqqqqqqqqqqqqqqqqqqqqqqqqqqqqqqqqqqqqqqqqqqqqqqqqqqqqqqqqqqqqqqqqqqqqqqqqqqqqqqqqqqqqqqqqqqqqqqqqqqqqqqqqqqqqqqqqqqqqqqqqqqqqqqqqqqqqqqqqqqqqqqqqqqqqqqqqqqqqqqqqqqqqqqqqqqqqqqqqqqqqqqqqqqqqqqqqqqqqqqqqqqqqqqqqqqqqqqqqqqqqqqqqqqqqqqqqqqqqqqqqqqqqqqqqqqqqqqqqqqqqqqqqqqqqqqqqqqqqqqqqqqqqqqqqqqqqqqqqqqqqqqqqqqqqqqqqqqqqqqqqqqqqqqqqqqqqqqqqqqqqqqqqqqqqqqqqqqqqqqqqqqqqqqqqqqqqqqqqqqqqqqqqqqqqqqqqqqqqqqqqqqqqqqqqqqqqqqqqqqqqqqqqqqqqqqqqqqqqqqqqqqqqqqqqqqqqqqqqqqqqqqqqqqqqqqqqqqqqqqqqqqqqqqqqqqqqqqqqqqqqqqqqqqqqqqqqqqqqqqqqqqqqqqqqqqqqqqqqqqqqqqqqqqqqqqqqqqqqqqqqqqqqqqqqqqqqqqqqqqqqqqqqqqqqqqqqqqqqqqqqqqqqqqqqqqqqqqqqqqqqqqqqqqqqqqqqqqqqqqqqqqqqqqqqqqqqqqqqqqqqqqqqqqqqqqqqqqqqqqqqqqqqqqqqqqqqqqqqqqqqqqqqqqqqqqqqqqqqqqqqqqqqqqqqqqqqqqqqqqqqqqqqqqqqqqqqqqqqqqqqqqqqqqqqqqqqqqqqqqqqqqqqqqqqqqqqqqqqqqqqqqqqqqqqqqqqqqqqqqqqqqqqqqqqqqqqqqqqqqqqqqqqqqqqqqqqqqqqqqqqqqqqqqqqqqqqqqqqqqqqqqqqqqqqqqqqqqqqqqqqqqqqqqqqqqqqqqqqqqqqqqqqqqqqqqqqqqqqqqqqqqqqqqqqqqqqqqqqqqqqqqqqqqqqqqqqqqqqqqqqqqqqqqqqqqqqqqqqqqqqqqqqqqqqqqqqqqqqqqqqqqqqqqqqqqqqqqqqqqqqqqqqqqqqqqqqqqqqqqqqqqqqqqqqqqqqqqqqqqqqqqqqqqqqqqqqqqqqqqqqqqqqqqqqqqqqqqqqqqqqqqqqqqqqqqqqqqqqqqqqqqqqqqqqqqqqqqqqqqqqqqqqqqqqqqqqqqqqqqqqqqqqqqqqqqqqqqqqqqqqqqqqqqqqqqqqqqqqqqqqqqqqqqqqqqqqqqqqqqqqqqqqqqqqqqqqqqqqqqqqqqqqqqqqqqqqqqqqqqqqqqqqqqqqqqqqqqqqqqqqqqqqqqqqqqqqqqqqqqqqqqqqqqqqqqqqqqqqqqqqqqqqqqqqqqqqqqqqqqqqqqqqqqqqqqqqqqqqqqqqqqqqqqqqqqqqqqqqqqqqqqqqqqqqqqqqqqqqqqqqqqqqqqqqqqqqqqqqqqqqqqqqqqqqqqqqqqqqqqqqqqqqqqqqqqqqqqqqqqqqqqqqqqqqqqqqqqqqqqqqqqqqqqqqqqqqqqqqqqqqqqqqqqqqqqqqqqqqqqqqqqqqqqqqqqqqqqqqqqqqqqqqqqqqqqqqqqqqqqqqqqqqqqqqqqqqqqqqqqqqqqqqqqqqqqqqqqqqqqqqqqqqqqqqqqqqqqqqqqqqqqqqqqqqqqqqqqqqqqqqqqqqqqqqqqqqqqqqqqqqqqqqqqqqqqqqqqqqqqqqqqqqqqqqqqqqqqqqqqqqqqqqqqqqqqqqqqqqqqqqqqqqqqqqqqqqqqqqqqqqqqqqqqqqqqqqqqqqqqqqqqqqqqqqqqqqqqqqqqqqqqqqqqqqqqqqqqqqqqqqqqqqqqqqqqqqqqqqqqqqqq q q q q q q q Comment Graph Degree Distributions Degrees CCDF q In−degree Out−degree Figure 1: Degree distribution of subscription graph (top) and comment graph (bottom) plotted on log-log scales. where users interact with each other through a gluing layer of uploaded content. These two inherent characteristics of a content-driven OSN, such as YouTube, may explain why significant differences exist from traditional OSNs. In our measurement, we find the YouTube subscription graph deviates in three aspects that mark traditional OSNs: assortative linking, user homophily, and reciprocity. In addi- tion, contrary to traditional OSN studies that have illustrated social interactions as a strong signal for social links (Xiang, Neville, and Rogati 2010; Kahanda and Neville 2009), we note a surprising dichotomy of commenting activities and subscription links on the YouTube platform. Assortativity, Reciprocity, and Homophily In Figure 2, the assortative linking property can be examined for the sub- scription graph. We log-bin user in-degrees on the x-axis and plot the distribution of average publisher (users receiv- ing the subscription) in-degrees on the y-axis in the form of a box-plot. It is clear that the median of bins across most in-degrees hold steady as users consistently subscribe to those with much more popularity (via in-degree) than that of
- 4. Who I Subscribe To (All Users) In−Degree AveragePublisherIn−Degree qqqqqqqqqqqqqqqqqqqqqqqqqqqqqqqqqqqqqqqqqqqqqqqqqqqqqqqqqqqqqqqqqqqqqqqqqqqqqqqqqqqqqqqqqqqqqqqqqqqqqqqqqqqqqqqqqqqqqqqq q q q qqq q q q q qq q qq q qq qq q qqqq qq q q qq q q q q q q q q q q q q q q q q qqq qqqqqq qqq qq qq q q q q q q q qqqq qq q qq qqq q q qq q qq qqqq q q q qq qq q qqqqqq q qqq q q qqq q qq qqq q q q q qq qqq q q q q qqq qqqq q qq q qq q qq q q q q q qq q q qqqq q qqqqqq q q qq q qqq q qqq qq q q qqq qqq qq q qqq qq q q qqq q q qqq q qq q q q q q q q q q qqqq qq qqqq q qq q q qqq q q q q qq q qqqqq qq qqq q qqqqqq q qq qqqq qq q qq q q qq q qqq qqq qqq qqqq qq q q qqq q q q qq qqqqq qq qq q qqqqqqqq qqqq qq qq qq qqq q q q q q qq q q q q qq qqqq q q q q q q q qqq qq q q q q q q q qq qq q q q q q q qq q q qqq qqqqqq q q q q qq qq qqqq q q q qqq q qq q q q q q q q q q qq q q qq q q q q q q q q qqq qq qq q q qq q qq qq q q q q qqq q q qqq qq q qqq q q q q q q qqq q qqqq qq q q q q q qq q q q q q q q q q qq q qq q q q qqqq q q q q q q q q q q q q q q q qq qq q q q q qq qq qqq qq q q q q q q q q q qq qq q q q qq qqq q q q q q qq q q q q qq q q q q q qqqq q q q q q q q q q q qq qq q qqq q q qqq q q q q q qqqq q q q q q q q q q qq q q qq q qq q q q q q q q qq q qq q qq q q q q q qq q qq q q q qq q q qq qq q q q q q q qq qq qq q q qqq q q qq q qq q q q qq q qq q q qq qq q qq q q q qq q q q q qq q q q q qq qq q q q q q q q qq q q qq qq q q q q q q q q q q q q qq q q qq qq qqq q q qq qqqq q q q q q q q q qq q q q q q q q q q q q q q q q qq q q q q qq q q q qq qqq q q qq qq q q q q q q q q q q q q qq qqqqq q qq q q q q q q q qq q q q qqq qq q qq qq q q q q q q qqq qqq q q q qq q q q q q q q q qq q q q q q q q qq q q q q q qq q qq q q qq q q q q q q q q q qq q q q q q q q q qq q q q q q q q q q q q q q q q q q qq q q q q q q qq q q qq q q q q q q q q q q q q q q q q q q q qq q q q q q qq q q q q q q q q q qq q q q q q q q q q q qq qq q q qq q q q q q q qqqq q q q qq q q qq q q q q q q q q q q q qq qqq qq q q q q q q qq q q q q q q q q q q q q qq q q q q q q q q q q q qq q qq q q q q q qq q q q qqq qq q q q q qqq q q qq q q qq q q q q qq q qq q qq q q q q q q q q q q q qq q q q qq q q q q q q qq q qq qq q q qq q q q q qqq q q q q q q q q qq q qqq q q q q q q q q q q q q q q q q q q q q q q q q q q q q q q q q qqq q q q q q q q q q q q q q q qq q q q q qq q q q qq q q q q q qqq q q q qqq q q q q q q q q q qq q q q q q q q qq q q q qq qq q q q q qq q q q q q q q q q q q qq q qq qq q q q q q q q q q q q q q q q q qq q qq q q qq q q q q q q q qq q q q q q q q q q q qq q q q q q q qq q qqq q q q qq q q q qq q q q q q q q q q q q q q qqq qqqq q qqq q q qq q q q q q q q q q q q q q qqq q q q q qq q qqq qq q q qq q q q q q qqq q q q q q q q qq qq q qq q q q q q q q q q q q q q q q q q q q q q q q q qq q q qq q qq qq q q q q q q qq q q q q q q q q q qq q q q q q q q q qq q q q q qq q q q q q q q q q q qq q qq q q q qq q q q q q q q q q q qq q q q qq q q q q q q q qq q q q qq q q q qq q q q q q q q q q q q q q q q q q q q q q q q q q q q q q q q q q q qq qq q q q q q q qq q q qq qq q q q q q q q q q q q q q q q q q q q q q q q q q q q qq q qqqq q q q q q q q q q q q q q q q q q q q q q q q q q q q q q q q q q q q q q q q q q q q q q q q q q q q q q q q q q q q qq q qqqq q q q q q q q q qqq qqq q q q q qq q q qq qq q q q q q q q q q q q q q q q q q q q q q q q q q q q q q q q q q q q q q qq q q q q q q q q q q q q q q q q q qq q q q q q qq q q qq q q qq q q q q qq q q q q q q q q q qq q q q q q q q q q q q q q qq q q q q q q q q q q q qq q q q q q q qq q q q q q q q q q q q q q q q q q q q q q q q q q qq q q q q q q q q q q q q qq q q q q q q q q q q q q q q q q q q q q q qq q q q q q q qq qq q qq q q q q q q q q q q q qq q q q q q q q q q q q q q q q q q q q q q q q q q q q q q q q q q q q q q q q q q q q q q q q q q q q qq q q q q q q q q q q q q q q q q q q q qq q q q q qq q q q q qq q qq qq q q q q q q q q q q q q q q q q q qq q qq qq q q q q qq q q q q q q q q q q q q q q q q q q q q q q q q q q q q q q q q q q q q q q q q q q qq q q q q q q q q q q q q q q q q q q q q q q q q q q q q q q q q q q q q q q q q qq q q q q q q qq q q q q q q qq q q q q q q q q q q q q q q q q q q q q q q q q q q q q q q q q q q q q q q q q q qqq q q q q q q q q q q qq q q q q q q q q q q q q q q q q q q q q q q q q q q q q q q q q q qq q q q qq q q q q q q q q q q q q q q q q q q q q q q q q q q q q q q q q q q q q q q q q q q q q q q q q q qq q q qq qq q q qqq q q q qq q q q q qq q q q q q q q q q q q q q q q q q q q q q q q q q q q q q q q q q q q q q q q q q q q q q q q q q q q q q q q q q q q q q q Who I Subscribe To (Reciprocal Users) In−Degree AveragePublisherIn−Degree q q q q q q q q q q q q q q q q q q q q q q q q q q q q q q q q q q q qq q q q q q q q q q q q q q q qq q q q q q q q qq qq q q q q q q q q q q q q q q q q q q q q q q q q q q q q q q qq q q q q q q q q q q q q q q q q q qq q q qq q q q q q q q q q q q q q q q q q q q q q q q q q q q q q q q q q q qq q q q q q q q q q q q q q q q q q q q q q qq q q q q q qq q q q q q q q q q q q q q q q q q q q q q q q q q q q q q q q q qq q qq q q q q q q q q q q q q q q q q q q qq q qq q q q q q q q qq q q q q q qq q q q q q q q q q q q q q q q q q q q q q q q q q q q q q q q qq q q q q q q q q qq qq q q q q q q q q q q q q q q q q q q q q q q q q q q q q q q q q q q q q q q q q q q q q q q q q q q q q q q q q qq qq q q q q q q q q q q q q q q q q q q q q q q q q q q q q q q q q q q q q q q q q q q q q q q qq q q q q q q q q q q q q q q q q q q q qq q q q q qq q q q q q q q q q q q q q q q q q qq q q q q q q q q q q q q q q q q q q q q q q q q q q qq q q q q q q q q q q q q q q q q q q q q q q q q q qq q q q q q q q q q qq q qq q q q q q q q q q q q q q q q q q q q q q q q q q q q q q q q q q q q q q q q q q q q q q q qq q q q q q q q q q q q q q qq qq q q q q q q q q q q q q q q qq q q q q q q q q qq q q q q q q q q q q q q q q q q q q q qq q q q q q q q q q q q q q qq q q q q qq q q q q q q q q q q qq q q q q q q q q q q q q q q q q q qq qq q qq qq q q q q q q q q q q q q q q q q q q qq q q qqq q q q q q q q q q q q q q q q qq q q q q q q q q q q q q q q q q q q q q q q q q q qq q q q q q q q q q q q q q q q q q q q qq q q q q q q q q q q q q q q q q q q q q q q q q q q q qq q q q q q q q q q q q q q qq q q q q q q q q q q q q q q q q q q q q q q q q qq q q q q q q q q q q q q q q q q q q q q qq q q q q q q q q q q q q q qq q qq q q q q q q q q q qq q q q q q q q q q q q q q q q q q q q q q q q q q q q q q q q q qq q q q qq qq q q q q q qq q q q q q qq q q q q q q qq q q q q q q q q q q q q q q qq qq q q q q q q q q q q q q q q q q q q q q q q q q q q q q q q q q q q q q q q q q q q q q q q q q q q q q q q qq q q q qq q q q q q q q q q q q q q q q q q qq q qq q q q q q q q q q q q q q q q q q qq q q q q q q q q q q q q q q q q q q q q q q q qq q q q q q q q q qq q q q qq q q q q q q q q q q q q qq q q q q qq q q q q qq qqq q q q q q q q q q q q q q q q q q q q q q q q q q q q q q q qq qq q q q q q q q q q q q q q q q q q q q q q qq q q q q q q q q q q q q q q q q q q q q q q q q q q q q q q q q q q q q q q q q q q q q q q q q q q q q qq q q q q q q q q q q q q q q q q q q q q q q q q q q q qq q q q q q qq q q q q q q q qq q q q q qq q q q qq q q q q q q q q q q q q q q q q q q q q q q q q q q q q q q q q q q q q q q q q q q q q q q q q q q q q q q q q q q q q q q q q q q q q q q q q qq q q q q q q q q q q q q q q q qq q q q q q q q q q q q q q q q q q qq q q q q q q q qq q q q q q q q q q q q q q q q q q q q q q q q q q qq qq q q q q q q q q q q q q q q q q q q q q q q q q q q q q q q q q q q q q q q q q qq q q q q q q q q q q q q q q q q q qq q q q q q q q q q q q q q q q q q q q q q q q q q q q q q qqq q q q q q q q q q q q q q q q q q qq q q q q q q q q q q q q q q q q qq q q q q q q q q q q q q q q q q q q q q q q q q q q qq q q q q q q q q q q q qq q q q q q q q qq q q q q q q q q q q q q q q q q q q q q q q q q qq q q q q q q q q q q q q q q q q q q q q qq q q q q q q q qq q q q q q q q q q qq q q q q q q qq q q q q q q q q q q q q q q q q q qq q q q q q q q q q q q q q q q q q q q q q q q q q q q q q q q q q q q q q q q q q q q q q q q q q q q q q q q q q q q q q q q q q q q q q q q q q q q q q q q q q q q q q q q q q q q q q q q q q q q q q q q q q q q q q q q q q q q q q q q q q q q q q q qq q q q q q q q q q q q q q q q q q q q q q q q q q q q q q q q q q qq q q q q q q q q q q q q q q q q q qq q q q q q q q q qq q q q q q q q q q q q q q q q q q q q q q q q q q q q q q q q q q q q q q q q q q q q q q q q q q q q q q qq q q q q q q q q q q q q q qq q q q q q q q q q q q q q q q q q q q q q q q q q q qq q q q q q q q q q q q q q q qq q q q q q q q q q q q q q q q q q q q q q q q q q q q qq q q q q q q q q q q q q q q qq q q q q q q q q q q q q q q q q q q q q q q q q q q q q q q q q q q q q q q q q q q q q qq q q q q q q q q q q q q q q q q qq q q q q qq q q q q qq q q q q q q q q q q q q q q q q q q q q q q q q q q q q q q q q q q qq q q q q q q q q q q q q q q q q q q q q q q q q q q q q q q q q q q q q q q q q q q qq q q q q q q q q q q q q q q q qq q q q q q q q q q q q q q q q q q q q q q q q q q q q q q q q q q q q q q q q q q q q q q q q q q q q q q qqq q q q q q q q q q q q q q q q q q q q q q q q q q q q qq q q q q q q q q q q q q q q q q q q q qq q q q q q q q q q q q q q q q q q q q q q q q q q q q q q q q q q q q qq qq q q q q q q q q q q q q q q q q q q q q q q q q q q q q q qq q q q q q q q q q qq q q q q q q q q qq q qq q q q q q q q q q q q q qq q q q q q q q q q q q q q q q q q qq q q q q q q q q q q q q q q q qq q q q q q q q q q q q q q q q q q q q q q q q q q q q q q q q q qq q q q q q q q q q q q q q q q q q q q q q q q q q q q q q q q q q q q q q q q q q q q q q q q q q q q q q qq q q q q q q q q q q q q q qq q q q q q q q q q q q q q q q q q q q q q q q q q q q q q q q q q q q q q q q q q q q q q q q q q q q q q q q qq q q q q q q q q q q q q q q q q q q q q q qq q q q q q q q q q q q q q q q q q q qq q q q q q q q qq q q q q q q q q q q q q q q qq q q q q q q q q q q q q q q q q q q q q q q q q q q q q q q q q q q q q q q q q qq q q q q q q q q q q q q q q q q q q q q q qq q q q q q q q q q q q q q q q q q q qq q q q q q q q q q q q q q q q q q q qq q q q q qq q q q q q q q q q q q q q q q q q q q q q q q q q q q qq q q q q q q q q q q q q q q q q qq q q q q q q q qq q q q q q q q q qq q q q q q q q q q q q q q q q q q q q q q qq q q qq q q q q q q q q q q q q q q q q q q q q q q q q q q q q q q q q q q q q q q q qq q q q q q q q q q q q q q q q q q q q q q q q q q q q q q q q q q q q q q q q q q q q q q q q q q q q q q q q q q q q q q q q q q q q q q q q q qq q q q q q q q q q q q q q q q q q q q q q q q q q q q q q q q q q q qq q q q q q q q q q q q q qq q q qq q q q q q q q q q q q q q q q q q q q q q q q q qq q q qq q q q q q qq q q q q q q q q q q q q q q q q q q q q q q q q q q q q q q q q q q q q q q q q q qq q q q q q q q q q q q qq q q q q q q q q q q q q q q q q q q q q q q qq q q q q q q q q q q qq q q q qq q q q q q q q q q q q q q q q q q q q q q q q q q q q q qq q q q q q q q q q q q q q q q q q q q q q q q q q q q q q q q q q q q q q q q q q q q q q q q q q q q q q q q q q q q q q q q q q q q q q q q q q q q q q q q q q q q q q q q q q q q q q q q q qq qq q q q q q q q q q q q q q q q q q q q qq q q q q q q q q q q q q q q q q q q q qq q q q q q q q q q q q q q q q q qq q q q q q qq q q q q q q q q q q q q q q q q q q q q q q q q q q q q q q q q q q q q q q q q q q q q q q q q q q q q q q q q q q q q q q q q q q qq q q q qq q q qq q q q q q q q q q q q q qq q q q q q q q q q q q q q q q q q q q q q q q q q q q q q q q q q q q q q q q q q q q q q q q q q q q q q q q q q q q q q q q q q q q q qq q q q q q q q q q q q q q q q q q q q q q q q q q q q q q q q qq q q q q q q q q q q q q q q q q q q q q q q q q q q q q q q q q q q q q q q q qqq q q q q q q q q q q q q q q q q q q q q q q q q q q q q q q q q q q q q q q q q qq q q q q q q q q q q q q q q q qq q q q q q q q q q q q q q q q q q q q q q q q q q qq q q q q q q q q q q q q q q q q q q q q q q q q q q q q q q q q q q q qq q q q q q q q q q q q q qq q q q q q q q q q q q q q qq q q q q q q q q q q q q q q q q q q q q q q q q q q q q q q q q q q q q q q q q q q q q q q q q q q q q q q q q qq q q q q q q q q q q q q q q q qq q q q q q q q q q q q q q q qq q q q q q q q q q q q q q q q q q q q q q q q q q q q q q q q q q q q q q q q q q q q q q q q q q q q q q q q q q q q q q q q q q q q q q q q q q q q q q q q q q q q q q q q q q q qq q q q q q q q q q q q q q q q q q q q q q q q q q q q q q q q q q q q q q q q q q q q q q q q q q q q q q q qq q q q q q q q q q q q q q q q q q q q q q q q q q qq q q q q q q q q q q q q qq q q q q q q q q q q q q q q q q q q q q q q q q q q q q q q q q q q q q q q q q q q q q q q q q q q q q q q q q q q q q q q q q q q q q q q q q q q q q q q q q qq q q q q q q q q q q q q q q q q q q q q q q q qq q q q qq q q q q q q q q q q q q q q q q q q q q q q q q qq q q q q q q q q q q q q q q q q q q q q q q q q q q q qq q q q q q q q q q q q q q q q q q q q q q q q q q q q q q q q q q q q q q q q q q q q q qqq q q q q q q q q q q q q q q q q q q q q q q q q q q q q q q q q q q q q q q q q q q q q q q q q q q q q q qq q q q q q q qq q q q q q q q q q q q q q q q q q q q q q q q q q q q q q q q q q q q q q q q q q qq q q q q q q q q q q q q q q q q q q q q q q q q q q q q q q q qq q q q q q q q q qq q q q q q q q q q q q q q q q q q q q q q q q q q q q qq q q q q q q q q q q q q q q q q q q q q q q q q q q q q q q q q q q q q q qq q q q q q q q q q q q q q qq q q q q q q q q q q q q q q q q qq q q q q q q q q q q qq q q q q q q q q q q q q q q q qq q q q q q q q q q q q q q q q q q q q q q q q q q q q q q q q q qq q q q q q q q qq q q q q q q q q q q q q q q q q q q q q q q q q q q q q q q q q q q q q q q q q q q q q q qq q q q q q q q q q q q q q q q q q q q q q q q q q q q q q qq q q q qq qq q q q q q q qq q q q q q q q q q q q q q q q q q q q q q q q q q q q q q q q q q q q q q q q q qq q q q q q qqq q q q q q q q q q q q q q q q q q q q q q q q q q qq q q q qq q q q q q q q q q q q q q q qq q q q q q q q q q q q q q q q q q q q q q q q q q q q q q q q q q q q q q q q q q q q q q q q q q q q q q q q q q q q q q q q q q q q q q qq q q q q q q q q q q q q q qq q q q q q q q q q q q q q qq q q q q q qqq q q q q q q q q q q q q q q q q q q q q q q qq q q q q q q q q q q q q q q q q q q q q q q q q q q q q q q q q q q q q q q q q q qq q q q q q q q q q q q q q q q q q q qq q q q q q q q q qq q q q q q q q qq q q q q q q q q q q q q q q q q q q q q q q q q q q q q q q q q q q q q q q q q q q q q q q q q q q q q q q q q q q q q q q q q q q q q q q q q q q q q q q q q q q q q q q q q q q q q q q q q q q q q q q q q q q q q q q q q q q q q q q q q q q q q q q q q q q q q q q q q q q q q q q q q q q q q q q q qq q q q q q q q q q q q q q qqq q q q q q q q q q q q q q q q q q q q q q q q q q q q q q q q q q q q qq q q qq q q qq q q q q q q q q q q q q qq q q q q q q qq q q qqqq q q q q q q q q q q q q q q q q qq q q q q q q q q q q qq q q q q q q q q q q q q q q q q q q q q q q q q q q q qq q q q q q q q q qq q q q q q q q q q q q qq q q q q q q q q q q q q q q q q q q q q q q q q q q q q q q q q q q q q q q q q q q q q q q q q q q q q q q q q q q q qq q q q qq q q q q q q q q q q q q q q qq q q q q q qq q q q q q q q q q q q q q q q q q q q q q q q q q q q q qq q q q q q q q q q q q qqq q q q q q q q q q q q qq q q q q q q q q qq q q q q q q qq q q q q qq q q q q qq q q q q q q q q q q qq q q q q q q q q q q q q q q q qq q q q q q q q q q q q q q q q q q q q q q q qq q q q q q q qq q q q q q q q q q q q q q q q q q q q q q q q q q q q q q q q q q q q q q q q qq q q q q q q q q q q q q q qq q q q q q q q q q q q q q q q q q q q q q q q q q q q q q q q q q q q q qq q q q q q qq q q qq q q q q q qq q q q q q q q q q q q q q q q q q q q q q q q q q q q q q q q q q q q q q q q q q q q q q q q q q q q q q q q q q q q q q q q q q q q q q q q q q q q q q q q qqq q q q q q q q q q q q q q q q q q q q q q q q q q q q q q q qq q q q q q q q q q q q q q q q q q q q q q q q q q q q q q q q q q q q q q q q q q q q q q q q q q q q q q q q q q q q q q q q q q q q q q q q q q q q q q qq q q q q q q q qq q qq q q q q q q q q q q q q q q q q q q q q q q q q qq q q q qq q q q q q q q q q q q q q q q q q q q q q q q q q q q q q q q q q q q qq q q q q q q q q q q q q q q q q q q q q q q q qq q q q q q q q q q q q q q qqq q q q q q q q q q q q q q q q q q q q q q q q q q q q q q q q q q q q q q q q q q q q q q q q q q q q q q q q q q q q q q q q q q q q q q q q q q q q q q q q q q q q q q q q q q q q q q q q q q q q q q q q q q q q q q q q q q q q q q q q q q q q q qqq q q q q q q q q q qq q q q q q q qq q q q q q q q q q q q q q q q q q q q q q q q q q q q qq q q q q q q q q q q q q q q q q q q q q q q q q q q qq q q q q qq q q q q q q q q q q q q q q q q q qq q qq q q q q q q q q q q q qq q q q q q q q q q q q q q q q q q q q qq q q q q q q q q q q q q q q q q q q q q q q q q q q q q q q q q q q q q q q q q qq q q qq q q q q q q q q qq q q qq q q q q q q q q q q q q q q q q q q q q qq q q q q q q q q q q q q q q q q q q q q q q q q q q q q q q q q q q q q q q q q q q q q q q q q q q q q q q q q q q q q q q q q q q q q q q q q q q qq q q qq qq q q q q q q q q q q q q qq q q q q q q q q q q q qq q q q q q q q q q q q q q q qq q q q q q q q q q q q q q q q q q q qq q q q q q q q q q q q q q q q q q q q q q q q q q q q q q q q q q q q q q qq q q q q q q q q q qq q q q q q qq q q q q q q q q q q q q q q q q q q q q q q q q q q q q q q q qq q q q q q q q q q q q q q q q q q q q q q q q qq q q q q q q q q q q q q q q q q q q q q q q q q q qq q q q q qq q q qq q q q q q q q q q q q q q q q q q q q q q q q q q qqq q q q q q q q q qq q q q qq q q q q q q q q qq q q q q q q q q q qq q q q q q q q q q q q q q q q q q q q q q q qqq qq q q q qq q q q qqq q q q q q q q q q q q q q q q qq q q q qq q qq q q q q q q q qq q q q q q q q q q qq q q q q q q qq q q qq q q q q q q q q q q q q q qq q q q q q q q q q q q q q qq q qq qq q q q q q q q q q q q q q q q q q q q q qq q q qq q q q q q q q q q q qq q q q q qq q q q q q q q q q q q q q q q q q q q q q q qq q q q q q q qq qq q q q q q q q q q q q q q q q q q q q q q q q q q qq q q q q q q q q q q q q q q q q q q qq q q q q q q q q q q q q q q q q q q q q q q q q q q q q q q q q q qq q q q q qq q qq q q q q q q q q q q q q q q q q q q qq q q q q q q q q q q q q q q q q q q qq q q q q q q q q q q q q q q q q q q q q q q q q q q q q q q q q q qq q qq q q q q q q q q q q q q q q q q q q q q q q q qq q qq q q q q q q q q q q q q q q q q q q q q q q qq q q q q qq q q q qq q q q q q q q q q q q q q q q q q q q q q q q q q q q q q q q q q q q q q q qq q q q q q q q q q q q q q q q q q q qq q q q q qq q q q qq q qq q q q q q q q q q qq q q q q q q q q q q q q q q q q q q q q q q q q q q q q q q q q q q q qq q qqq q q q q q qq q q q q q q q qq q q q q q q q q q q q q q q q qqq q q q q q q q qq q q q q q qq qq q q q q q q q qqq q qq q q q q q q q q q q qq q q q q qq q q q q q q q q q q q q q q q q q q q q q q q q q q q q q q q q q q q q q q qq q q q q q qq q q q q q q q q q q q q q q q q q q q qq q q q q q q q q q q q q q q q q q q q q qq q q q q q q q q q q q q q q q q q q q q q qq q q q q q q q qq q q q q q q q q q q q q q q q q q q q q q q q q qq q q q q q q q q q q q q q qq q qq qq q qq q q q q qq q q q q qq qq q q q q q q q q q q q q q q q q q q q q qq q q q q q q q q qq q q q q qq q qq q q q q q q qq q q q q qq q q q q qq q q q q q q q q q q q q q q q q q q q q q q q q q q q q q q q q q q q q q qq q q q q q q q q qq qq q q q qq q q q q q q q q q qq q q qqq q q q q q q q q q q q q q q q q qq q q q q q q q q qq q q q q q q q qq q q q q q q q q q q q q qq q q q q q q q q q q q q q q q q q q q q q q q q q q q q q q qq q q qq q q q q q q q q q q q q q q q q qq q q q q q q q q q q q q q qqq q qq q q qq q q q q q q q q q q q q q q q q q q q q q qq q q q q q q q q qq q q q q q q q q q q q q q q q q q q q q q q q q q q q q qqq q q q qq q q q q q q qq q q q q qq q q q q q q qq q q q q q q q q q q q qq q q q q q q q q q q q qq q q q q q q q q q q q q q q q q q q q q q q q q q q q q q q q q q q q q q q q q q q q q q q q q q q q q qq q q q q q q q q q q q q q q q q q q q q q q q q q q qq q q q q q q qq q qq q q q q q q q q q q qq q qq q qq q q q q q q q q q q qqq q q q q q q q q q q qq q q q q q q q q q q qq q q q q q q q q q q q q q q q qq q q q q q q q q q qq q q q q q q q q qq q q q q q q q q q q q q q q q q q q q q q q q qq q q q q q q qq q q q q q q q q q q q q q q q q q qq q q qq q q q q q q q q q qq q qq q q q q q q qq q q q q q q q q q q qq q q q q q q q qq q q q q q q q q qq qq q q q qq q q q q q q q q q q q q q q q q q q q q qq q q q q q q q qq q q q q q q q q q q q q q qq q q q q q q q q q q q q qq q q q q q q qq q q q q qq qq q q q q q q q q q q q q q q q q q qq q q qq q q q q q q q q qq q q q q qq qq q q q q qq q q q q qq q q qq q q q q qq q q q q q q qq q q q q q q q q q qq qq q q q q q q qq q q q q q q q q q q q q q q q q qq q qq q q q qq q qq q q q qq q q q q q q q q q q q q q q q q q q q q q q q q q qq q q q q q qq q q q qqq q q q qq q q q qq q q q q q q q qq q qq q qq q q q q q q q q q q q q q q qq q q q q q qqq q q q q q q q q q q q q q q q q q q qq q q q q q q q q q q q q q q q q qq q qq q q q qqqq q q q q q q q q q q q q q qq q q q q q qq qq qq q q q q q q q q q q q q q q qqqq q q q q q q q q qq q q q qq q q q qq qq q q q q q q q q q q q q qq qq q qq q qq q q q q qq q q q q q qq q q q q qq q q q q q q q q q q qq q q q q q q q q q q q q q q q q q q qq q q q q q qq q qqqq q q q q q q q q q q q q qq q qqq q q q q qq q q q q q q q q q q q qq q q qqqq q q qqq q q q q q q q q q q q q q q qq q q qqq q qq q q q q qq q qqq q qqq q q q q q q q qq qq q q q q qqqqqqqqqqqqqqqq qqqqqqqq q q q q qq q qqqq q q q qqq q qqqq qq q qq q q qqq q q q qq q q q q q qq qqqq qq qqq q qq qqq q q qq q q q q q q q q q q q q q q q q q q q q qq q q q q q q q qq q qq q qq q qq q q q q q q qq q q q q q q qq q qq q q qq q q q qq q q q q q q q q q q q q qq qq q q q qq q q q q q q q q q q q q q q q q q q q q q q q q q q q q q q q q q q q q q q q q q q q q q q q qq q q q q q Figure 2: Who subscribes to whom (top) and Who sub- scribes to whom for reciprocal users (bottom). A significant difference in linking assortativity can be seen between the top and bottom plots. themselves. Although there are significant variances associ- ated with the bins, the median level consistently show that users on YouTube tend to subscribe to power-users with in- degrees orders of magnitude larger. Thus, assortative linking largely does not take place on the YouTube subscription net- work, as most of the population is contained in the lower in- degree bins per the power-law distribution shown previously. This measurement agrees with an earlier measurement study on a sampled YouTube dataset (Mislove et al. 2007), where YouTube was found to be the only network with a negative assortativity coefficient (disassortative linking) among the measured social networks. Reciprocal linking on traditional OSNs like Facebook and Orkut exist by definition as the user-user links are undirected. However, with directed links such as subscription or following (on Twitter), two links be- tween a pair of users are required to form a reciprocal rela- tionship. Hence, a new dynamic emerges as users can now perceive the reception of subscription as a symbol of author- ity or interest from others. In effect, highly subscribed-to users of YouTube tend to have a high in-degree/out-degree ratio as they rarely subscribe to others. This phenomenon ex- plains the low-levels of reciprocity observed in our dataset. Measuring reciprocity on the YouTube subscription net- work, we found only 25.42% of the users to have one or more reciprocal links. This level is quite small when com- pared to measurements of other directed social networks such as Flickr at 68% (Cha, Mislove, and Gummadi 2009) and Yahoo! 360 at 84% (Kumar, Novak, and Tomkins 2006). However it is remarkably close to the 22.1% of the popula- tion on Twitter reported by Kwak et al. (Kwak et al. 2010). This shows that, like Twitter, YouTube users subscribe to the notion of influence via subscription links as opposed to real- life social relationships as links typically depict in traditional OSNs. Defining reciprocative users as those with more reciproca- tive out-going links than non-reciprocative out-going links, approximately 15% of the user population are reciprocative users. The bottom plot of Figure 2 shows the same “Who I Subscribe To” plot for these users. Interestingly, we now observe assortative linking by the median of the in-degree bins, which is strikingly different compared to what is above. Although defying outliers exist, largely, reciprocative users are significantly more assortative in their subscription be- haviour than non-reciprocative users. This suggests that user linking behaviour may be guided by the linking mechanism (directed or undirected) and ultimately affect the dynam- ics of the social network. On YouTube, even though users link directly and the majority link non-reciprocatively and disassortatively, there exists a subset of the measured popu- lation that demonstrate traditional social behaviour, despite the linking mechanism of YouTube. To examine user homophily, we capture the video cat- egory that each user uploads the most content in. Then, this upload category is compared between linked users on the subscription graph and comment graph. Examining who each user is linked with (inward links and outward links), it is observed that on average, only 26.58% (s.d. of 3.33%) of a user’s subscription neighbor set have the same mode up- load category. Correspondingly, the average is 27.46% (s.d. of 3.50%) on the comment graph. Further, on the subscrip- tion graph, only 12.49% of users have more neighbours in the same main upload category than neighbours in another category. Similarly on the comment graph, 10% of the users have more than 50% of their neighbours in the same main upload category. Therefore, at the user-level, we observe a lack of homophily between linked users when comparing the mode upload category, which may be loosely used to represent user interest. Again, this deviates from what is reported for traditional OSNs (McPherson, Smith-Lovin, and Cook 2001). In 2010, Weng et al. (2010) statistically tested for the presence of homophily in a sampled dataset of 6748 Singapore-based users on Twitter. They concluded, with high probability, that users linked with ”following” relationships are interested in similar topics and used it to as basis to explain observed reciprocity. However, both Cha et al. (2010) and Kwak et al. (2010), with a near-complete dataset of Twitter, found low rates of reciprocal linking and a lack of homophily
- 5. on Twitter. Here, our results for YouTube show a lack of homophily and reciprocity to confirm this phenomenon of content-driven OSNs. A Dichotomy of Interaction and Subscription Overlap- ping the subscription graph and the comment graph, we study the nodes who exist in both graphs and compare their incoming links. Formally, for each node µ, we can ana- lyze the overlap of its commenter set Cµ ∈ {c1, c2, ..., cn} and subscriber set Sµ ∈ {s1, s2, ..., sn}. Denoting a set Oµ := Sµ Cµ, we calculate the overlap percentage as ρµ = Oµ Sµ Cµ . Averaging over all n nodes that exist in both graphs, we find ¯ρ = 9.6% (s.d. of 1.9%). Comparing the overlapped set with each of the two neighbourhood sets, it is found that, averaging over all users, ¯α = 1 N N µ=0 Oµ Sµ = 18.1% and ¯β = 1 N N µ=0 Oµ Cµ = 16.5%. These results show that, on average, only a small portion of a user’s subscribers are also commenters and vice versa. This differs from tradi- tional OSNs such as Facebook since links are formed based on social relationships and interaction is basis for relation- ship. Here, we observe the user-content-user relationship that differentiates the interaction dynamic for YouTube as a content-driven OSN. Sensibly, it is expected that users leave comments on videos to address the video content, without necessarily im- plicating a social or influence relationship with the uploader. On the other hand, it is surprising that subscribers are also not likely to comment on videos uploaded by users they subscribe to, as indicated by a low ¯α. At the same time, it is found that both the subscription graph and the com- ment graphs are as active as each other with similar number of nodes and number of unique (for comment graph) pair- wise links. This suggests an interesting nature of YouTube— there is a dichotomy between the dynamics of “content” (user→content) and the dynamics of “social” (user→user), where content consumption and social influence are simi- larly active, but largely, separate components of the same system. Naturally, commenting relationships between users can be captured as a directed graph with weights, where each weight represents the frequency of comments in the direc- tion of the link. Therefore, a modified comment graph can be generated by pruning edges with a threshold, τ, below some frequency. Numerically, for τ = 1, 2, 5, 10, the resulting ¯ρ, ¯α, and ¯β are plotted in Figure 3. Expectedly, the thresh- olded commenter set steadily decreases in its ability to recall subscription links (¯ρ). However, the thresholding effect sig- nificantly increases the overlap proportion between the in- tersection and the commenter set, ¯β. From Figure 3, we can see that on average, >50% of commenters who have com- mented equal to or more than 10 times are subscribers, com- pared to less than 20% without thresholding. In effect, sim- ply thresholding on comment frequency produces a smaller set of commenters who are more likely to be subscribers Overlap Proportions Percentage 01020304050 t=1 t=2 t=5 t=10 rho alpha beta Figure 3: Implict-explicit social graph overlap for various comment threshold levels. as well. This shows that although the majority of the com- menter and subscriber sets follow the dichotomy mentioned above, a significant portion of repeat commenters break this dichotomy between commenters and subscribers. What is YouTube Popularity? Although various methods exist, the proxy measure of popu- larity on YouTube comes from the number of subscribers. In this work, we measure and compute additional features that represent social and content popularity. In this section, we provide some analysis of how these features relate to each other. The top plot of Figure 4 depicts in-degree of users (with at least one upload) against the number of videos uploaded (undeleted) on log-log scales. There is a linearly increasing trend in the median of each logscale-bin, suggesting that, typically, users increase the number of uploads as they be- come more popular. However, this increase in median flat- lines and picks up again for extremely popular users. De- spite the trend observed in the median of each bin, a large number of outliers exist on the lower-end of the in-degree scale. Amongst these, some users with 0 or 1 subscriber are uploading thousands of videos. This points to the fact that although many users take advantage of the subscription service to link to others, a significant number of users sim- ply use YouTube as a content diffusion network without any need to connect “socially”. In the same figure, we plot the relationship of PageRank and In-Degree for the subscription graph. The main idea be- hind PageRank is to allow propagation of influence over the network (Easley and Kleinberg 2010). Instead of just counting the number of edges, it takes into account who subscribes. From the bottom plot of Figure 4, we see a linearly increasing relationship between a user’s in-degree (also log-binned) and PageRank. This is not surprising as a user with more subscribers obtain “influentialness” from a larger number of subscribers. However, a large number of outliers with relatively high PageRank exist in bins contain- ing low in-degree users. In these cases, the relatively few
- 6. In−Degree vs. PageRank In−Degree PageRank qq q qq q qqqq q qqqqqqq q qq q q qqqqqq q qqqqq q q qq q qqqqq q qqqqq q qq q q qqqqqqqq q qqq q qqq q qq q qq qq q qq q q q qq q q q q qqqqqqqq q q qqqq q q q q q q q q q qqqqqqqqq q qqq q q qqqqqqq q q qqqqqqqq q qq q q q q q qqqq q qqqq q q qqqqqqqqqq qq q q qq q qqqqqqqqqq q qqqq q qqqqqqqqqqqqqqqqq q qqqqqqq q q qqqqq qq qq q q q q q q qqq q qqqqqqqqq q qqqq q qq q qqqqqqqqqq qqqqqqq q qqq q qqq qq q qqq q qqqqqq q qqq q qqqqqqqq q q q qqqqqqq qq qq q q qqqqqqq q q q q q q q q qqqq q q q q qqq qqq q qqqq q qqq qq q qqq q qqqq q qqq q q q qqq q qqq q qqq qq q qq q qqqq q qqqqq q qqq q qqqqqqqqq qq q q qqqqqqqqqq q q q q q qq qqqq q qq q q q qqq q qqq q q q qq q q qq q q q qqq q qqqqqqqqqq q qq q q qqq qq q qqq q q q qqqqqq q qqqq q q q q q q qqqqq q qqqq q qqqqqqq q q qq q q qqqqqq q q q qq q qqq q q q qqq q q q q q qq q qq q qqqqqqq q qqqqq q qq q qqqq qq qq q qqqqqqqqqq q q q q q q qqqqq q qqqqqq q qqq q q q qq q qqq q qqqqqq q q q qq q q q qqqqq q qqqqqq q qq q qq q q q qqq q q q q q q q qqqqq q qqq q q q q q q q qqqqqq q qqqqqqq qqqqqqqqqqqqq q qqqqqq q qq q qqq q qqqq q q qqqqqq q qq q q q q qqqqqqqqqqq q q qqq q qq q q qqqqq q qqqqqqq q qq q qqqqqqq q q qq q qqqqqqq q qq q q q qq q q qqqqqqqqqqq q qqqqqq q q q q qq q qq q q q q q qqqq q q q q q qqqq q q qqq q qqqqqqqqqqqq q qq q qqq q qq q qq q q q q q qqqqqqqqqq q qq q qqqqqq q qqqqqq q q qqqqq q q q qqq q qqq q qqqq qq qqqqqq q q qqqq q qqqqqq q qqqqq q qq q q qqqqq q q q q qq q q q q q q q q qq q qq q qq qqqqqqqqqqqq q q qq q q qqqqq q q q qq q q q q q q q q q q q qq q q q q qq q qqqqq q qqqqq q qq q qqq q q q q q qqqqq q q qqqqqqq q q qqqqq q q q qqqq q qq q q qq q q q q qq q q q qq q q q qqqqq q q q q qq q qqqq q q q qqqqqq q q qqqqqqqqq q q qq qq qqqqq q qqqq q q qqq q qq q q q q q qqqqq q q q qq q qq q q q qqqqqqq q qq q q q q qqqqqqq q qq q q q q q qqq q q q q q q qqqqqq q qq q q qqq qqqqq q qq q q q q q q q qq qqq q q qqqqqqqqqq q qq q q qqqq q q qqqqq q qqq q q qqqqqq q qqq q q qqqq q q q qqq qqq qq q qqq q q qq q q q qqq qqq q q qqqqq q qq qq qqqq q qqqqqq q q q qqqqqqqqqqq q q q qqqqqqqq q q q qqqqqqqqqq q qqqqqqqq q qqqq q qqq q qq qqqq qq q q q qqqq q q q qqq q qqqqqqqqqqqq q qqqqqq q q q q qqq q qq q q qqq q q q qqq q qqqqqq q qqqqqqqqqqqqq q q qqqqqqqqqq q qqq q q qq q q q q qqqqq q q qq q q q q qq q q q q q qq q q q qq q q qq q qqqq q qq qqq q q q qqq q qq q q qqqqqqq q qq qq q q q q qq q qqqq q qqqqqqqqqqqqqqqq qq q q qq q q q qq q q qqq q qqq q qqq q qqqq q qqqqqqq q q qqqq q qqqqq q qqqqq q qq q q q qqqqqq q qqqqq q q q qq q q q qqqqq q q qqqqqqqqq q q qqqqqqq qqqqqqqqq q qqqqqqqqqqqqqqqqqq q q qq q qq q q q qq q qqq q qqq q qqq q q q q q q q q qq q qqqqqq q qq q qq q qqqqqq q qqqqq q q q q qqq qq qq q qq qqq q q q q q qqq q qqq q qqqq qq qqqqq q q q q qq q q qq q qq qq q qqq q qqqq q qq q q qqq qq q q q q q q q q qqqqqq q qqqqqq q qqqqqqqq q qqqqqqqqqqq q q q qqqqq q q qqqqq q q q qqqqq q q q qqq q qq q qqq q q q qqqqqqq qqqqq q qqqqq q q qqqqqqq q qqqq q q q qq q qqq q q q q q q qq q qq q q q qq q qqqq q qqqq q q q q qqqqq q qqqqq q q q q qqqqqqqqqq qq q q q qq q qqq q q q q qqqq q q q q q qqq q q q q q qqq q q qqqqq q qqqqq qqqq q qq q qqqq q q q q q q q qqq q q q q q q q q qqqqq q q q qq q qqqqq q q q qqqqqq q q q qqqqqqqq qq q qq q qqqqq q qqqqqqqqqq q q q qqqqqqq q q q q qq q q q q q q qqq q q q q qqqqq q qqq q q q qq qqqq q qqqq qq q q qq q qqq q q qq q q q q q q q q q q q q q qqqqq q q qqqqqqqqqq q q q qqqqq q qqqq q qq q q q q q q q q q q qq q q q q q q qq q q q qq q q q qq q qq q qqq q q q qqqq q qqqqqqqqqqqq qqqqqqqqqq q qq q qq q q q q q q q q qq q q qqqq q q q qqq q qqqqqq q qqqqqqqqq q qqqq q qqqq q q qqqqqqqqqqqqq q q qqq q qq q q qqqqqq q qqq q qq q q q q q qqqqqqqqqqqq q qqqqq q q q qq q qqqqqqqqqq q qqqqq q q q q q qq q q q q q qq q qqqqqq q q q qqq q qqqqq q q q qqq q q q qq q q q q q qq q q q q q qq q q q qqqq q q qq q qq q qqq q q q q q q q q q q q q q q q q q q q q q q q qq q q q q q q q q q q q q qq q q q qq q qqq q q qqq qq qqq q qqqqqqq q q q qqq q q q q q q q q qq qqqqq q qq q q q q q qq q q q q qq q qq q q q q q q q qq q q q q qq q q q q q q q q qq q q q q q q q q qq q q q qq q q q qq q qqqq q q q q q q q q q q q q q q q q q q qqqqqqqq q q q q q q q q qqq q q q q qq qq qq q q q q q q q qq q q q q qq q q qq q qqqqqqqq q q q q qqq q q q q q q q q q q q q q q q q q q q q q qq q qq q qqq q qqq q q qqq q qqq q qq q q q q q q q qq qq q q q qqq q qqq q qq q q q q q qq q q qqq q q q q q q q q q qq qq q q q q q qqq q q q qq qq q q qq q q q qqqq q q q q q q qq q qqq q q q q qq q q q qqqqqqq q q q q q q q q qqqq q q q q qq q q qq q q q qq qq q q q q q q q q qqq qq q q q q qqqqqqqq q qq qqq q q q q qq q q qq q q q q q q q q q qqq q qq q q qq q q qqq qq q qq qqq qq q q q q qq q qqqq qq q q q q q q q q qqq qq q q q q qqqq qq q q qq q q q q q q q qqq q qq q q qqqqq qq q qqq q q q q qq q qq q q qq q q q q qq q q q q q q q q q q q q q q q q q q q q q q q q qq q q qq q q q q qq q q q q q q q q q q q q q q q q q q qqq q qq q q q q q q q q q q q q q q q q q q q q q qqqq q q qqqq q qqqq q q qqqqq q q q qq q q q q qq q q q q q q q q q q qq q qq qqqqq q q q q q q q q q qq q q q q q q q q qq q q q q q q q q q q q q q q q q q q q q q qqq q q q q qqq q qqqqq q qq q q q q q q q q q q q qq q q q q q q q q q q q q qq q q q q qq q q q q q q q qq q q q q qq q q q q q qq q q qq q qqq qq q qq qq q q q q q q qq q q q q q q q q q q q qq q q q q q q q q q q q q q q q q q q q q q q q q qq q q q q q q q q q q q q q qq q q q q q q q qq qq q q q q q q qq q q qq qq q q q q q qq q q q q q qqq q qqq q q q qq q q q q q qq qq q q q q qq q q q q q q q q q q q q q q q q q q q q q q q q q q q q q q q q q q q q q q q q q q q q q q q q q q q q q q q q q q q q q q q q q q q qq q qq qq q q q q q q q qq q q q q q qq q q q q q q q q q q q qq q q q q q qqqq q q q q q q q q qq q q q qqq qq q q q q q q q q q qqq q q qq q q qq q q q q q q q q q q q q q q q q q q q q q q q q q q q q q q q q q q qq q q q q q q q q q qq q q q q q qq q q q q q qq q qqq q q q q q q q q q q q q q q q q q q qq q qq q qq q q q q q q q q q q q q q q q q q q q q q q q q q q q q q qq q q qq q q q q qq q q q q qq q qq q qq q q q q q q q q q q qq q q q q q q q q q q q q q q q q q q qqq q q q q q q qq qq qqq q qq q qqq q q q q q q q q q q q q q q q q q q q qq q q q q q qq q q q q q q q q qq q qq qq q q q qq q q q q q q q q q q q qq q q q q q q q qq qq q qq qq q q q qq qq q q q q q q qq q qq qq q q q q q q q q q q q qq q q q q q q qqq q q qq qq q q q q q q q q q q q q q q q q q q q q q q q q q q q qq qq q q q q q q q q q q q q q q q q q q q q q q q q q q q qq q q q q q q q q q q q q q q q q q q q q q q q q q qq q q q q q qq q qq q q q q q q q q q q q q q q q q q q q q q q q q q q q q qq q q q qq q q q q q q q q q q q q q Figure 4: In-degree vs. quantity of uploaded content (top) and PageRank (bottom) subscription links come from subscribers who are very in- fluential. Even though these outlier users are still one or two orders of magnitude less in PageRank than the top in-degree users, they may be emerging power-users in the future. We leave the study of evolutionary dynamics of these users to fu- ture work. As mentioned previously, measures in addition to subscriber quantity can capture other facets of user popular- ity. Figure 5 plots a heatmap of Spearman’s rank correlation (Spearman 2011) for the various nodal features measured. This measure ranges between [−1, 1] where -1 denotes per- fect anti-correlation while 1 denotes perfect rank correlation. The metrics are arranged such that they are hierarchically ar- ranged with dendograms to show the clusters by correlation strength. Note, as the minimum feature correlation is slightly greater than -0.5, the lower end of the color spectrum (red) depicts -0.5 and not perfect anti-correlation (-1). In Figure 5, the dendogram can be pruned to show three main clusters based on correlation strength. Look- ing row-wise, the top group consists of features such as sub.pagerank, com.pagerank, sub.in, com.in, which are social features that gauge popularity. In the same group uploads reciprocal sub.out com.out median.fav median.views median.coms median.raters min.views min.fav min.coms median.avg.rating min.avg.rating min.raters max.avg.rating sub.pagerank sub.in max.raters max.views max.fav max.coms com.pagerank com.in uploads reciprocal sub.out com.out median.fav median.views median.coms median.raters min.views min.fav min.coms median.avg.rating min.avg.rating min.raters max.avg.rating sub.pagerank sub.in max.raters max.views max.fav max.coms com.pagerank com.in 0 0.5 1 Value 05101520 Color Key and Histogram Count -0.5 Figure 5: Heatmap of feature correlations by correlation strength, there are content-based popularity measures that depict maximum content popularity attained: max.coms, max.fav, max. views, max.avg.rating, max.raters. In the second group by correlation, typical (median) content popularity and minimum content popularity measures are clustered together. Finally, the third group of correlated measures are measures of user actions such as the out degree on social graphs or upload quantity. From the correlation clusters, social popularity on YouTube is tied, not to typical performance in content popularity, but to maximum achieved content popularity. This suggests that a single “hit” could dramatically influence a user’s social popularity despite a larger proportion of lacklustre uploads. YouTube Partner Classification Leveraging the explicit, implicit social graphs and content metrics, a simple supervised learning task is described in this section. Here, we will illustrate the effectiveness of the nodal user features in a highly-imbalanced binary classifica- tion task. The YouTube Partner Program Created in 2007, the YouTube Partner Program (YPP) has over 20,000 partners from 22 countries around the world. It is a program that promotes outstanding content on YouTube by sharing YouTube’s advertisement revenues with content creators. To qualify for the program, users go through a manual selection process that considers criteria such as size of audience, quality of content, compliance with YouTube’s Terms of Use, among others. To cope with increasing pop- ularity of the YPP, we illustrate a classification system that pre-filters potential candidates to aid the manual selection
- 7. False positive rate Truepositiverate 0.0 0.2 0.4 0.6 0.8 1.0 0.00.20.40.60.81.0 * * * * * * * * ******* ********************************************************************************************************************************************************************************************************************************************************************************************************************************************************************************************************************************************************************************************* * * * * * * * * * * * All outdeg indeg reciprocal com.in com.out pagerank max.fav fav min.fav max.views views min.views main.cat max.coms coms min.coms uploads max.raters raters min.raters max.avg.rating avg.rating min.avg.rating com.pagerank ROC Curve for P1 Partners False positive rate Truepositiverate 0.0 0.2 0.4 0.6 0.8 1.0 0.00.20.40.60.81.0 * * * * * * * ** * **** ** * * * ******** ********************************************************************************************************************************************************************************************************************************************************************************************************************************************************************************************************************************************************************************** * * * * * * * * * * All outdeg indeg reciprocal com.in com.out pagerank max.fav fav min.fav max.views views min.views main.cat max.coms coms min.coms uploads max.raters raters min.raters max.avg.rating avg.rating min.avg.rating com.pagerank ROC Curve for P2 Partners False positive rate Truepositiverate 0.0 0.2 0.4 0.6 0.8 1.0 0.00.20.40.60.81.0 * * * * * * **** * ******** *************************************************************************************************************************************************************************************************************************************************************************************************************************************************************************************************************************************************************************************** * * * * * * * * * * * * * All outdeg indeg reciprocal com.in com.out pagerank max.fav fav min.fav max.views views min.views main.cat max.coms coms min.coms uploads max.raters raters min.raters max.avg.rating avg.rating min.avg.rating com.pagerank ROC Curve for P3 Partners Figure 6: Receiver operator characteristic curve for YouTube partner classification process. There exists three categories of user partners in the YPP, which we denote as P1, P2, P3. Typically, partners in the P1 group are private users who have gained significant popularity and consistently influences the YouTube commu- nity. P2 and P3 partners are mainly companies that establish contracts with YouTube for diffusing content as part of their business. In our setup, a binary-classifier is used to classify each category independently. The YPP Classification Framework A critical challenge to the YPP classification problem is the highly-skewed nature of YPP instances, which is a tiny frac- tion of the YouTube user population. Due to this imbalance, the classifier needs to carefully avoid over-classifying nega- tively such that promising users are not passed as false neg- atives. On the other hand, a higher number of false positives is not as critical since this tool serves as part of a discovery process, where manual selection follows. Classifier Setup Formally, a feature vector ¯fµ can be con- structed for each user µ, where µ ∈ N of the set of users who have existing measurements for the three aforemen- tioned data sources. Then, a feature matrix F ∈ d×N can be constructed from the N users with d = 24 features each. For each of the 3 types of partners, a vector l ∈ l×N con- tains the binary label the the partner type to be classified. In the training and testing phases of the classifier, a 10-fold cross-validation setup is adopted where {F, l} is column-split into {FT R, lT R} ∼ 90% of N and {FT E, lT E} ∼ 10% of N. Due to the computation limits of running the classifier process in the statistical program R (R Development Core Team 2010), F is uniformly sam- pled to be approximately 35% of the users who have com- plete feature information. We use the randomForest package (Liaw and Wiener 2002) in R to train and test the classifier. To ensure there is no shortage of positive instances exposed, the training data contains all positive instances in FT R while negative instances are sampled to maintain a 1:1 ratio with the number of positive instances used. However, it should be noted that all testing results reflect the highly-imbalanced real-world ratio found in the original data. Table 2: AUCs of YPP classification Mean AUC Std. Dev. P1 Partners 0.9682098 0.02123823 P2 Partners 0.9580012 0.03234237 P3 Partners 0.9428346 0.04128529 Table 3: Top Gini entropy reducing features Rank P1 P2 P3 1 indeg pagerank pagerank 2 max.fav indeg indeg 3 pagerank com.in com.in Classifier Performance In Figure 6, the ROC curve is shown for each of the three types of partners. High AUC is obtained when all features are used in the classification pro- cess. Also plotted are the ROC curves of the individual fea- tures when used as the only predictor. From the ROC curves, it is apparent that the trained model is able to successfully utilize a mixture of high and low performing features. Table 2 shows a tabulation of the averaged AUC scores in the test- ing phase for a 10-fold cross-validation setup. Table 3 lists the top 3 features for each partner category in terms of Gini entropy reduction. In the classification results observed, our classifier results in some false positives that drive down pre- cision, however, false negatives remain close to 0 in all three classes. The classifier does a formidable job of correctly fil- tering out a large number of non-partner users. Therefore, as intended, this classifier may serve as a tool to pre-select real-world users for manual partner selection in the YPP. Conclusions In this work, we tie together three full-scale datasets to better understand the nature of the YouTube social network. Com- pared to recent work, this is one of the most comprehensive measurement studies of a major OSN to date. This work was possible due to the availability of data and computing re- sources from within Google.
- 8. We found that the content-driven nature of the YouTube social network differentiates itself from traditional social networks in terms of user linking and interaction behaviours. Comparing the subscription and comment graphs, we find very little overlap between commenters and subscribers, in- dicating a dichotomy of “social” and “content” activities within the same system. Examining popularity, we notice video “hits” are more . Finally, we successfully leverage our measurements to classify for pre-filtering potential YouTube partners for manual selection. This work is one of the first steps towards full-scale OSN measurement and analysis. We propose three areas for fu- ture. First, many computationally intensive graph metrics, such as ones involving 2-hop ego networks, were not at- tempted due to the size of the dataset. These metrics pro- vide additional insight to understand the topology of the so- cial graphs and are invaluable in applications such as link prediction. Second, we do not discuss temporal dynamics of the social graphs in terms of their evolution. For exam- ple, tracking the evolution of low in-degree/high PageR- ank users may reveal interesting insights to how YouTube celebrities emerge. Finally, understanding the interrelation between social graphs and content broadcast/consumption patterns, including temporal analysis, could lead to insights on which/how “viral” videos spread on the YouTube net- work. Acknowledgments We would like to thank Salvatore Scellato for his insights. References Bakshy, E.; Hofman, J. M.; Mason, W. A.; and Watts, D. J. 2011. Everyone’s an influencer: quantifying influence on twitter. In Proceedings of the fourth ACM international con- ference on Web search and data mining, WSDM ’11, 65–74. New York, NY, USA: ACM. Benevenuto, F.; Rodrigues, T.; Almeida, V.; Almeida, J.; and Ross, K. 2009. Video interactions in online video social net- works. ACM Transactions on Multimedia Computing Com- munications and Applications 5(4):1–25. Cha, M.; Kwak, H.; Rodriguez, P.; Ahn, Y.-Y.; and Moon, S. 2007. I tube, you tube, everybody tubes: analyzing the world’s largest user generated content video system. In Pro- ceedings of the 7th ACM SIGCOMM conference on Internet measurement, IMC ’07, 1–14. New York, NY, USA: ACM. Cha, M.; Haddadi, H.; Benevenuto, F.; and Gummadi, K. P. 2010. Measuring User Influence in Twitter: The Million Fol- lower Fallacy. In Proceedings of the 4th International AAAI Conference on Weblogs and Social Media (ICWSM). Cha, M.; Mislove, A.; and Gummadi, K. P. 2009. A measurement-driven analysis of information propagation in the flickr social network. In Proceedings of the 18th interna- tional conference on World wide web, WWW ’09, 721–730. New York, NY, USA: ACM. Cheng, X.; Dale, C.; and Liu, J. 2008. Statistics and so- cial network of youtube videos. In Quality of Service, 2008. IWQoS 2008. 16th International Workshop on, 229 –238. De Choudhury, M.; Mason, W. A.; Hofman, J. M.; and Watts, D. J. 2010. Inferring relevant social networks from interpersonal communication. In Proceedings of the 19th international conference on World wide web, WWW ’10, 301–310. New York, NY, USA: ACM. Dean, J., and Ghemawat, S. 2008. Mapreduce: simplified data processing on large clusters. Commun. ACM 51:107– 113. Easley, D., and Kleinberg, J. M. 2010. Networks, Crowds, and Markets: Reasoning About a Highly Connected World. Cambridge University Press. Hong, L.; Dan, O.; and Davison, B. D. 2011. Predicting popular messages in twitter. In Proceedings of the 20th inter- national conference companion on World wide web, WWW ’11, 57–58. New York, NY, USA: ACM. Kahanda, I., and Neville, J. 2009. Using transactional infor- mation to predict link strength in online social networks. Krishnamurthy, B.; Gill, P.; and Arlitt, M. 2008. A few chirps about twitter. In Proceedings of the first workshop on Online social networks, WOSN ’08, 19–24. New York, NY, USA: ACM. Kumar, R.; Novak, J.; and Tomkins, A. 2006. Structure and evolution of online social networks. In Proceedings of the 12th ACM SIGKDD international conference on Knowledge discovery and data mining, KDD ’06, 611–617. New York, NY, USA: ACM. Kwak, H.; Lee, C.; Park, H.; and Moon, S. 2010. What is Twitter, a social network or a news media? In Proceedings of the 19th international conference on World wide web WWW 10, 591. ACM Press. Liaw, A., and Wiener, M. 2002. Classification and Regres- sion by randomForest. R News 2(3):18–22. Malewicz, G.; Austern, M. H.; Bik, A. J. C.; Dehnert, J. C.; Horn, I.; Leiser, N.; and Czajkowski, G. 2010. Pregel: a system for large-scale graph processing. In Proceedings of the 2010 international conference on Management of data, SIGMOD ’10, 135–145. ACM. McPherson, M.; Smith-Lovin, L.; and Cook, J. M. 2001. Birds of a Feather: Homophily in Social Networks. Annual Review of Sociology 27(1):415–444. Mislove, A.; Marcon, M.; Gummadi, K. P.; Druschel, P.; and Bhattacharjee, B. 2007. Measurement and analysis of online social networks. Proceedings of the 7th ACM SIGCOMM conference on Internet measurement IMC 07 29. R Development Core Team. 2010. R: A Language and En- vironment for Statistical Computing. R Foundation for Sta- tistical Computing, Vienna, Austria. ISBN 3-900051-07-0. Spearman, C. 2011. Spearman ’ s rank correlation coeffi- cient. Amer J Psychol 15(September):1–5. Weng, J.; Lim, E.-P.; Jiang, J.; and He, Q. 2010. TwitterRank : Finding Topic-sensitive Influential Twitterers. New York Paper 504:261–270. Xiang, R.; Neville, J.; and Rogati, M. 2010. Modeling rela- tionship strength in online social networks. Proceedings of the 19th international conference on World wide web WWW 10 981.