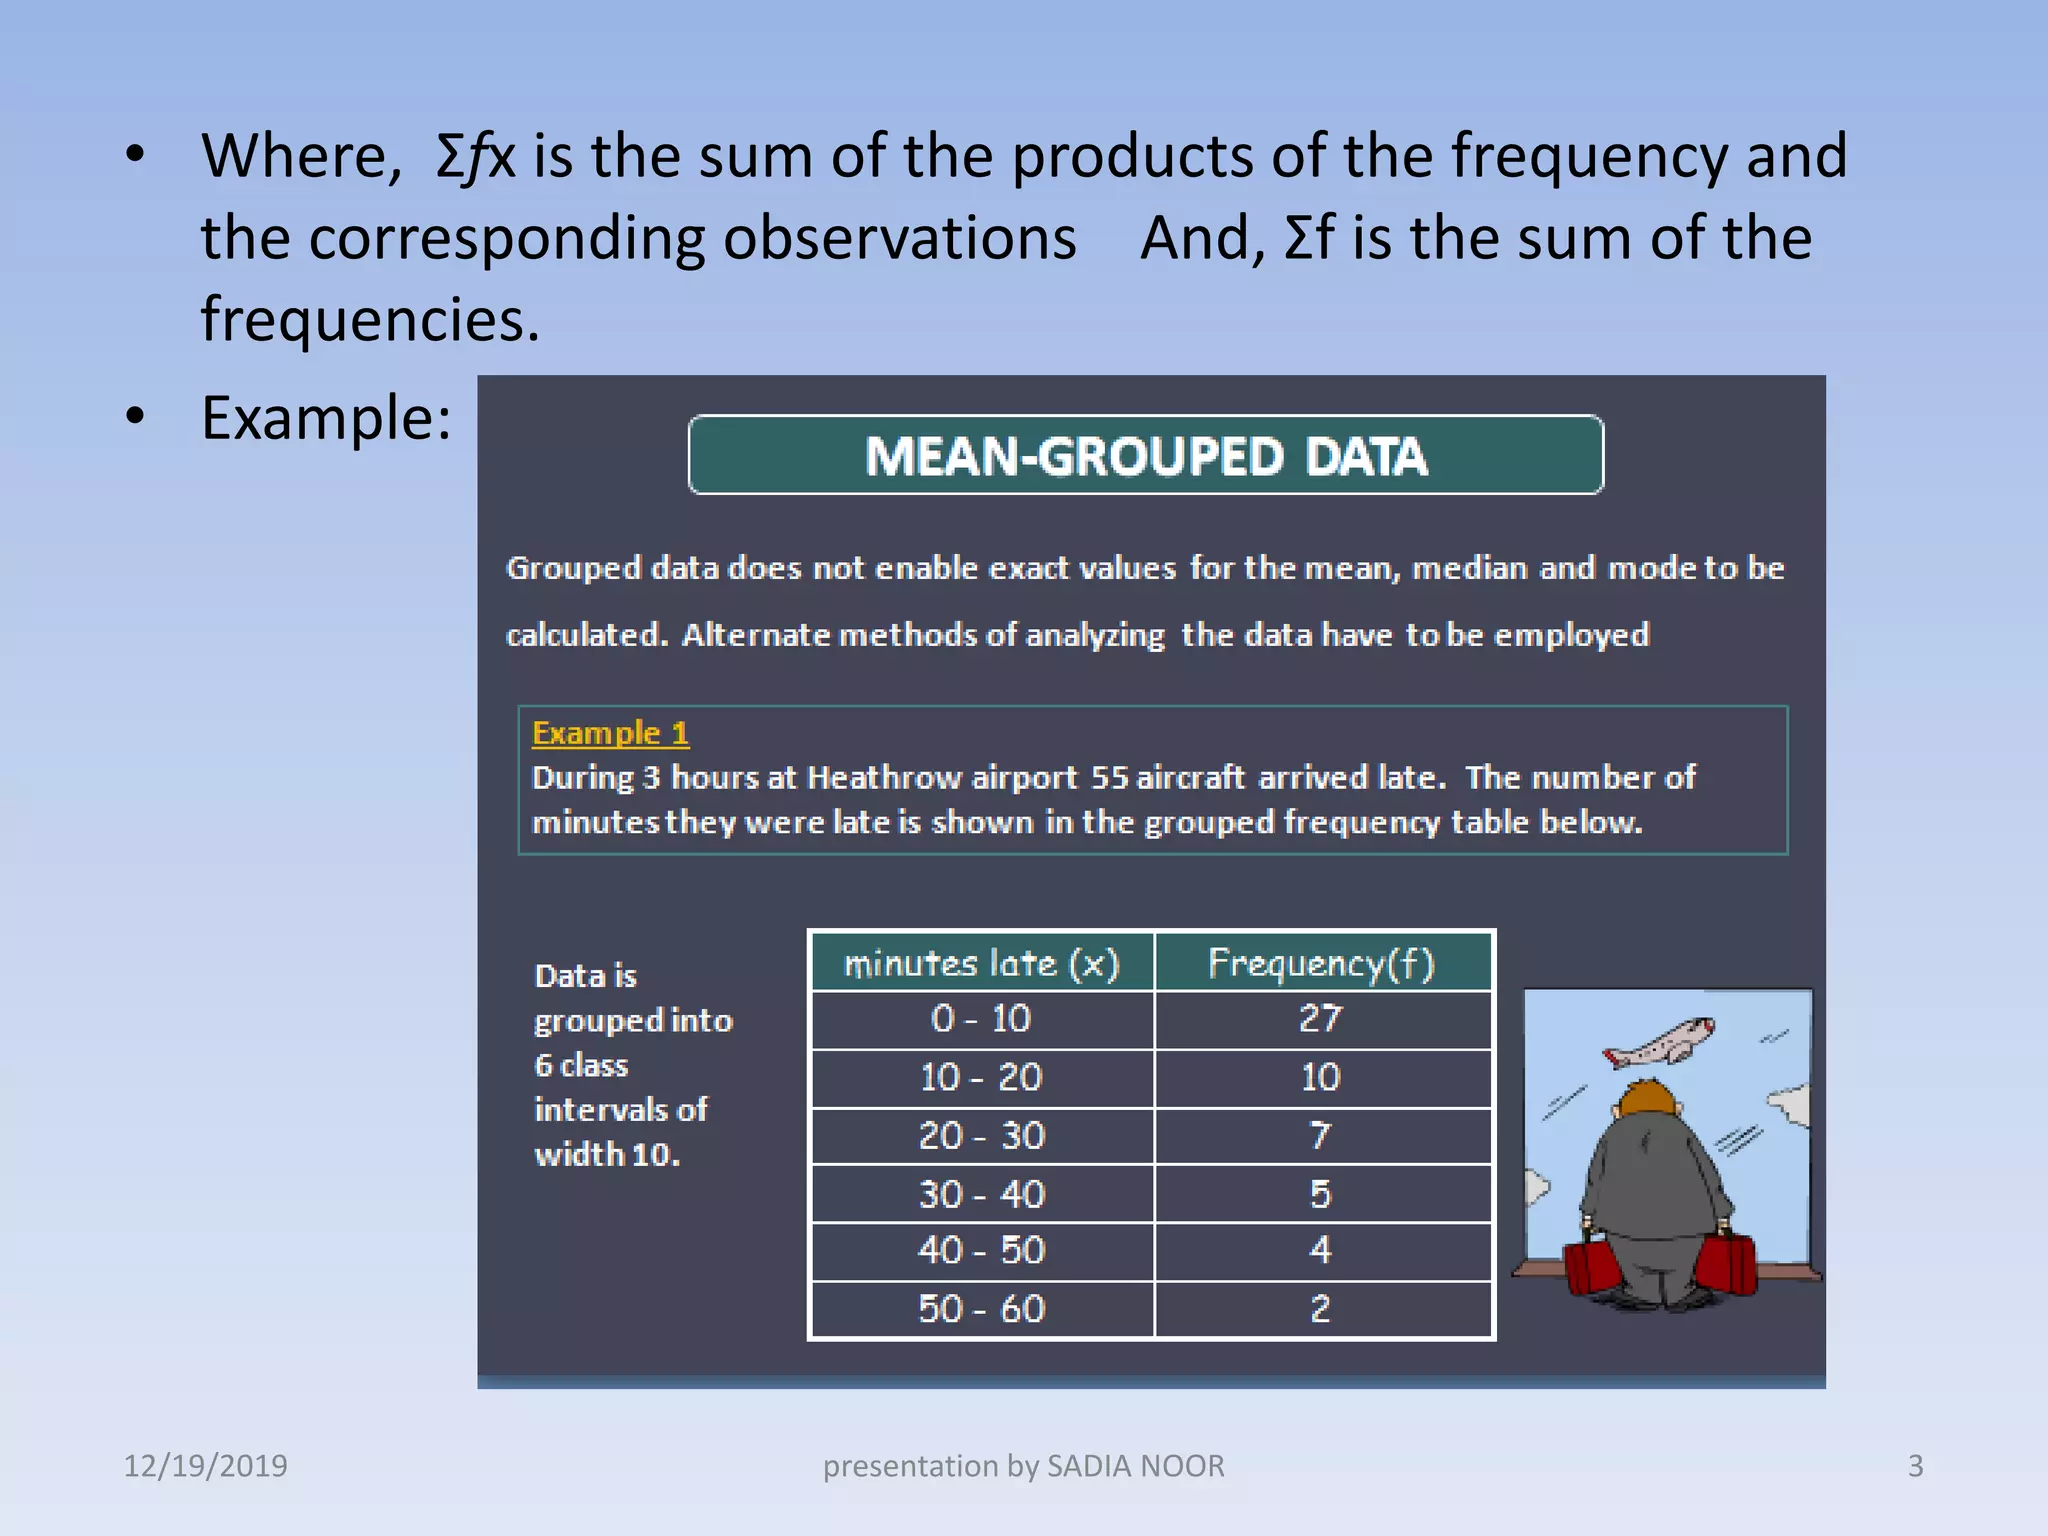
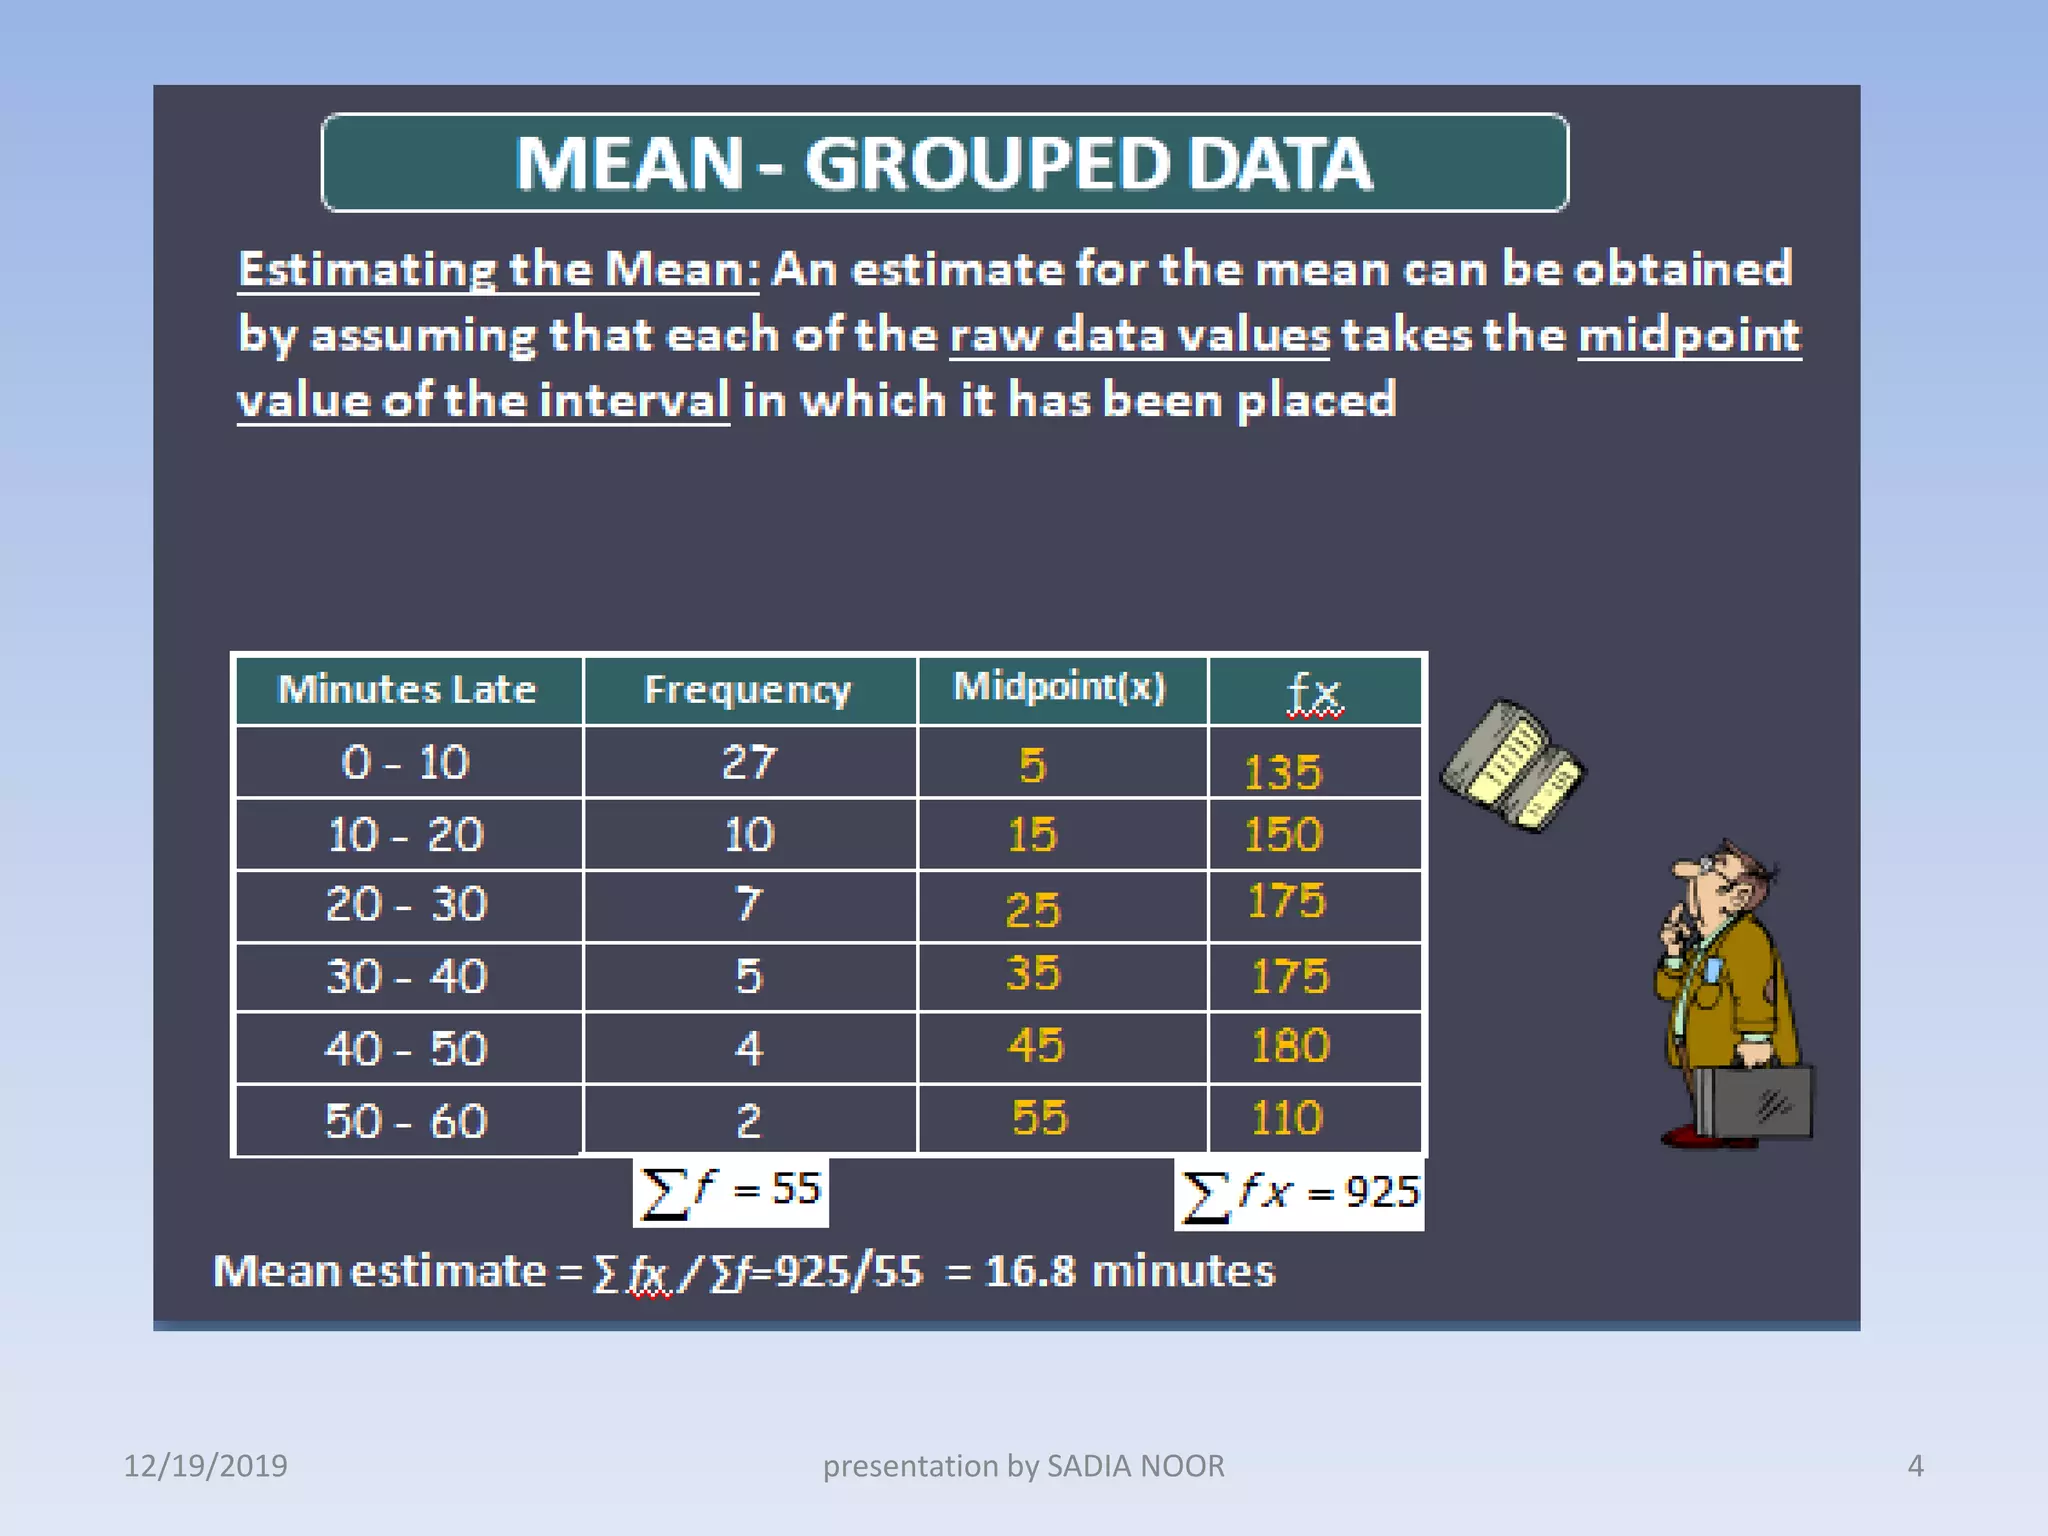
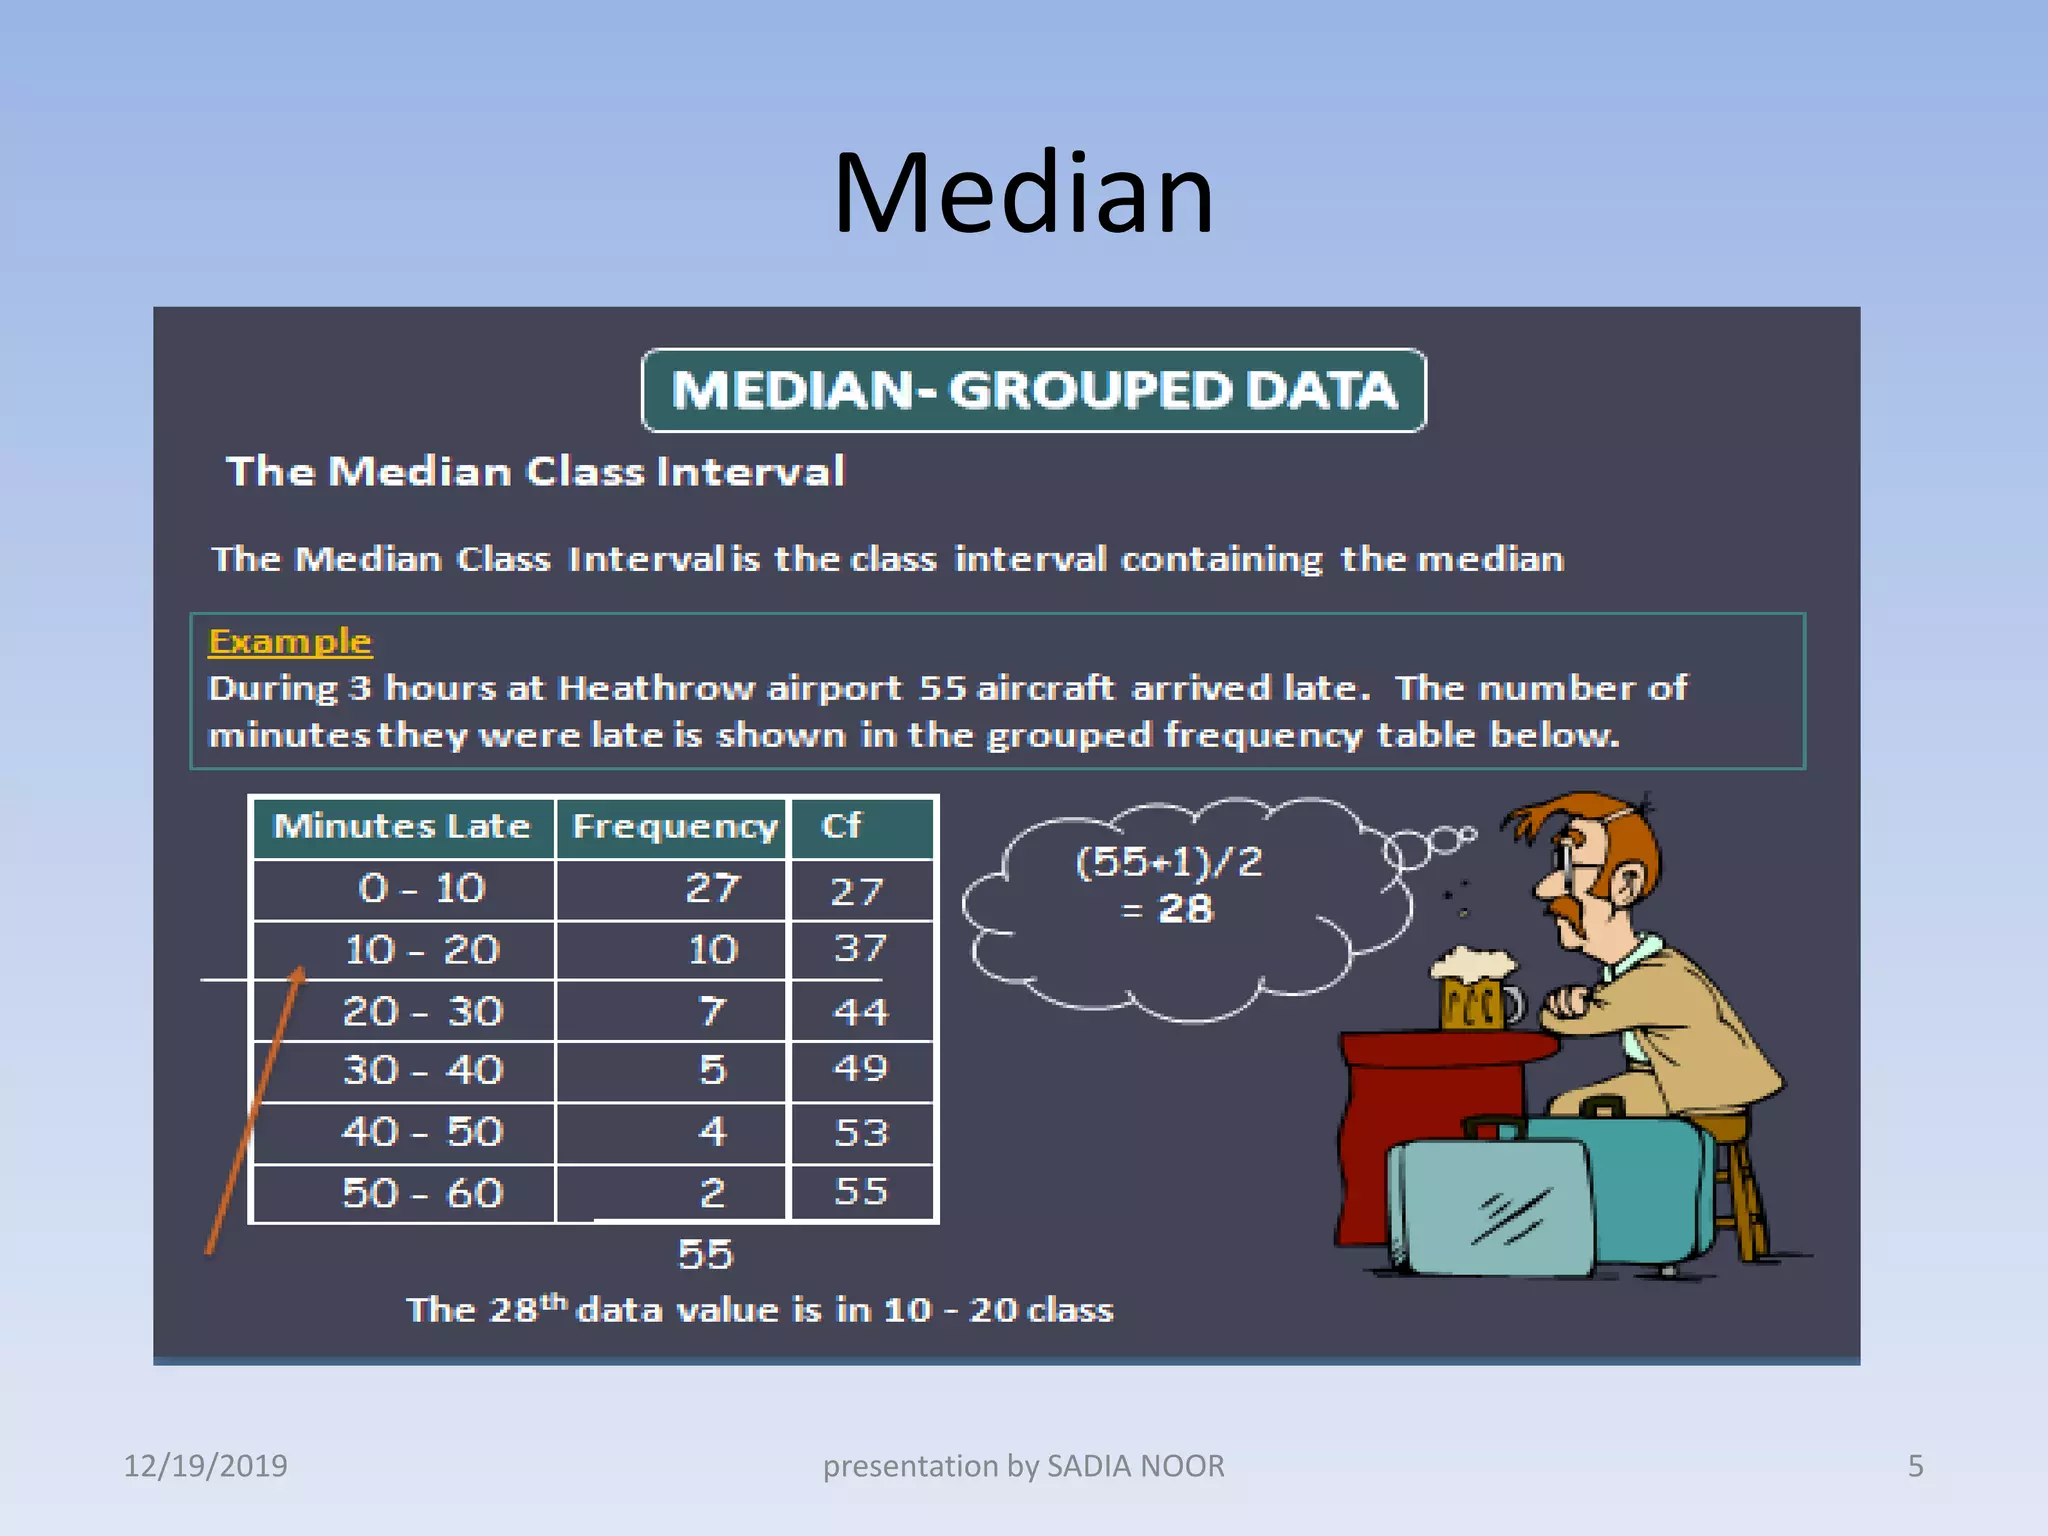
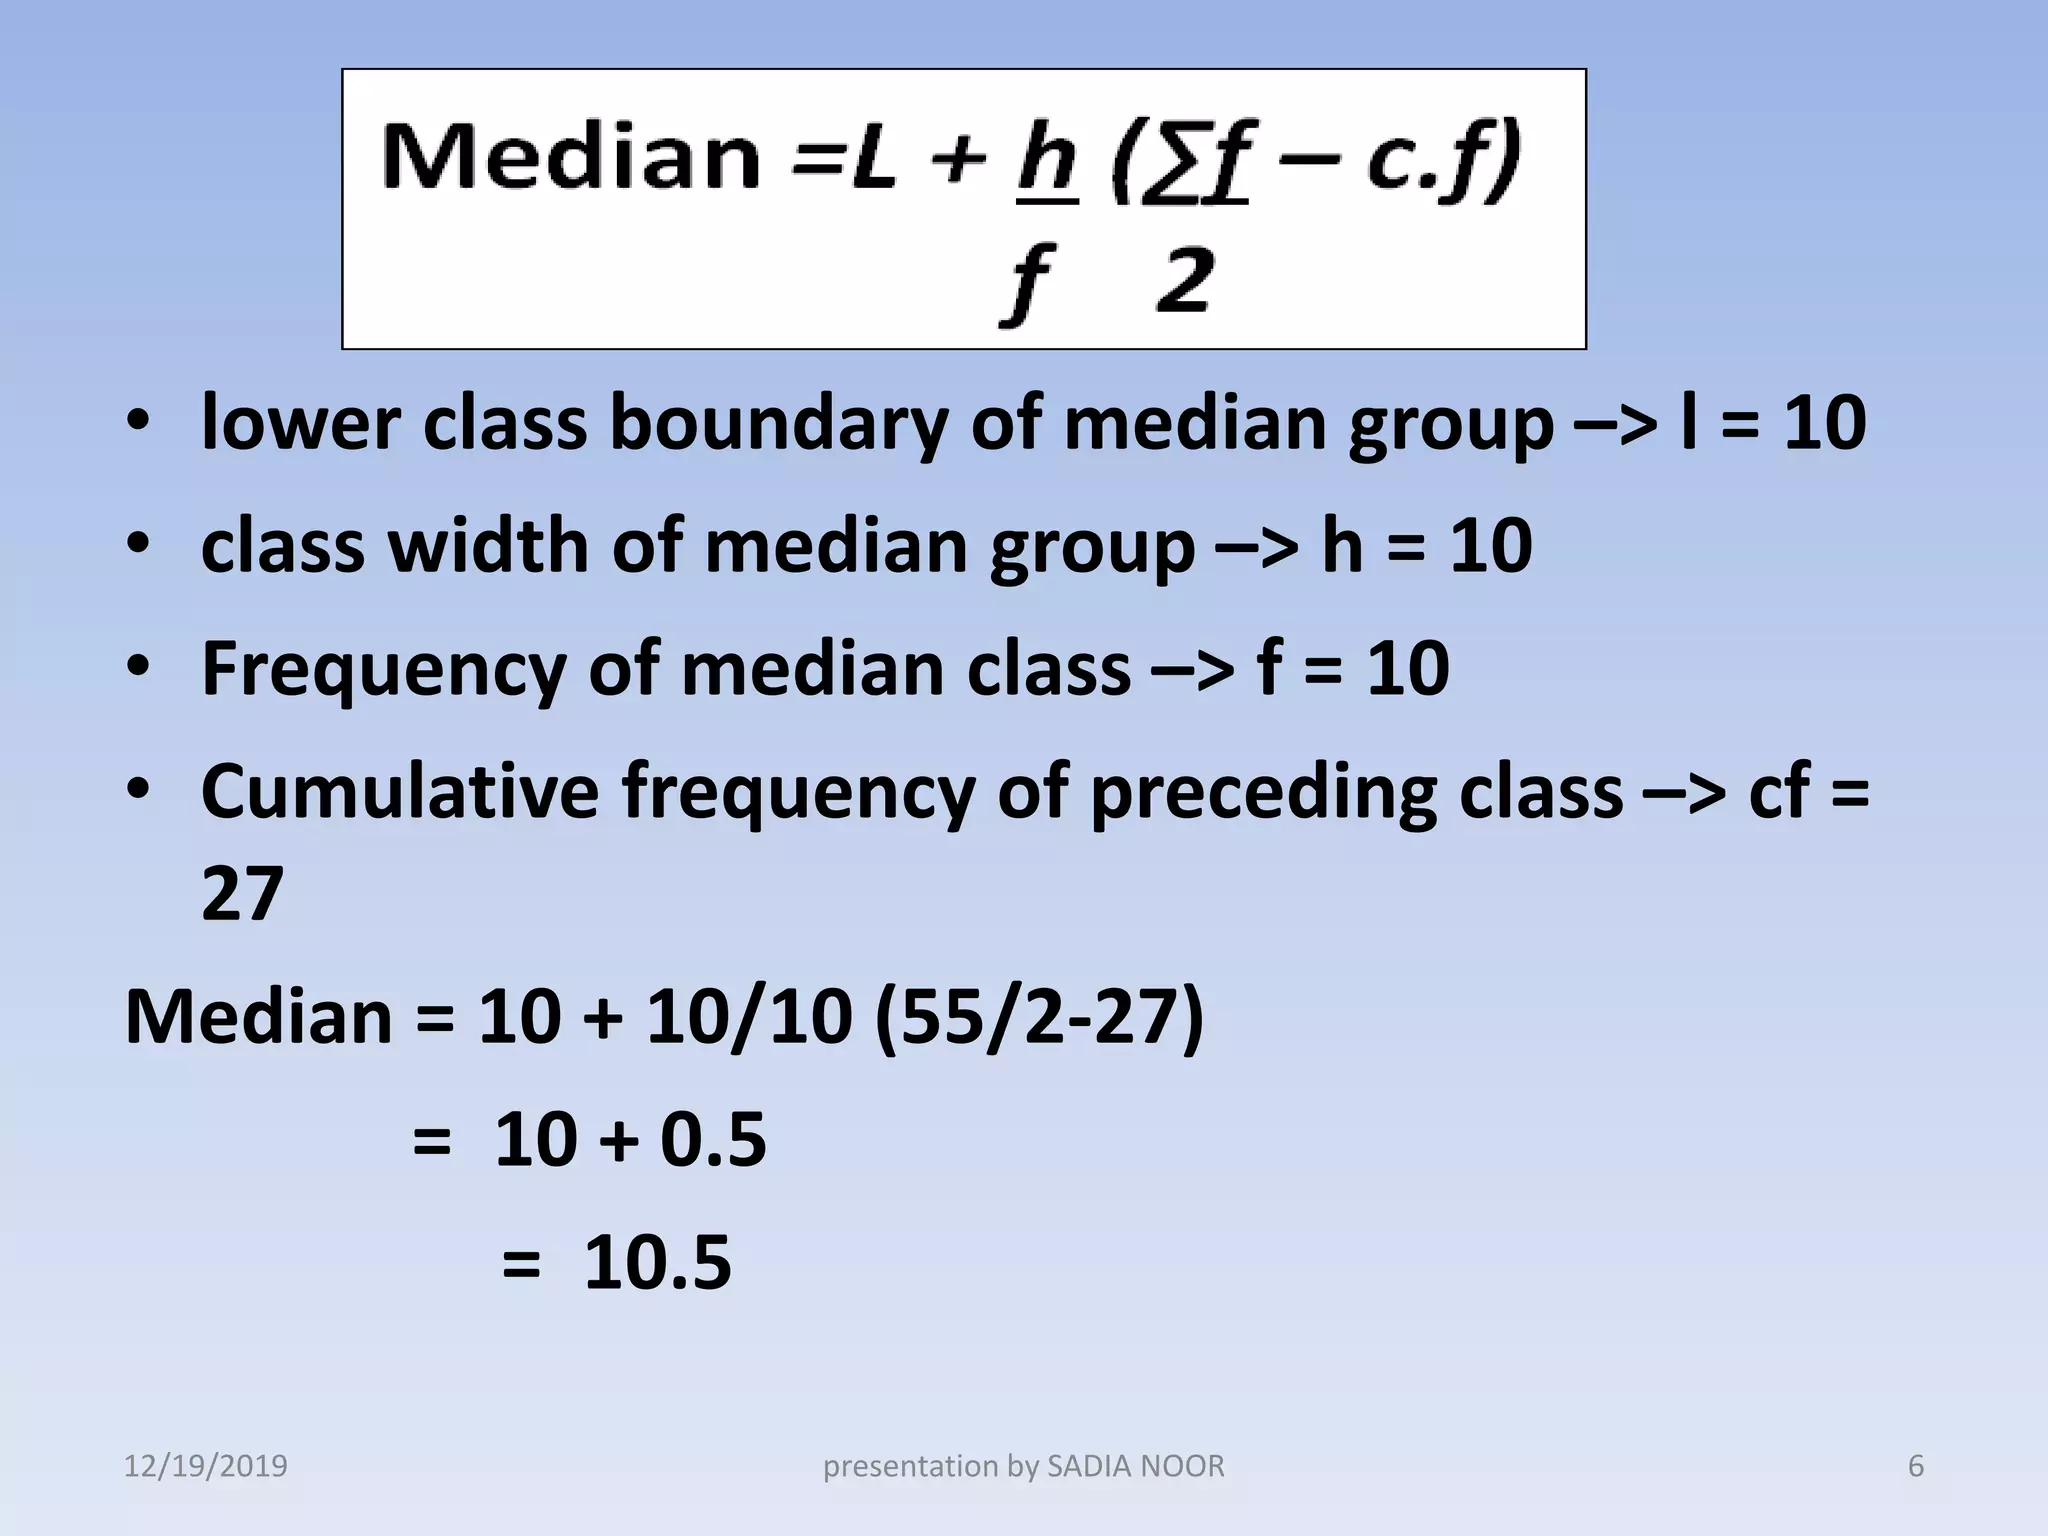
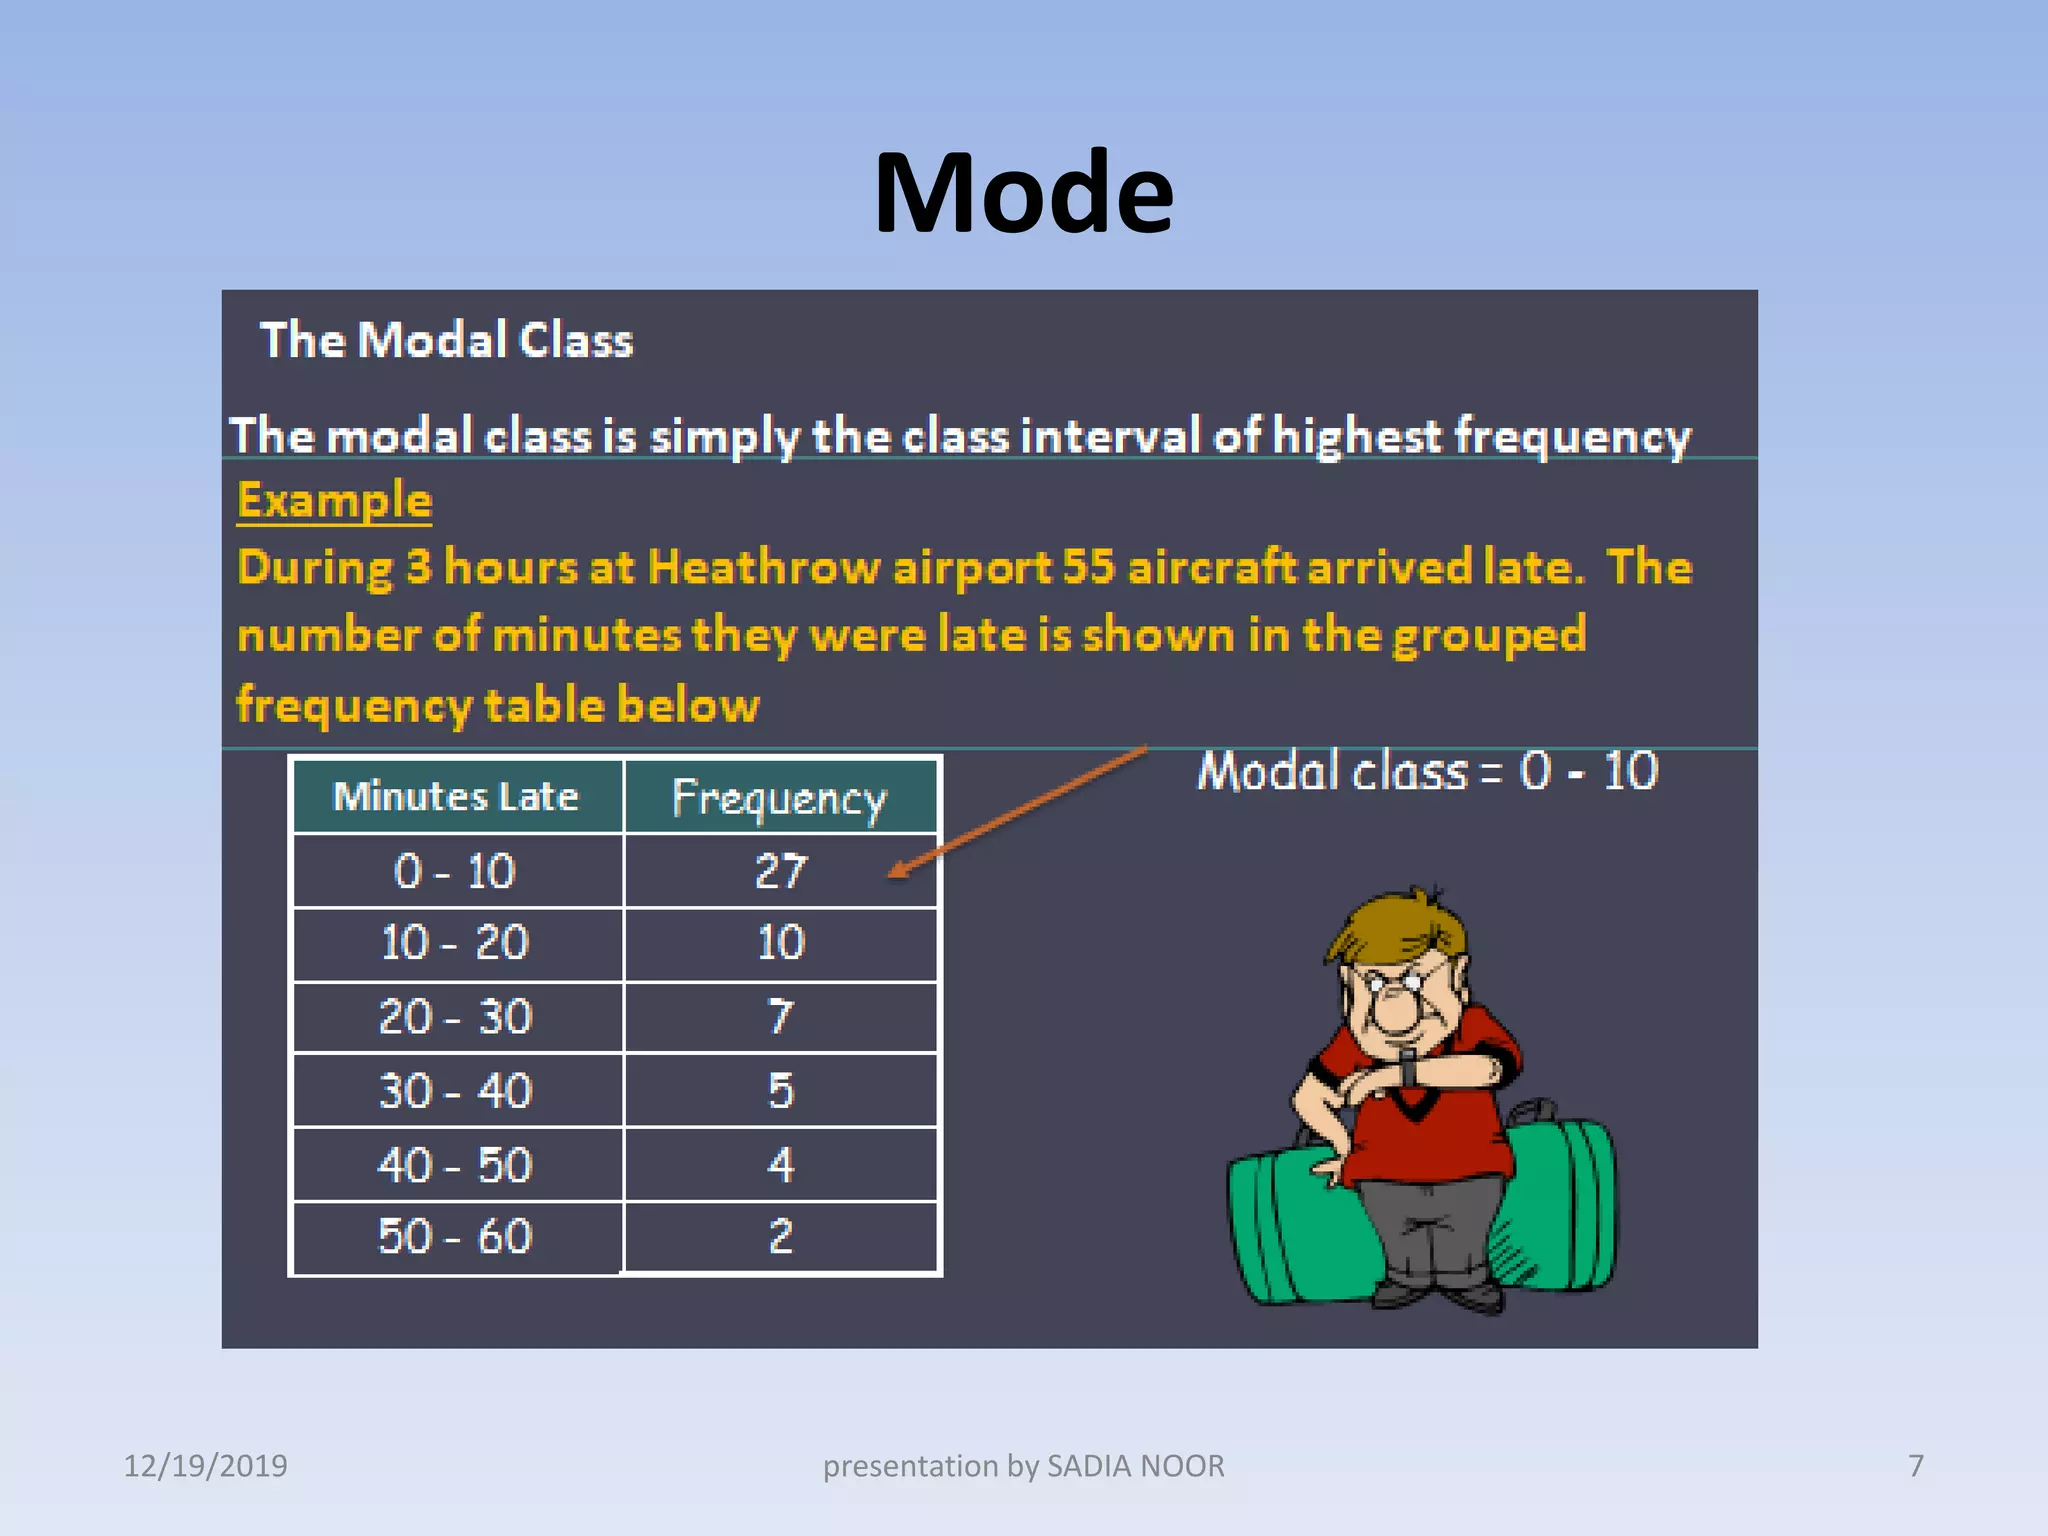
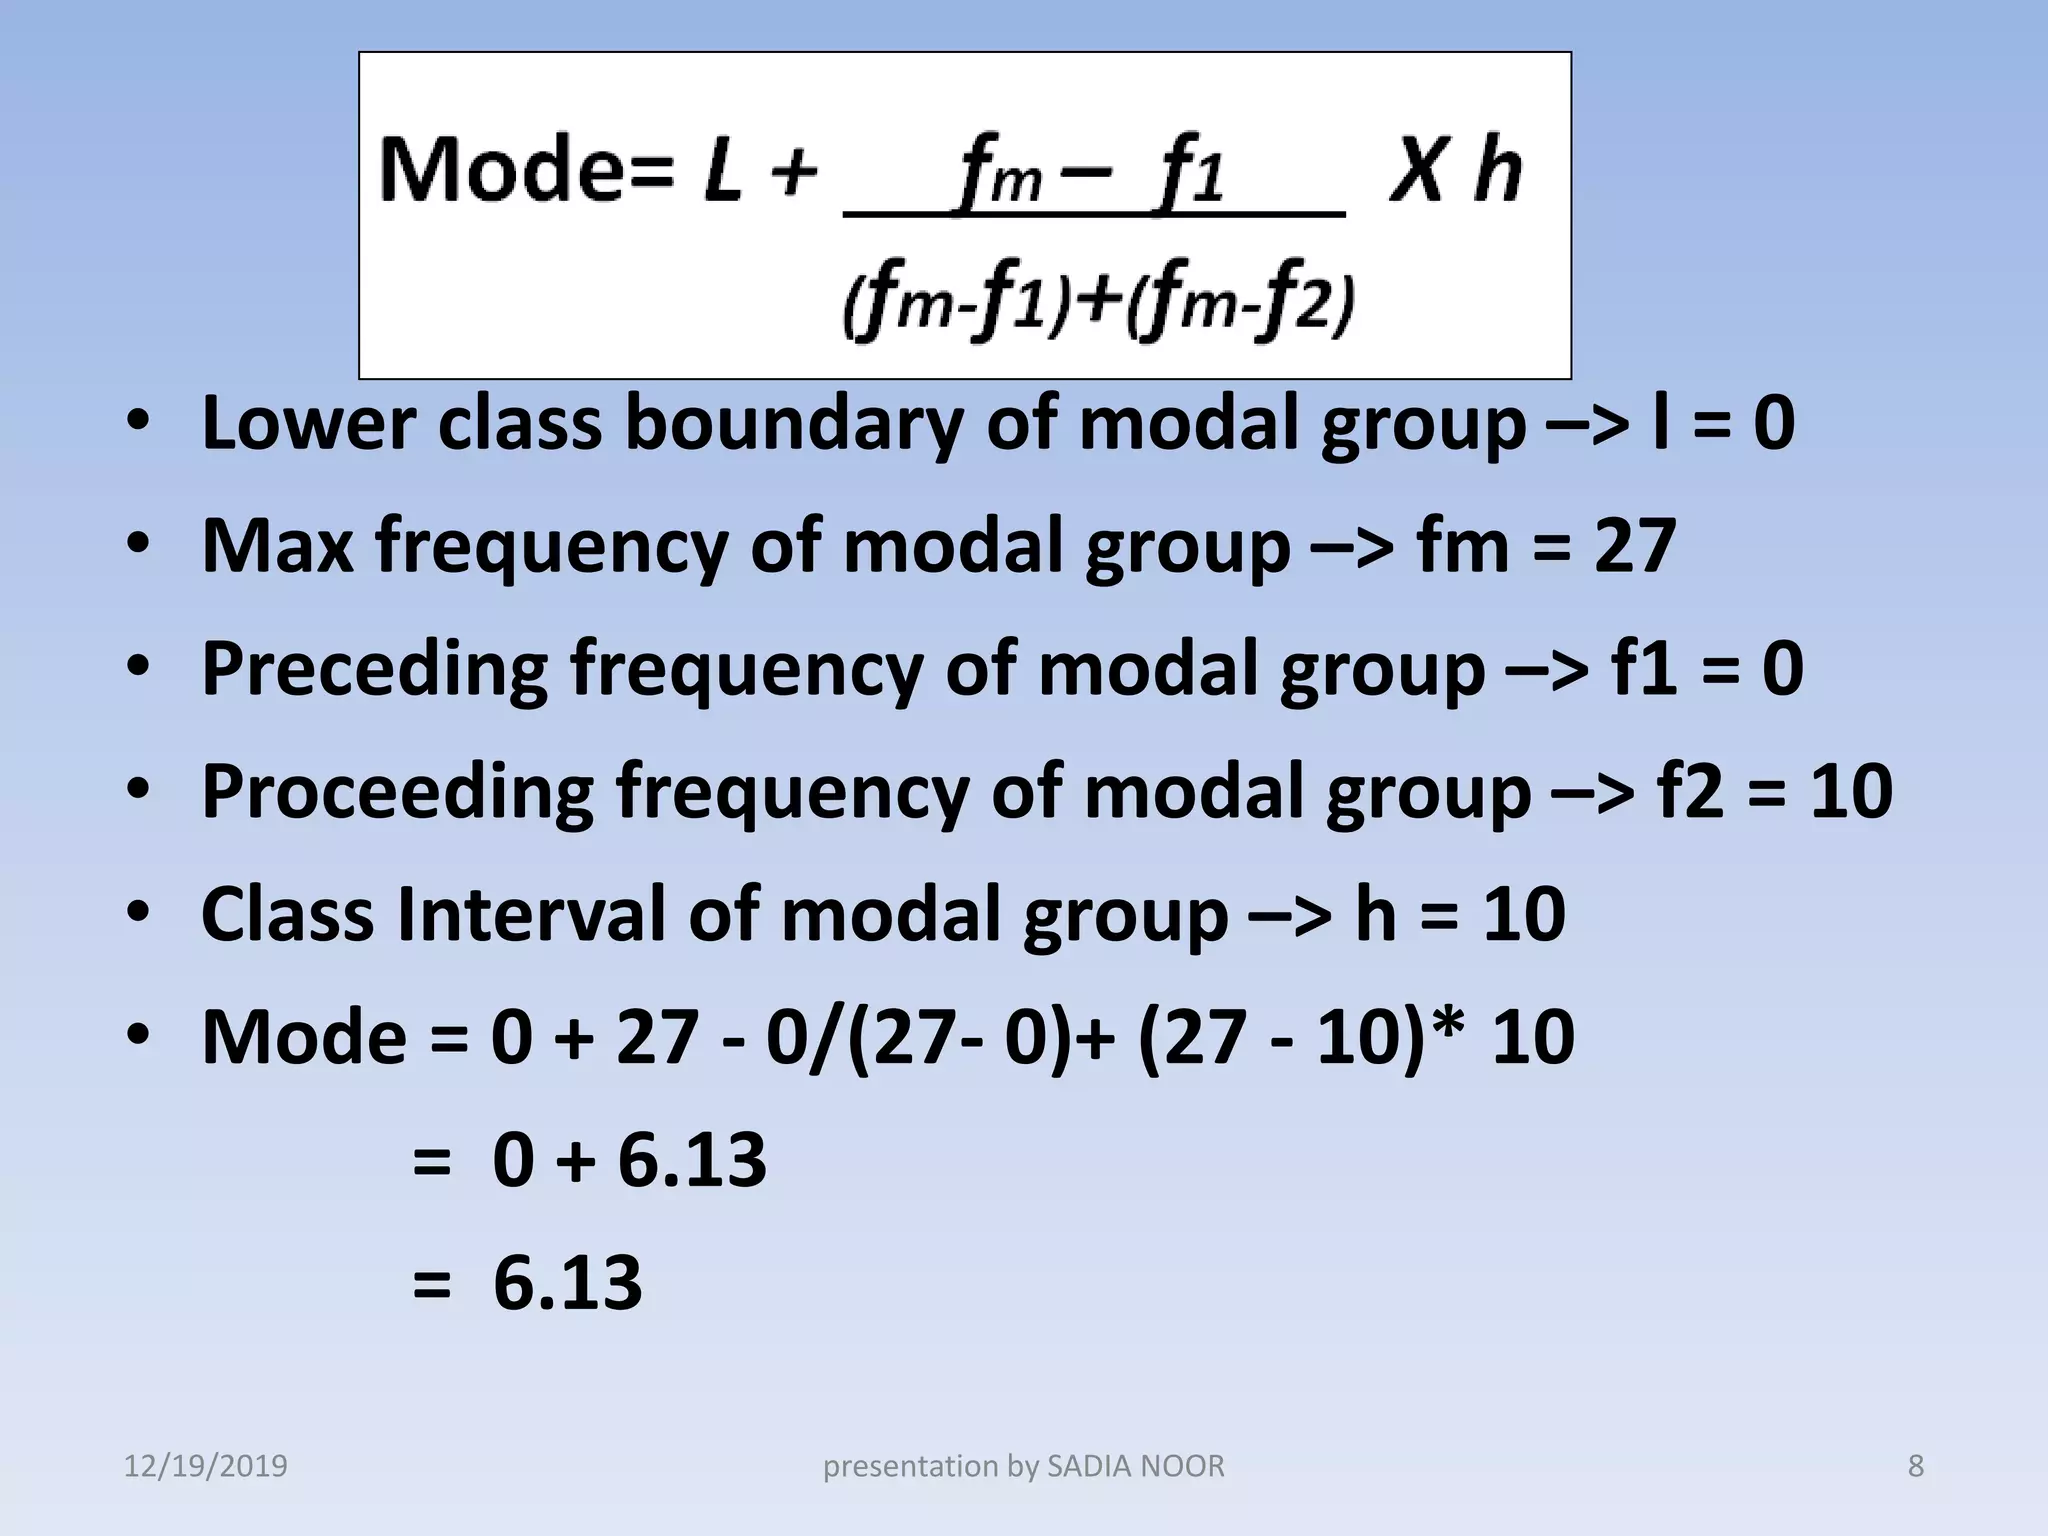
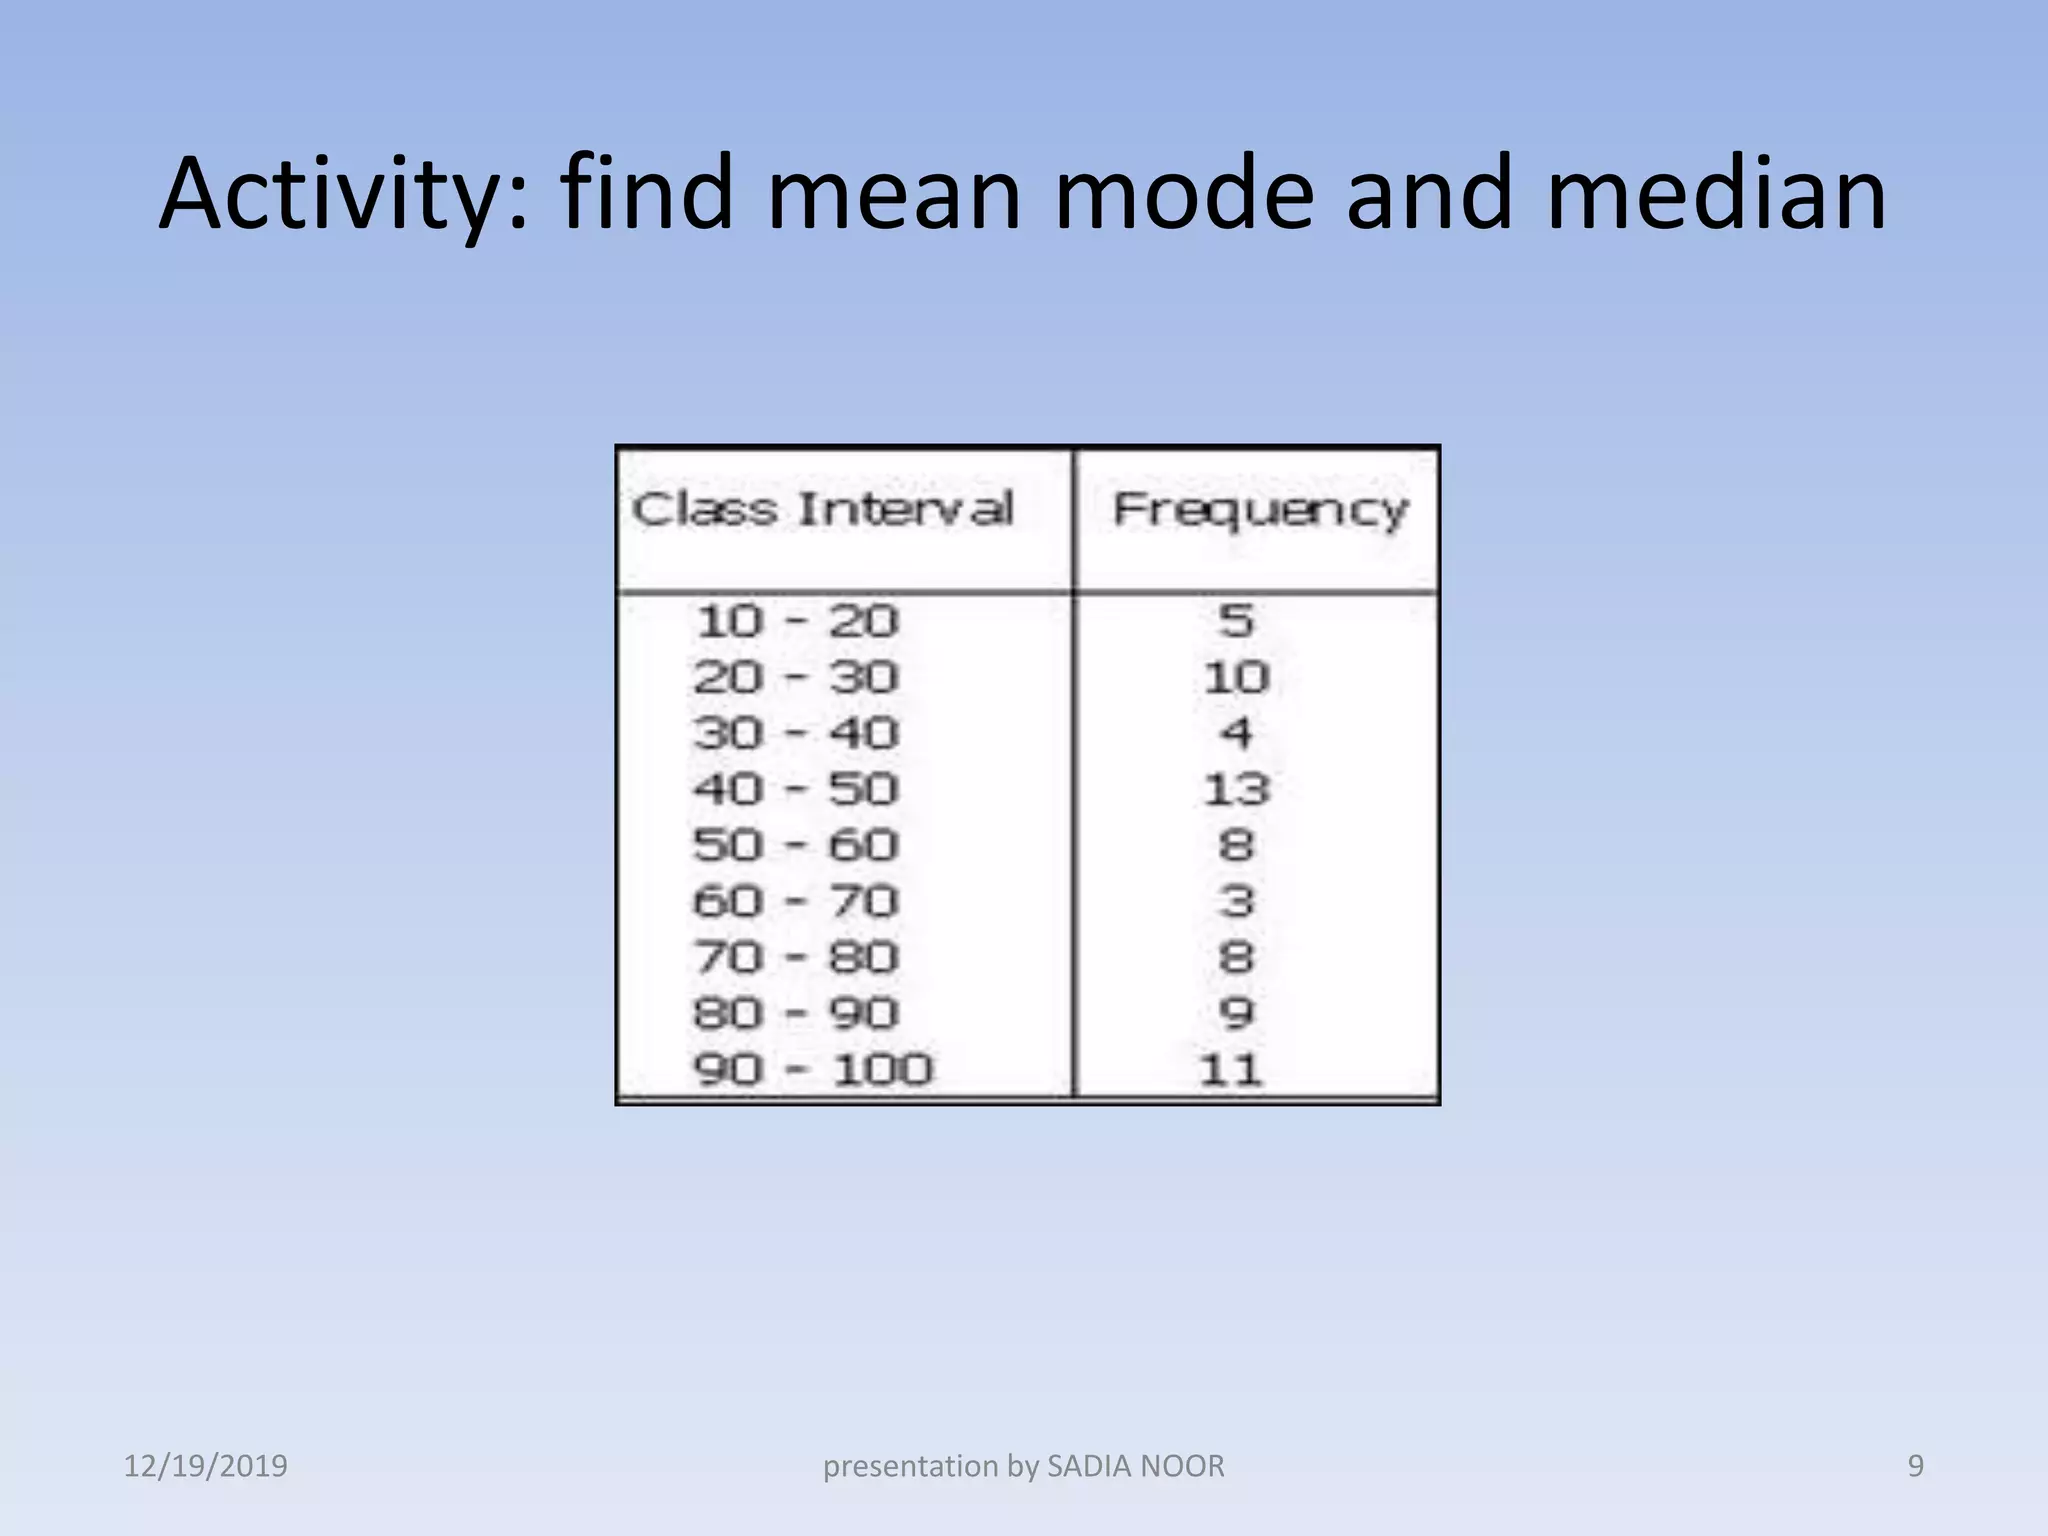
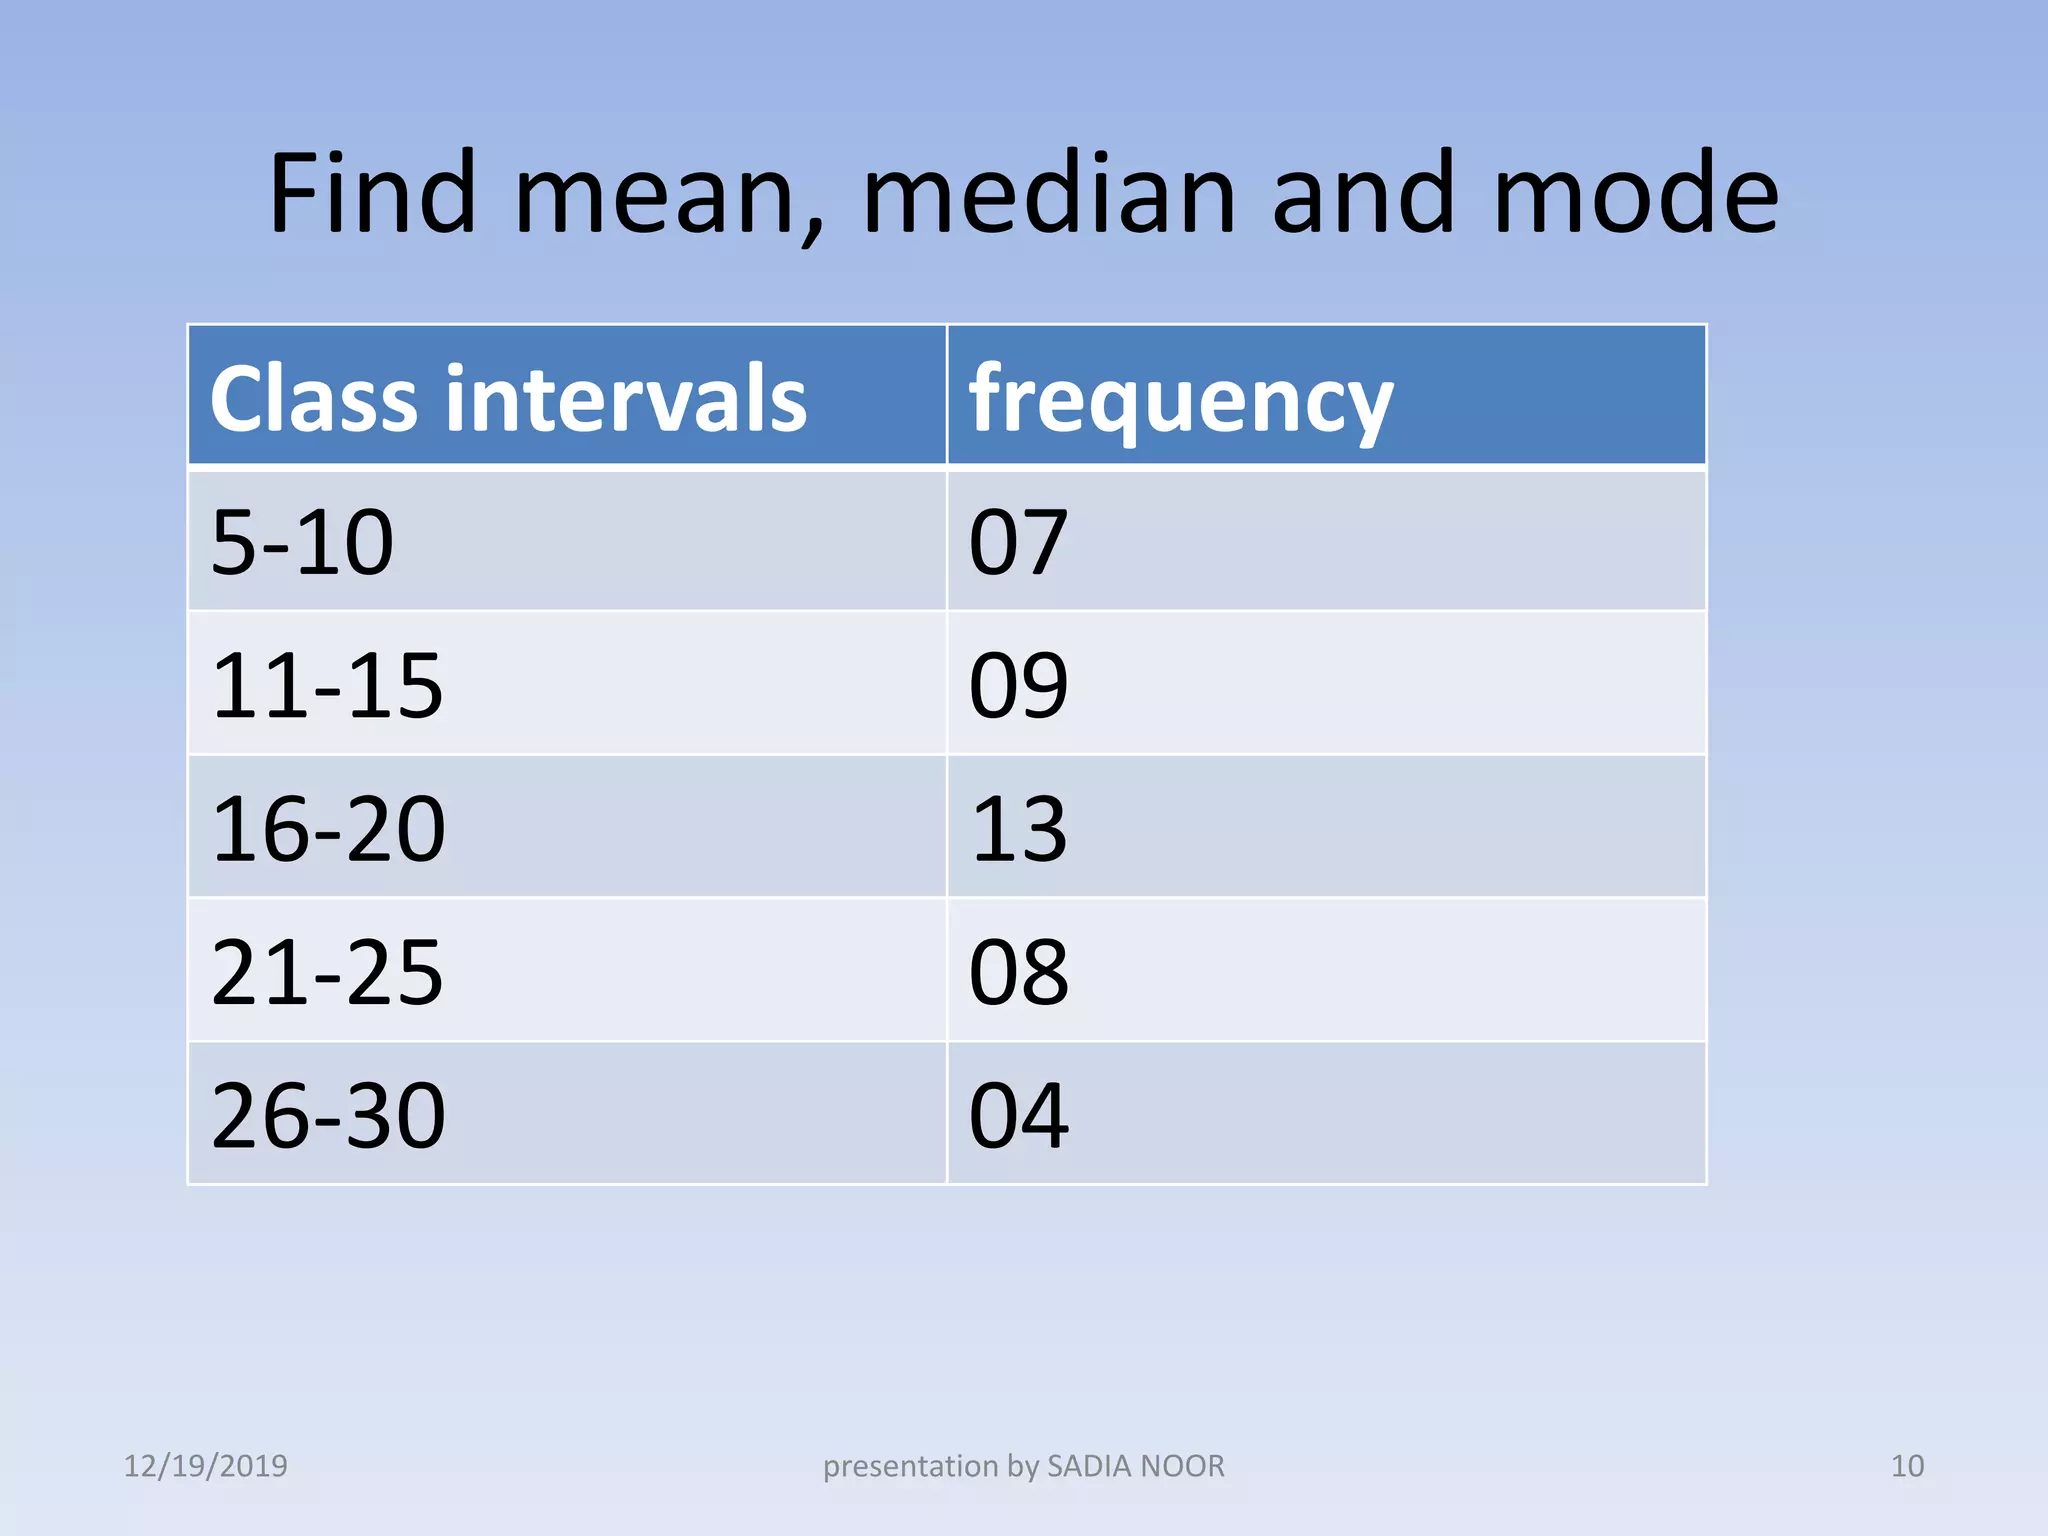
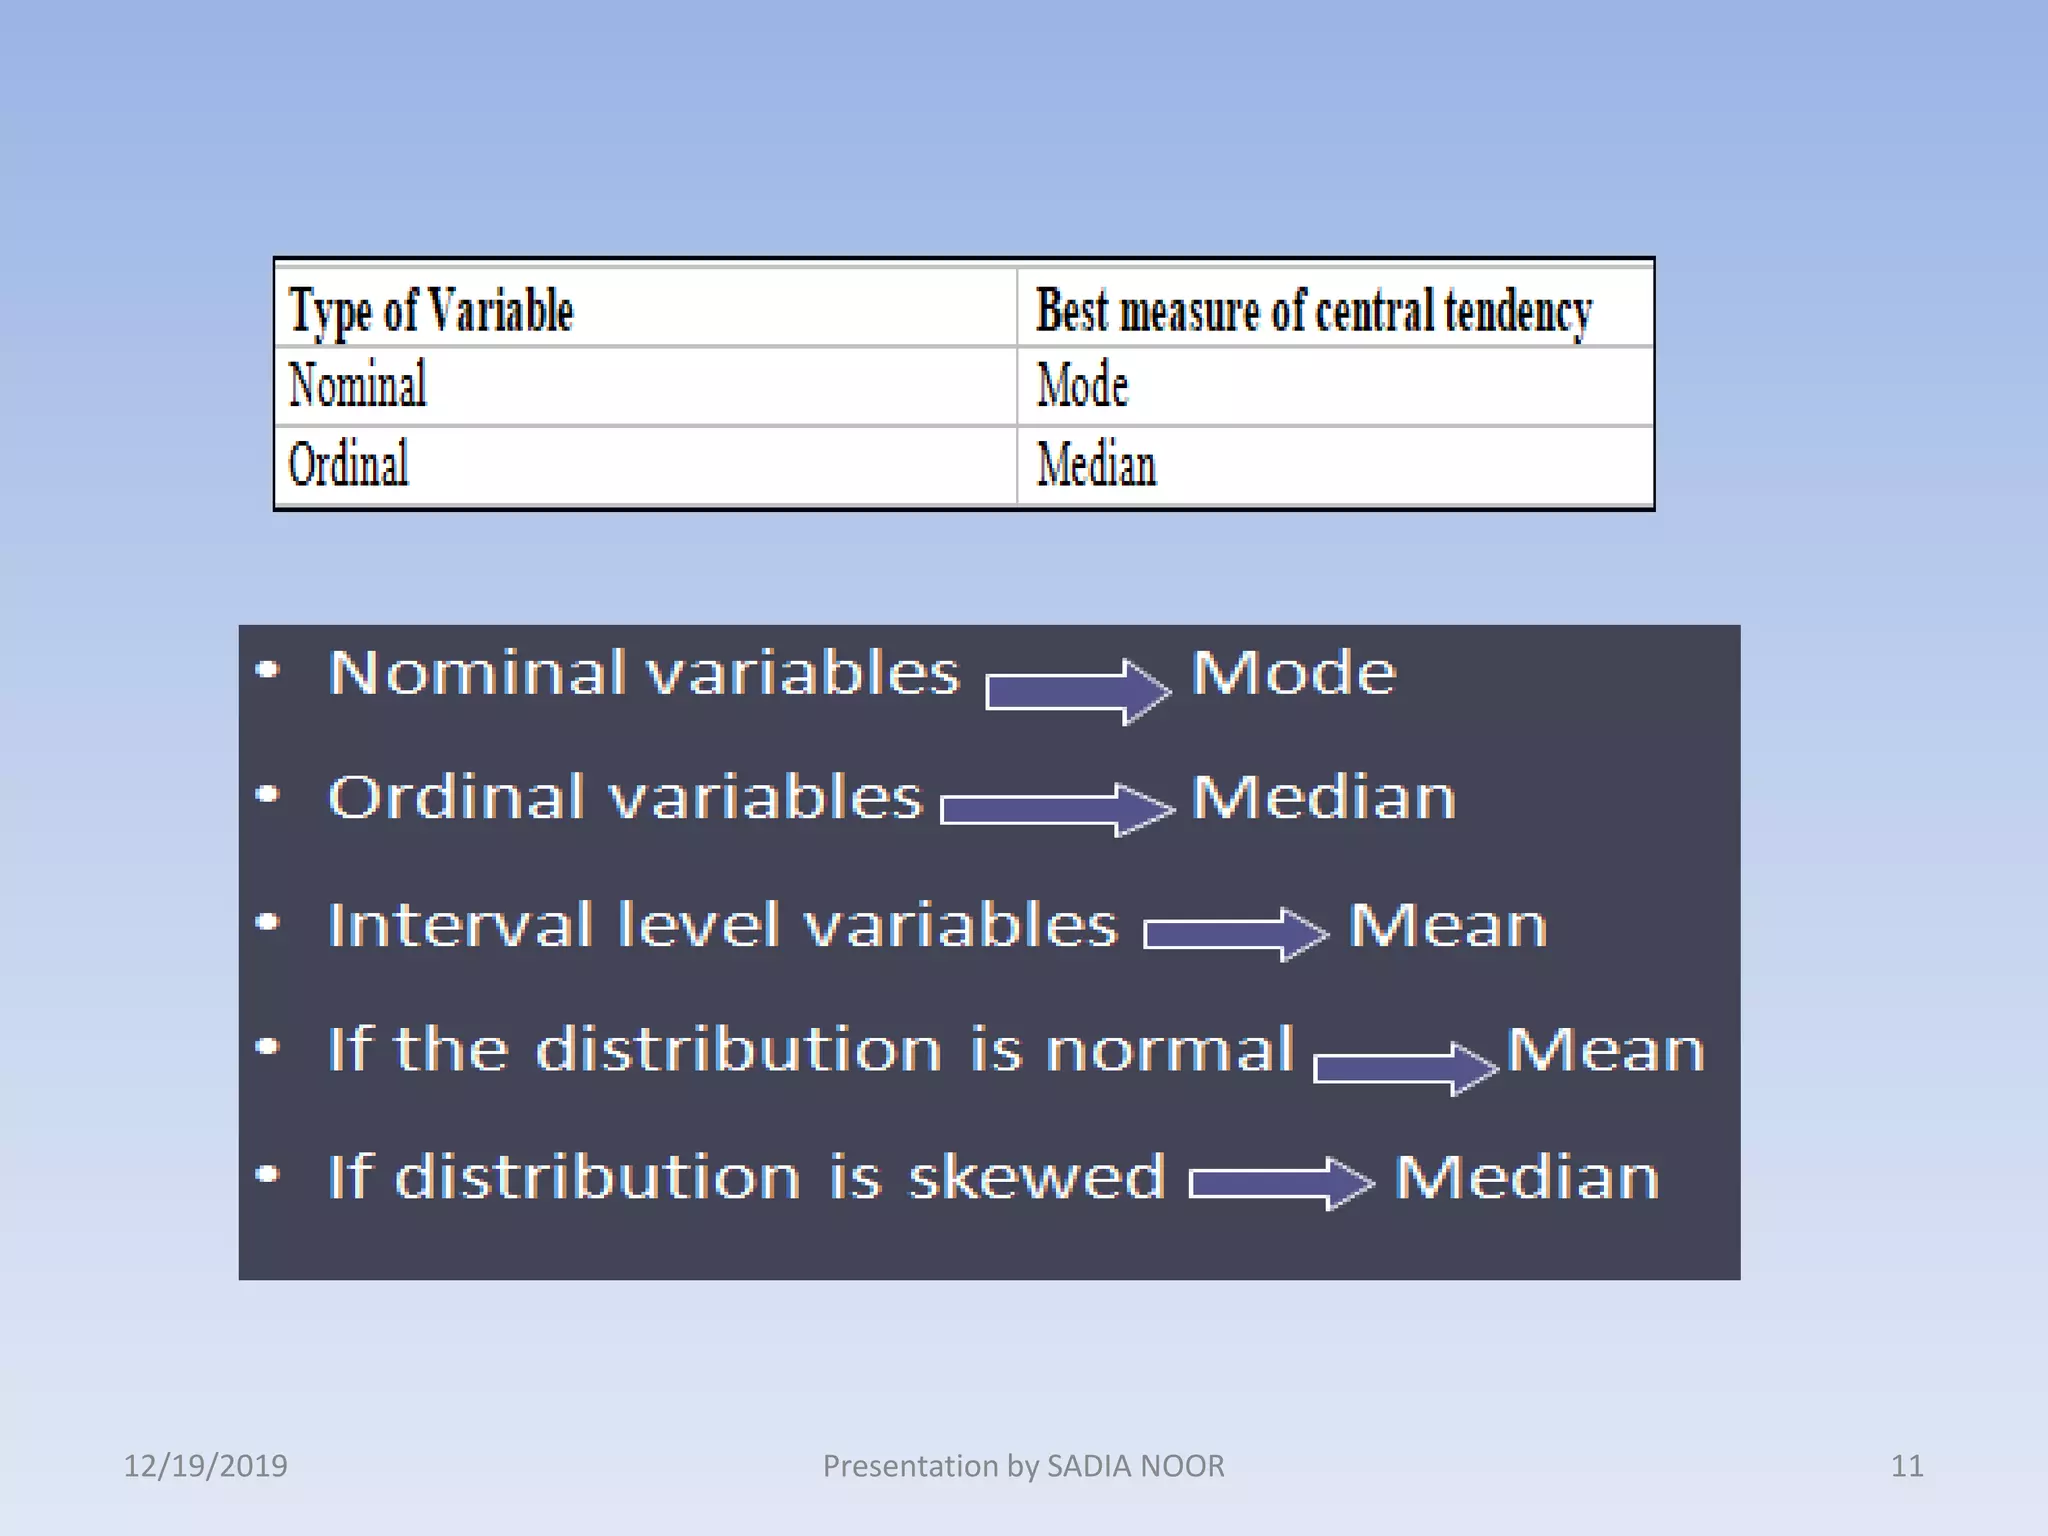
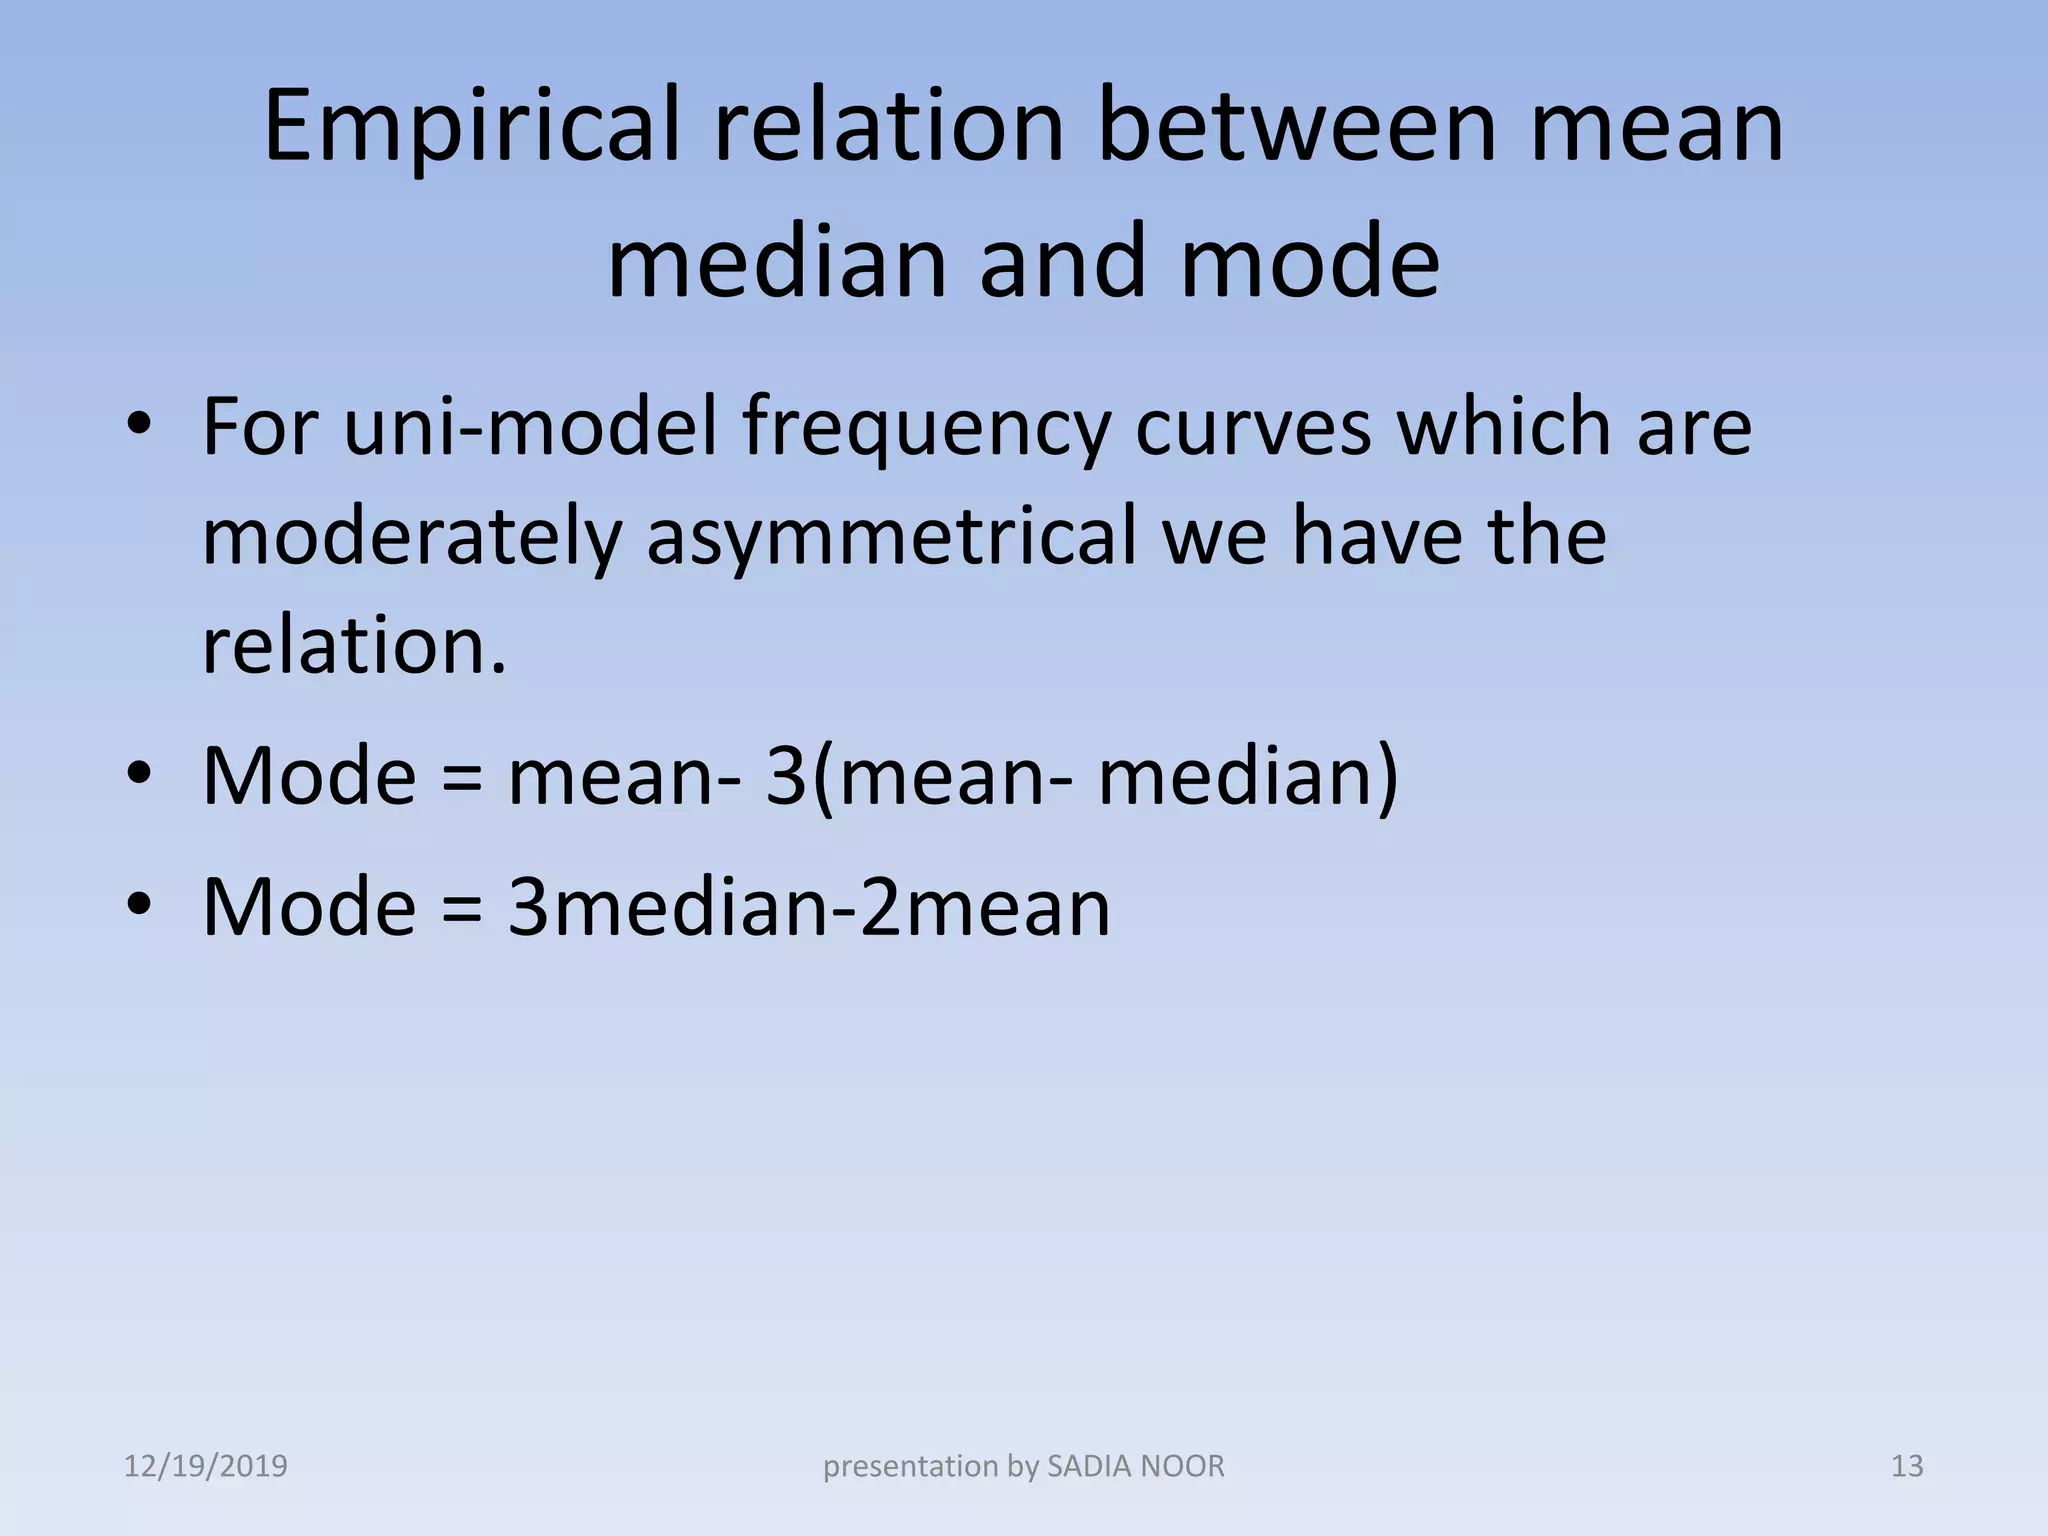
Measurement of central
tendency
Grouped data
12/19/2019 1presentation by SADIA NOOR
Arithmetic mean
• To find the mean of a frequency distribution
with grouped data, the product of the
frequency and the corresponding
observations (noted as fx) is calculated and
summed, that sum is then divided by the sum
of the frequency amounts.
• Mean = Ʃfx
Ʃf
12/19/2019 2presentation by SADIA NOOR
• Where, Ʃfx is the sum of the products of the frequency and
the corresponding observations And, Ʃf is the sum of the
frequencies.
• Example:
12/19/2019 3presentation by SADIA NOOR
12/19/2019 4presentation by SADIA NOOR
Median
12/19/2019 5presentation by SADIA NOOR
• lower class boundary of median group –> l = 10
• class width of median group –> h = 10
• Frequency of median class –> f = 10
• Cumulative frequency of preceding class –> cf =
27
Median = 10 + 10/10 (55/2-27)
= 10 + 0.5
= 10.5
12/19/2019 6presentation by SADIA NOOR
Mode
12/19/2019 7presentation by SADIA NOOR
• Lower class boundary of modal group –> l = 0
• Max frequency of modal group –> fm = 27
• Preceding frequency of modal group –> f1 = 0
• Proceeding frequency of modal group –> f2 = 10
• Class Interval of modal group –> h = 10
• Mode = 0 + 27 - 0/(27- 0)+ (27 - 10)* 10
= 0 + 6.13
= 6.13
12/19/2019 8presentation by SADIA NOOR
Activity: find mean mode and median
12/19/2019 9presentation by SADIA NOOR
Find mean, median and mode
Class intervals frequency
5-10 07
11-15 09
16-20 13
21-25 08
26-30 04
12/19/2019 10presentation by SADIA NOOR
12/19/2019 11Presentation by SADIA NOOR
Appropriate Measures of Central Tendency
• How well does the mean represent the scores in
a distribution?
• The logic here is to determine how much spread
is in the scores. How much do the scores
"deviate" from the mean? Think of the mean as
the true score or as your best guess. If every X
were very close to the Mean, the mean would be
a very good predictor.
• If the distribution is very sharply peaked then the
mean is a good measure of central tendency and
if you were to use the mean to make predictions
you would be right or close much of the time
12/19/2019 12Presentation by SADIA NOOR
Empirical relation between mean
median and mode
• For uni-model frequency curves which are
moderately asymmetrical we have the
relation.
• Mode = mean- 3(mean- median)
• Mode = 3median-2mean
12/19/2019 presentation by SADIA NOOR 13
12/19/2019 presentation by SADIA NOOR 14

Measurement of central tendency with group data

  • 1.
    Measurement of central tendency Groupeddata 12/19/2019 1presentation by SADIA NOOR
  • 2.
    Arithmetic mean • Tofind the mean of a frequency distribution with grouped data, the product of the frequency and the corresponding observations (noted as fx) is calculated and summed, that sum is then divided by the sum of the frequency amounts. • Mean = Ʃfx Ʃf 12/19/2019 2presentation by SADIA NOOR
  • 3.
    • Where, Ʃfxis the sum of the products of the frequency and the corresponding observations And, Ʃf is the sum of the frequencies. • Example: 12/19/2019 3presentation by SADIA NOOR
  • 4.
  • 5.
  • 6.
    • lower classboundary of median group –> l = 10 • class width of median group –> h = 10 • Frequency of median class –> f = 10 • Cumulative frequency of preceding class –> cf = 27 Median = 10 + 10/10 (55/2-27) = 10 + 0.5 = 10.5 12/19/2019 6presentation by SADIA NOOR
  • 7.
  • 8.
    • Lower classboundary of modal group –> l = 0 • Max frequency of modal group –> fm = 27 • Preceding frequency of modal group –> f1 = 0 • Proceeding frequency of modal group –> f2 = 10 • Class Interval of modal group –> h = 10 • Mode = 0 + 27 - 0/(27- 0)+ (27 - 10)* 10 = 0 + 6.13 = 6.13 12/19/2019 8presentation by SADIA NOOR
  • 9.
    Activity: find meanmode and median 12/19/2019 9presentation by SADIA NOOR
  • 10.
    Find mean, medianand mode Class intervals frequency 5-10 07 11-15 09 16-20 13 21-25 08 26-30 04 12/19/2019 10presentation by SADIA NOOR
  • 11.
  • 12.
    Appropriate Measures ofCentral Tendency • How well does the mean represent the scores in a distribution? • The logic here is to determine how much spread is in the scores. How much do the scores "deviate" from the mean? Think of the mean as the true score or as your best guess. If every X were very close to the Mean, the mean would be a very good predictor. • If the distribution is very sharply peaked then the mean is a good measure of central tendency and if you were to use the mean to make predictions you would be right or close much of the time 12/19/2019 12Presentation by SADIA NOOR
  • 13.
    Empirical relation betweenmean median and mode • For uni-model frequency curves which are moderately asymmetrical we have the relation. • Mode = mean- 3(mean- median) • Mode = 3median-2mean 12/19/2019 presentation by SADIA NOOR 13
  • 14.