This document provides an overview of three tools for creating visualizations: GraphViz, Prezi, and ManyEyes. It discusses using GraphViz to generate graphs from descriptions in its DOT language, creating nonlinear presentations in Prezi by connecting ideas on a canvas, and visualizing data sets uploaded to ManyEyes through interactive charts and graphs. Examples and instructions are provided for using each tool to explore visual literacy and representation.

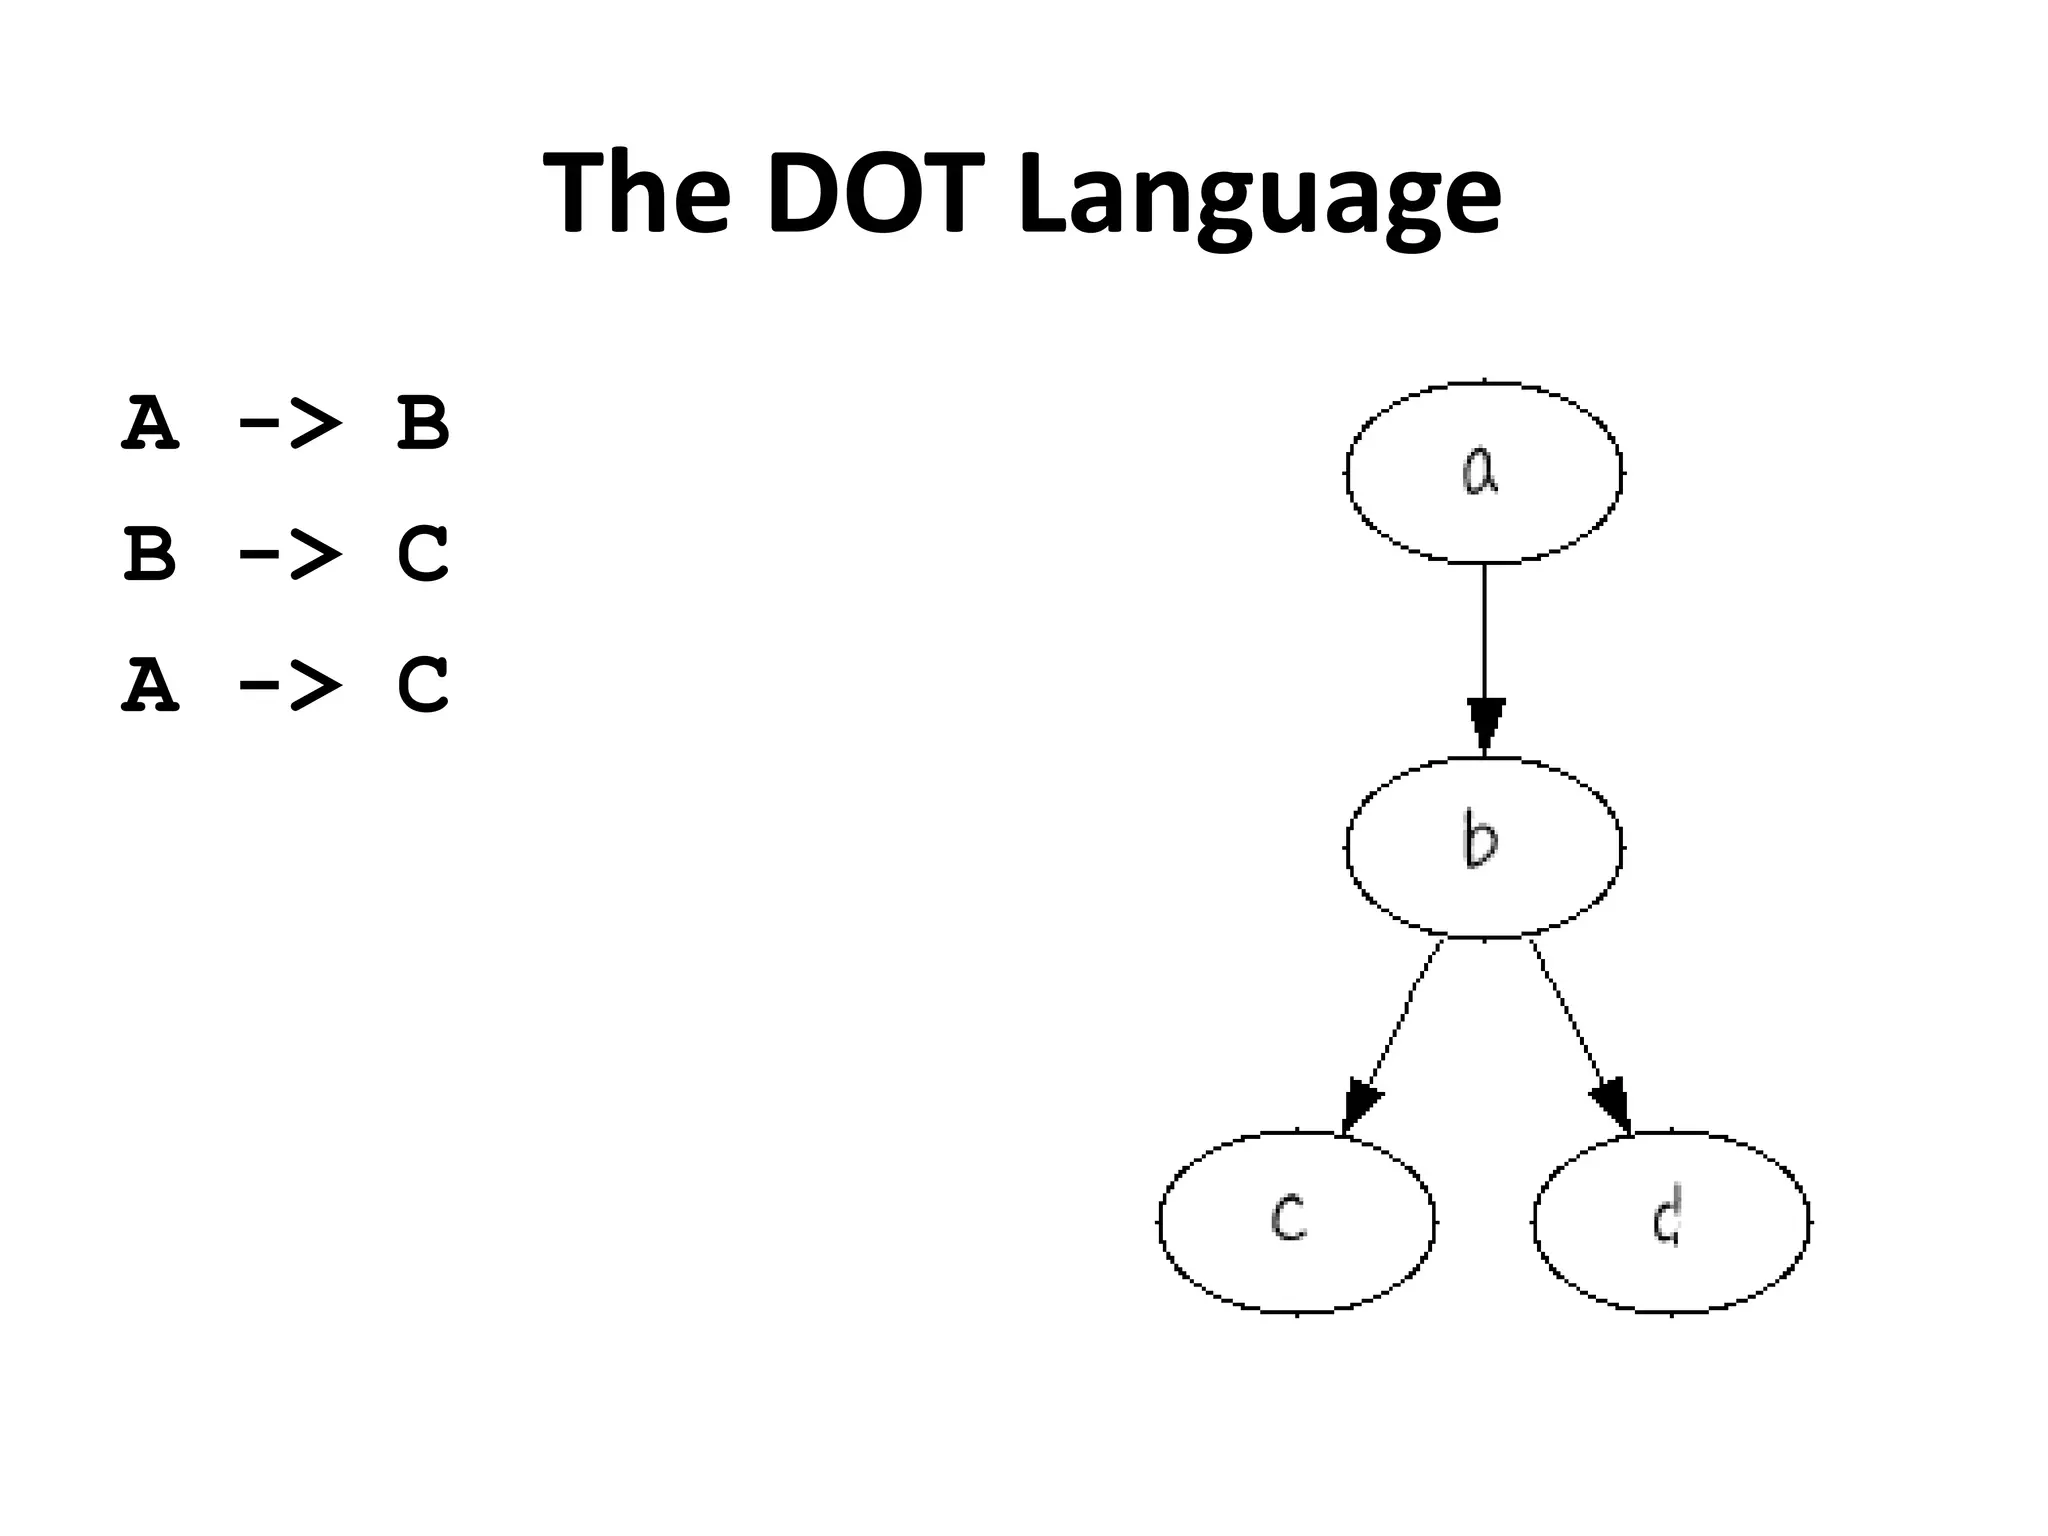
![The DOT Language
A [label='foo']
B [label='bar']
C [label='baz']
D [label='boo']
A -> B
B -> C
B -> D](https://image.slidesharecdn.com/mdst-f10-11-18-studio-12-101118184148-phpapp01/75/MDST-3703-F10-Studio-12-9-2048.jpg)
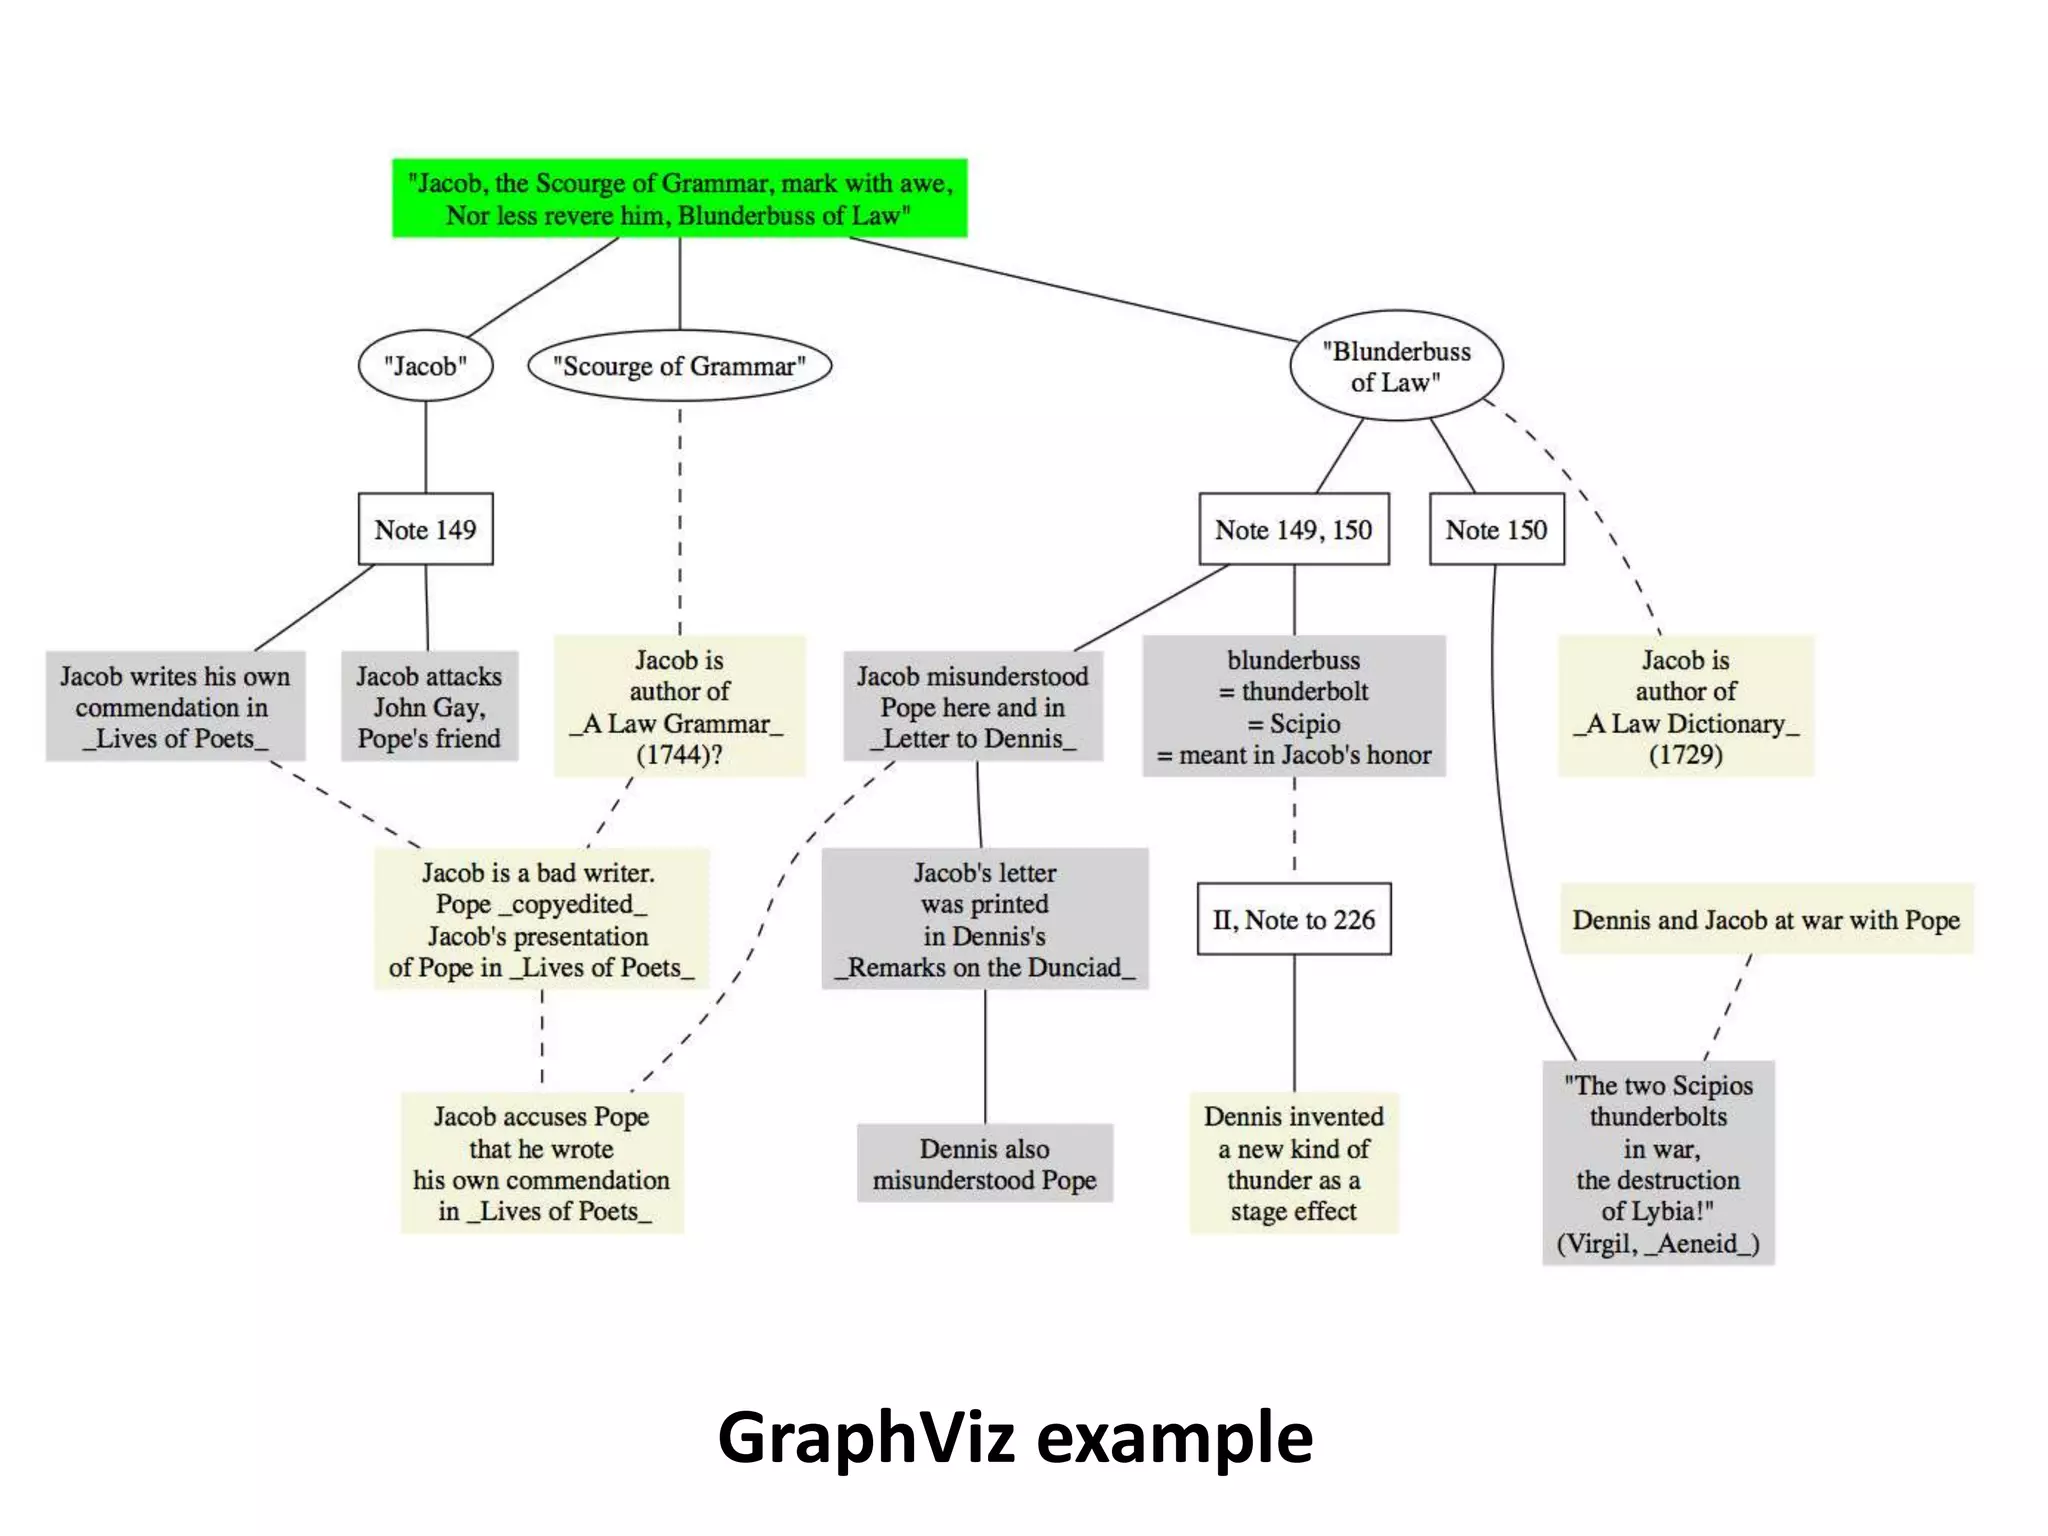
![The DOT language--Nodes
A [label=""Jacob, the Scourge of Grammar, mark
with awe,nNor less revere him, Blunderbuss of
Law"" style="filled" color="green"]
A1 [label=""Jacob"" group="A" shape="ellipse"]
A2 [label=""Blunderbussnof Law"" group="A"
shape="ellipse"]
A3 [label=""Scourge of Grammar"" group="A"
shape="ellipse"]
B [label="Note 149" shape="record"]
C [label="Note 149, 150" shape="record"]
D [shape="record" label="Note 150"]
E [shape="record" label="II, Note to 226"]](https://image.slidesharecdn.com/mdst-f10-11-18-studio-12-101118184148-phpapp01/75/MDST-3703-F10-Studio-12-12-2048.jpg)
![The DOT language--Edges
A -- {A1;A2;A3}
A1 -- B
A2 -- {C;D}
A2 -- I04 [style="dashed"]
B -- {B1;B2}
B1 -- B3 [style="dashed"]
I01 -- B3 [style="dashed"]
B3 -- I03 [style="dashed"]
I01 -- A3 [style="dashed"]
C -- {I02;I08}
I02 -- I03 [style="dashed"]
I02 -- I06
I06 -- I07
I05 -- I10 [style="dashed"]
I08 -- E [style="dashed"]
E -- I09
D -- I10](https://image.slidesharecdn.com/mdst-f10-11-18-studio-12-101118184148-phpapp01/75/MDST-3703-F10-Studio-12-13-2048.jpg)