Download to read offline
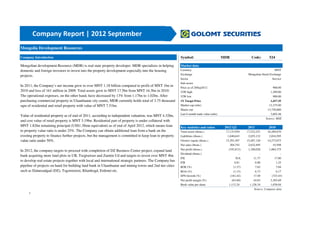


Mongolia Development Resources (MDR) is a real estate property developer in Mongolia that specializes in helping domestic and foreign investors invest in property development projects, especially housing. In 2011, MDR's net income grew to over 1.18 billion MNT compared to 1 billion MNT in 2010. Total assets also grew to 17.5 billion MNT. MDR currently holds 3.75 thousand square meters of residential and retail property valued at 7.51 billion MNT. In 2012, MDR targeted completing an ongoing project, expanding its land bank, and investing over 4 billion MNT to develop new real estate projects with local and international partners.


