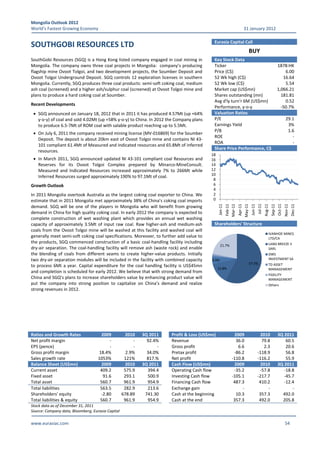
Mongolia Outlook 2012
World’s Fastest Growing Economy

31 January 2012

Copyright © 2012 Eurasia Capital Ltd.
All rights reserved. This report or any portion thereof
may not be reproduced or used in any manner whatsoever
without the express written permission of Eurasia Capital
except for the use of brief quotations.
Eurasia Capital Ltd.
th
Suite 65, 6 Floor, Grand Office Center
st
Jamiyangun Street 12, 1 Khoroo
Ulaanbaatar, Mongolia
www.eurasiac.com

www.eurasiac.com

1
Mongolia Outlook 2012
World’s Fastest Growing Economy

31 January 2012

CONTENTS

Summary...................................................................................................................................................3
2011 At a Glance.......................................................................................................................................4
Economy ...................................................................................................................................................7
The Year of Records......................................................................................... 7
Trade Exceeds US$11bn .................................................................................. 8
Robust FDI Inflows and M&A Activity .............................................................9
Expansive Fiscal Policy..................................................................................... 9
Inflation Contained by Tight Monetary Policy.................................................11
Politics.......................................................................................................................................................13
Parliamentary Elections................................................................................... 13
Global Economy........................................................................................................................................15
Commodities: Bullish Amid Modest Global Growth.................................................................................16
Mining.......................................................................................................................................................17
Banking .....................................................................................................................................................20
Asset Classes.............................................................................................................................................26
Local Equities: Second Best Performing Market Globally ...............................26
International Equities ...................................................................................... 33
Mongolian Tugrik ............................................................................................ 34
Fixed Income ................................................................................................... 36
Property........................................................................................................... 38
Private Equity .................................................................................................. 40
Infrastructure .................................................................................................. 42
Annex 1: 2011 M&A League table ............................................................................................................45
Annex 2: Silk Road Composite Index Companies......................................................................................46
Annex 3: Silk Road Hong Kong Index Companies .....................................................................................48
Annex 4: Silk Road Australia Index Companies.........................................................................................48
Annex 5: Silk Road Mongolia Index Companies........................................................................................49
Contacts....................................................................................................................................................80

www.eurasiac.com

2
Mongolia Outlook 2012
World’s Fastest Growing Economy

31 January 2012

SUMMARY
Mongolia continued its strong performance in 2011 in terms of the pace of economic growth,
equity market, exports and foreign direct investment inflows. The country’s performance in 2011
has exceeded nearly all our projections we made in our Mongolia Outlook 2011 report published in
January 2011. We estimate Mongolia overtook Qatar and has become the world’s fastest growing
economy in 20111. Investor sentiment and attractive valuations have supported the stock market
and ranked this frontier market as the second best equity market globally last year. Robust
international commodity prices and firm demand in China, the key market for Mongolian
commodities, have boosted exports to an all time high. Accelerated development of the Oyu
Tolgoi project and investor appetite for quality resource assets have attracted a record level of
foreign direct investments. We believe that Mongolia that is emerging as a key commodity supplier
in Asia will continue its stellar performance through 2012 and beyond.
We project Mongolia to experience astonishing 20% GDP growth this year, further solidifying its
undisputable position as the world’s fastest growing economy in 2012. Substantial increase in
exports (in particular, coal and iron ore), government spending, investments in major mining
projects, primarily in Oyu Tolgoi and rapid surge in consumer spending will be the key drivers of
the growth this year.
We remain bullish on MSE listed equities in 2012. We expect the Mongolian equities to benefit
from increased capital inflows and estimate the MSE TOP 20 Index to reach 28,000 by the end of
this year, or +30% gain for 2012. We favor small caps that will outperform the index due to high
growth of their businesses buoyed from low base effect and attractive valuations. We anticipate
more IPOs and secondary offerings of Mongolian companies, both domestically and
internationally, especially much anticipated jumbo IPO of Erdenes Tavan Tolgoi. Therefore, we
strongly recommend our clients to invest in the Mongolian local equities as the most effective way
to gain exposure to the Mongolian growth story.
We target the Silk Road Mongolia Index (SILKMN) that includes Mongolia focused internationally
and selected locally listed companies to reach 1,330 (+20% growth) in 2012, to be somewhat
weighed down by expected subdue share performance of Ivanhoe Mines, the largest component
of SILKMN index. SILKMN index finished 2011 poorly, down 27% due to negative investor
sentiments toward emerging/frontier markets, triggered by the EU debt crisis and risk aversion. As
a result, Mongolia related stocks have been unjustifiably oversold last year. We advise investors to
snap up the most beaten up stocks as the companies’ strong fundamentals and value of their
resource assets become more apparent.
Our key investment themes in 2012 are opportunities across asset classes local and international
equities, fixed income, private equity and real estate. Our top picks for the next 12 months among
local stocks are Tavan Tolgoi (coking coal), APU (beverages), Remicon (construction materials) and
Mongolia Development Resources (property). Mongolian Mining Corp. (coking coal), Prophecy
Coal (thermal coal, power), Entrée Gold (gold) and Erdene Resource Development (molybdenum,
coal) are our top picks among the SILMN index companies.

1

We assume that the economy of Qatar is estimated to have grown 15% in 2011, according to “Qatar Economic Outlook 2011
2012” report published by the General Secretariat of Development Planning of Qatar on October 1, 2011.

www.eurasiac.com

3
Mongolia Outlook 2012
World’s Fastest Growing Economy

31 January 2012

2011 AT A GLANCE
World’s fastest growing economy
Our call made in our “Mongolia Outlook 2011” published on January 11, 2011, for the
growth of the Mongolian economy played out as the Mongolian GDP grew 17.3% in real
terms last year (vs our 10% growth target) and is likely to have become the world’s fastest
growing economy outperforming Qatar (The General Secretariat for Development Planning
of Qatar projected a 15% growth rate in 2011). Record high exports, investments,
government spending and consumption have transformed the domestic economy and
driven the growth.
Second best equity market globally
As we estimated in January last year the Mongolian stock exchange has maintained the top
two best equity market globally in 2011 with an impressive growth of 32.6% in US$ terms
(compared to Iraq Stock Exchange +35%). After being the best in 2010, MSE benefitted from
improved investor sentiment and attractive valuations last year.
Beating record FDI
Foreign direct investments (FDI) hit a record level of US$3.8bn last year as we estimated.
The ongoing Oyu Tolgoi, operating key coal and other mineral projects and exploration stage
mines have attracted substantial capital amid robust demand in China and untapped
potential in the resource rich country. Mongolia also saw robust M&A activity with most of
the deals being struck in the mining sector. We estimate that M&A deal values amounted to
over US$2bn.
Foreign trade all time high
In 2011, the Mongolian foreign trade surpassed its historical high set a year earlier, in line
with our projections. Total trade turnover surged 85.1% y o y to US$11.3bn. Exports
registered back to back record years growing 64.4% y o y to US$4.8bn in 2011 thanks to
high international prices for key export commodities and physical volume expansion. China
remained the biggest trading partner of Mongolia accounting for 56.7% of total trade,
including 92.1% of exports and 30.8% of imports. Coal production exceeded 30Mt and
exports 21Mt in 2011 that enabled Mongolia to overtake Australia as the biggest coking coal
supplier to China. Moreover, China surpassed Russia in terms of selling more goods and
services to Mongolia and became largest importer to the country.
Government spending feeding expansion
The economy experienced record fiscal expansion in 2011. General government expenditure
surged 55.6% y o y to US$3.8bn. The budget performed extremely well for most of 2011
registering around 3% surplus at the end of 3Q2011. State budget flipped into US$310mn or
3.6% of GDP deficit at the end of the year with increased government expenditure,
particularly capital spending and government consumption. Capital spending jumped 80.6%
y o y to US$843.3mn. A 23.6% increase in public sector salaries and wages and 59.3% rise in
subsidies and transfers, including almost 150% jump in social cash transfers supported
strong private sector consumption.

www.eurasiac.com

4
Mongolia Outlook 2012
World’s Fastest Growing Economy

31 January 2012

Long term bullish on MNT
Our call made on January 31, 2011 that the MNT may repeat global outperformance and
continue appreciating another 10% in 2011 played out well in 1H2011. However, in 2H2011,
MNT weakened on the back of the heightened global market volatility. The currency
strengthened 5% to MNT1,195 per US$ through April 1 after which it has weakened 16.8%
by end 2011 to MNT1,396 amid expanding current account deficit to US$2.4bn (end 2011)
fuelled primarily by more than expected increase in imports of capital goods for mining
projects.
Booming banking sector
Mongolian banking sector expanded a record rate of 50.1% y o y in assets to MNT9,372bn
(US$6.7bn), compared with 41.2% in 2010 (assets to GDP ratio reached to the new high of
86.5%). Deposits surged 40% y o y last year as individuals and business entities as well as
international institutions, which benefitted from significant increase in disposable income
and sought portfolio diversification viewed the strength of the local currency MNT and high
interest rates as a good investment.
A year active with RTOs
In 2011 mining IPOs were not as dynamic as in 2010. There was only one full fledged IPO on
ASX by FeOre Ltd (FEO:AU), a Mongolia focused iron ore explorer, who raised A$35mn. In
2011 several companies came to the market through reverse takeover (RTO) of Mongolian
assets (exploration licences). These companies, Draig Resources Ltd. (former C@ Ltd),
Modun Resources Ltd. (former TVN Corp. Ltd), UTMI (former Wedge Energy International
Inc.), Mongolian Resources Corp. Ltd (former Alamar Resources Ltd) and Kincora Copper Ltd.
(former Brazilian Diamonds Ltd.), are currently trading on stock exchanges in Australia and
Canada.
Erdenes Tavan Tolgoi IPO delayed
Much anticipated IPO of Erdenes Tavan Tolgoi, the state owned enterprise that holds the
mining licence for the world’s largest untapped coking coal mine, didn’t take place in 2011
as it was expected. Early in July, the Government announced that it has selected China’s
Shenhua Energy Company, U.S. Peabody Energy Corp. and Russian Mongolian consortium to
develop the Western Tsankhi area of the Tavan Tolgoi mine. However, due to the public
pressure and dissatisfaction among the bidders over the selection process as well as refusal
by the National Security Council the Government had to backtrack on the deal. Later the
Government resumed negotiations with all bidders and announced that Erdenes Tavan
Tolgoi may raise more than US$3bn in IPO on the Mongolian and London Stock Exchanges by
July 2012.
Strengthening political ties
2011 was a successful year in the political life of Mongolia. The resource rich country signed
a Strategic Partnership Agreement with China in June 2011. We expect the agreement to
expand cooperation and bolster economic ties, and add further impetus to Chinese
investments into and exports from Mongolia. As a result of bilateral visits of the state
leaders, Mongolia and South Korea agreed to elevate relations to a “Comprehensive
Partnership” status that seeks to expand cooperation in resource and infrastructure
www.eurasiac.com

5
Mongolia Outlook 2012
World’s Fastest Growing Economy

31 January 2012

development. As a landlocked country, Mongolia puts emphasis on developing balanced
relations with its two large neighbours and countries beyond or “third neighbours” through
high level official visits by President and Prime Minister of Mongolia to USA, Australia, Italy
and the Middle East countries.

www.eurasiac.com

6
Mongolia Outlook 2012
World’s Fastest Growing Economy

31 January 2012

ECONOMY
The Year of Records
We estimate Mongolia was the world’s fastest
growing economy in 2011. It registered record
real GDP growth of 17.3% y o y and hit our 10%
projection made in January last year. Growth was
supported by record investments, exports and
government spending.

GDP Performance
14

25

12

20

10

15

8
10
6

Foreign direct investments (FDI), exports and
5
industrial output were driven by insatiable
4
Chinese demand for commodities. FDI reached
0
2
historical high US$3.8bn in 2011, a huge boon to
0
5
US$6.2bn (Y2010) Mongolian economy. In our
2007
2008
2009
2010
2011 2012F
estimate, over 80% of FDI went into mining.
GDP, US$bn (LHS)
Real GDP growth, % (RHS)
Mongolian exports registered back to back record
years with exports reaching US$4.8bn in 2011. Source: National Statistics Office of Mongolia (NSOM), IMF, Eurasia
Exports grew 64.4% y o y thanks to high Capital
international prices for key export commodities
and physical volume expansion. Industrial output increased 9.7% y o y, including 9.5% in
mining and 11.6% in manufacturing. Coal production exceeded 30Mt rising 22.6% y o y in
2011. Iron ore output nearly doubled reaching 5.7Mt from 3.20Mt in 2010. Crude oil output
rose 16.8% to 2.55MMbbl. Manufacturing expanded 11.6% y o y in 2011 with major
industries such as food and beverages growing 10.5%, production of non metallic mineral
products 40.5% and small 1.7% y o y advance in textiles.
Expansive fiscal policy supported impressive GDP growth in 2011. Total government
expenditure increased 55.6% y o y to record US$3.79bn. Capital spending surged 80.6% to
US$843.3mn. Increases in public sector salaries led to 23.6% growth in government
spending on salaries and wages. Private consumption was supported by 59.3% y o y
increase in social cash transfers and subsidies. Albeit significant increase in government
spending, state budget deficit remained small at about US$310mn or 3.6% of GDP. The
deficit is much smaller than initially budgeted 9.9% of GDP. The state coffers were boosted
by high price of mineral exports with mining sector accounting for about one third of
government revenue. Tight monetary policy kept inflation in check at 10.2%. Significant
depreciation of the national currency in the second half of 2011 alleviated risks of mining
crowding out other industries in the economy. Cheaper currency is allowing time to other
industries to adapt to rapid structural changes in the economy. Meanwhile, the Bank of
Mongolia maintains record US$2.5bn hard currency reserves to fight any sudden swing in
exchange rate in either direction. Overall, macroeconomic fundamentals of Mongolia have
probably never been better.
We project Mongolia to experience astonishing 20% GDP growth this year, further
solidifying its undisputable position as the world’s fastest growing economy in 2012.
www.eurasiac.com

7
Mongolia Outlook 2012
World’s Fastest Growing Economy

31 January 2012

Substantial increase in exports (in particular, coal and iron ore), government spending,
investments in major mining projects, primarily in Oyu Tolgoi and rapid surge in consumer
spending will be the key drivers of the growth this year.

Trade Exceeds US$11bn
In 2011, Mongolian foreign trade surpassed its historical highs set in the previous year, in
line with our projections. Robust international commodity prices and firm demand in China,
the key market for Mongolian commodities, have boosted exports to an all time high.
Total trade turnover surged 85.1% y o y to US$11.3bn. China remained the biggest trading
partner of Mongolia accounting for 56.7% of its total trade, including 92.1% of exports and
30.8% of imports. Last year China overtook Russia as Mongolia’s largest imports market.
China remains vastly the largest export market for Mongolian goods. It primarily buys
natural resources from Mongolia. Its demand for commodities fuelled 64.4% y o y growth in
Mongolian exports to record US$4.8bn. The country purchases almost 100% of Mongolia’s
coal, copper, iron ore, crude oil and zinc exports. In 2011, coal exports to China exceeded
21Mt generating US$2.2bn in export revenue. Mongolian exports such as coal and iron ore,
are usually sold at a discount at Chinese border. Mongolian producers lack scale and off take
agreements to sell to end users directly and middlemen catch high margins from commodity
trade. Mongolian exporters realized average price of US$110/t for their high quality hard
coal in 2011. With the ramp up of production, Mongolian producers will be able to realize
higher prices.
Exports by Resources (US$mn)

Exports by Markets (% of total, 2011)

5000
4000
3000
2000

Others
US$0.38bn
7.9%

1000
0
2004

2006

2009

2010

Coal

Copper
Gold

Zinc

Fluorspar

Molybdenium

2011

Iron ore

Crude oil

China
US$4.4bn
92.1%

Others

Source: NSOM

Source: NSOM

Mongolian imports grew over 200% to US$6.5bn in 2011 from US$3.2bn in the previous
year. Imports are driven by large scale construction in mining sector and growing
consumption of population. Petroleum products, mining equipment and machinery, and
food products are the major imports to Mongolia.
We expect Mongolian foreign trade to register another record year in 2012. Mongolian
trade is primarily driven by demand for commodities in China and mining related
development inside the country. We do not expect slowdown in demand for Mongolian
www.eurasiac.com

8
Mongolia Outlook 2012
World’s Fastest Growing Economy

31 January 2012

commodities. Mongolian exports are set to benefit from regional development focus in
China. Mongolia borders some of the fastest growing regions of China. Infrastructure
bottlenecks inside China and cheaper prices make Mongolian exports highly competitive.
Mongolian exports may realize higher prices in 2012 due to diminishing role of middlemen
and traders. China is to remain the largest trading partner of Mongolia. Mongolian exports
are set to increase in volume with growth in coal and iron ore output, as well as in value due
to higher realized prices.

Robust FDI Inflows and M&A Activity
In line with our expectations,
Mongolia experienced another
year of record foreign direct
investments in 2011. Accelerated
development of the Oyu Tolgoi
project and investor appetite for
quality resource assets have
attracted US$3.8bn in FDI to
Mongolia. We estimate that over
80% of FDI went to mining sector.
Ivanhoe Mines’ construction
budget for Oyu Tolgoi project
alone was in excess of US$2.4bn.

Foreign Direct Investments (US$mn)
4,000
3,000
2,000
1,000
0
2006

2007

2008

2009

2010

2011

Source: Bank of Mongolia

Mongolia also saw robust M&A activity with most of the deals being struck in the mining
sector. We estimate that M&A deals value doubled reaching over US$2bn. Most notable
deals were Mongolian Mining Corporation (HKSE: 975) acquisition of QGX Holdings for
US$464.5mn, to increase to US$950mn on reserve and output results, and Banpu Minerals
purchase of Hunnu Coal (ASX: HUN) for US$537mn. We expect continued strong FDI inflows
to Mongolia in 2012. Mining related projects drive investments again. We expect Ivanhoe
Mines to invest in the region of US$2bn into construction of the Oyu Tolgoi project.
Expansion of production at the East Tsankhi Tavan Tolgoi coalfield and tendering out of
West Tsankhi will attract investments into Mongolian mining. Public private partnerships in
infrastructure, including construction of power plants, railroads and roads under BOT model
may attract further foreign investments into Mongolia.

Expansive Fiscal Policy
Mongolia experienced record fiscal expansion in 2011. General government expenditure
increased 55.6% while revenue went up 40.9% y o y. General government budget
performed extremely well for most of 2011 registering around 3% surplus at the end of
3Q2011. State budget flipped into US$310mn or 3.6% of GDP deficit at the end of the year
with increased government expenditure, particularly capital spending and government
consumption. Equilibrated general government budget (that is excl. approx. US$190mn in
Stabilization Fund) deficit stood at 5.8% of GDP. The deficit is much smaller than initially

www.eurasiac.com

9
Mongolia Outlook 2012
World’s Fastest Growing Economy

31 January 2012

planned 9.9% of GDP, primarily due to high price of commodities. Total general government
budget revenue, including revenue allocated to Stabilization Fund was MNT4.4tn
(US$3.5bn). Mining sector accounts for about one third of government revenue. Price
assumptions for core mineral revenue generating commodities in state budget 2011 were
copper US$5,983/t, coal US$98.8/t and gold US$1,350/oz.
Total government expenditure
and net lending reached
MNT4.8tn (US$3.8bn) in 2011.
Capital spending increased by
80.6% to US$843.3mn. 23.6%
increase in public sector salaries
and wages and 59.3% increase in
subsidies and transfers, including
almost 150% increase in social
cash transfers supported private
sector consumption. Subsidies
and transfers accounted for
34.8% of total government
expenditure and net lending,
reaching 15.4% of GDP.

Government Budget Performance (MNTbn)
6000
5000
4000
3000
2000
1000
0
2006

2007

2008
Revenue

2009

2010

2011

2012F

Expenditure

Source: NSOM, Eurasia Capital estimates

The Government plans further increase in expenditure in 2012. Approved state budget
envisages record MNT6.31tn (US$4.7bn) spending and MNT6.15tn (US$4.6bn) revenue. The
Government seeks to increase expenditure by 31.7% y o y, whilst revenue side of the state
budget is expected to increase by 39.7% y o y. GDP assumed to reach MNT16.13tn
(US$11.9bn). Budget deficit will be 1.0% of GDP. Equilibrated general government budget
(excl. Stabilization Fund) deficit will reach 3.0% of GDP. The Government expects to
accumulate MNT322.45bn (US$240mn) or 2% of GDP in the Stabilization Fund. Underlying
assumptions for mineral commodities in budget 2012 were copper US$6,663.5/t, gold
US$1,723.75/oz, processed coal US$166.58/t, coking coal US$102.60, bituminous coal
US$72.4/t and thermal coal US$57.2/t.
We hold a cautious view on budget performance in 2012. Increased spending comes at a
time of elevated risks to global growth. Cumulative spending on wages & salaries and
subsidies & transfers is expected to grow 34% y o y to reach 20.5% of GDP. That includes
social transfers exceeding 13% of GDP. Furthermore, capital expenditure is planned to
almost double to MNT2.0tn (US$1.5bn) reaching 12.4% of GDP. The Government expects
MNT522bn (US$400mn) from major mining project advance payments to finance budget
deficit.
In our view revenue side and GDP assumptions could be slightly optimistic considering risks
to global economy and concerns about growth in China. Revenue side may not expand at a
rate expected by the government. Advance payments from major mining projects may not
materialize yet, putting government fiscal standing under pressure. Actual budget deficit
may be higher than planned. On the other hand, strong commodity prices, diffusion of
www.eurasiac.com

10
Mongolia Outlook 2012
World’s Fastest Growing Economy

31 January 2012

global economy concerns and continued strong growth in China may dramatically improve
budget performance.

Inflation Contained by Tight Monetary Policy
Rapid growth and expansive
fiscal policy kept inflationary
pressure on Mongolian economy
throughout 2011. Government
expenditure on wages and
salaries increased 23.6% y o y.
Subsidies and transfers to
population grew 59.3% to about
US$1.3bn accounting for 38.8%
of total government expenditure.

Consumer Price Index (%, YoY)
15
12
9
6
3

Dec 11

Oct 11

Aug 11

Jun 11

Apr 11

Feb 11

Dec 10

Oct 10

Aug 10

Jun 10

Apr 10

Feb 10

Dec 09

0

To contain inflation the Bank of
Mongolia tightened monetary
policy
in
2011.
Inflation Source: NSOM
threatened to get out of control
in 1H2011 with core inflation hitting 11.4% y o y, whilst headline CPI number of 6.2% y o y
remained low. Government coordinated sales of meat helped to bring down food prices.
Meat and meat products remain a staple food in Mongolia and account for 16.5% of total
CPI. In the same period, loans outstanding grew 57.9% y o y. Loans grew incredible 7.2% m
o m in June 2011. Money supply (M2) jumped 63.8% y o y. Double digit inflation, incredible
loan growth rates and strong economic growth indicated at overheating economy in
1H2011.
The Bank raised its policy rate by 75 basis points to 11.75% in August and by 50 additional
basis points to 12.25% in October. Furthermore, the Bank of Mongolia raised the banking
sector reserve requirement twice in the year, by a total of 900 basis points to 11%.
Tight monetary policy kept core inflation at 10% y o y and headline national inflation at
10.2% y o y in 2011. Money supply (M2) growth rate declined to 37.3% by the end of 2011.
However, lending continued rising and registered 72.8% y o y growth in 2011. The Bank of
Mongolia policy moderated inflationary pressure; however risks of high inflation becoming
entrenched in the economy still remain. Strong growth and record government spending in
2012, including social transfers exceeding MNT2.1tn (US$1.6bn) will put considerable
inflationary pressure on the economy. The central bank announced its intention to keep
inflation below 10%. However, increased consumption will drive up prices, especially, food
and fuel prices, in our view. We expect aggressive monetary tightening late 2Q2012. To
contain inflation, the central bank may need to increase its policy rate as well as banking
sector reserve requirement. We believe monetary policy may not be enough to keep
inflation below 10% and it may hit 15% y o y during the year 2012.

www.eurasiac.com

11
Mongolia Outlook 2012
World’s Fastest Growing Economy

31 January 2012

Key Economic Indicators for Mongolia
Indicator
Population and income
Population, mn
GDP per capita, US$

2004

2005

2006

2007

2008

2009

2010

2011e

2012f

2.53
720

2.56
905

2.59
1327

2.63
1620

2.68
2108

2.74
1688

2.76
2267

2.81
3045

2.86
4056

National accounts
Nominal GDP, MNTbn
Nominal GDP, US$bn
Real GDP growth, y o y, %

2,152
1.8
10.6

2,780
2.3
7.2

3,715
3.2
8.6

4,599.5
3.9
10.2

6,555
5.1
8.9

6,591
4.6
1.3

8,415
6.6
6.4

10,830
8.6
17.3

16,134
12.0
20.0

Monetary indicators and inflation
M2 growth, y o y, %
CPI, y o y, %
Exchange rate, MNT/US$, end year
International reserves, US$mn

20.4
11.0
1,209
208

34.6
9.2
1,221
333

34.8
4.8
1,165
718

56.3
14.1
1,170
1,001

5.5
22.1
1,267
657

26.9
4.2
1,443
822

62.5
13.0
1,257
2,000

37.3
10.2
1,396
2,500

50.0
15.0
1,300
2,500

33.1
35.0
2.1

30.1
27.5
3.2

36.6
28.5
3.9

40.9
38.0
2.2

35.4
40.2
5.0

32.9
38.3
5.4

37.1
36.6
0.5

40.6
44.3
3.7

38.1
39.1
1.0

4,780
6,527
64.4
104.1
1,747
3,818

5,740
7,500
20.0
15.0
1,760
3,000

Government finance
Revenue, % of GDP
Expenditure, % of GDP
Budget balance, % of GDP

Balance of payments
Exports, US$mn
872
1,069
1,545
1,952
2,539
1,885
2,909
Imports, US$mn
1,021
1,224
1,516
2,170
3,616
2,909
3,200
Exports, y o y, %
41.2
22.4
44.9
22.5
30.3
24.9
54.3
Imports, y o y, %
27.5
16.0
25.4
36.1
66.6
34.3
49.7
Trade balance, US$mn
149
155
30
218
1,077
252.3
291.6
FDI, US$mn
92.9
182.3
367
500
709
801
1,400
Source: National Statistics Office of Mongolia, the Bank of Mongolia, IMF, Parliament resolutions, Eurasia Capital estimates
e = estimate, f = forecast

www.eurasiac.com

12
Mongolia Outlook 2012
World’s Fastest Growing Economy

31 January 2012

POLITICS
We view 2011 as a successful year for Mongolian foreign policy. The country is playing an
active and growing role in North Asia. The number of high level visits to and from Mongolia
reflects increasing significance of the country in the region. The country signed a number of
important bilateral agreements on cooperation and investments.
As a landlocked country sandwiched between Russia and China, Mongolia puts emphasis on
developing balanced relations with its two large neighbours and countries beyond or “third
neighbours”. Among many dignitaries, Mongolia hosted US Vice President J. Biden, German
Chancellor A. Merkel and South Korean President Lee Myung Bak. Mongolian President and
Prime Minister paid visits to China, Russia, USA, Australia, Italy and the Middle East
countries.
Mongolia signed a Strategic Partnership Agreement with China in June 2011. We expect the
agreement to expand cooperation and bolster economic ties, and add further impetus to
Chinese investments into the Mongolian economy. Mongolia also enjoys strategic
partnership status with Russia. During the visit of Korean President to Mongolia, the
countries agreed to elevate bilateral relations to a “Comprehensive Partnership” status. The
parties agreed to expand cooperation in resource and infrastructure development.
Mongolian astute and pragmatic foreign policy places the country at the heart of political
and economic developments in North Asia, while the country enjoys very good
“neighbourly” relations with many countries in the region and beyond.
Mongolian lively domestic policy demonstrated stability and continuity. The ruling coalition
government focused on development and poverty reduction. Consecutive years of record
FDIs indicate at the government’s aptitude to attract investments. The government provided
strong and unequivocal support to the Oyu Tolgoi Investment Agreement, albeit calls from
some Members of Parliament for re negotiation. Mongolian political process is consensus
driven and major decisions are hotly deliberated and contested. The decision process is time
consuming, but the decisions enjoy wide support afterwards. The abortive Tavan Tolgoi
tender reflects the nature of multi dimensional political process and difficulties of driving
major decision in pre election year by a coalition government.

Parliamentary Elections
The country will hold parliamentary elections in June 2012. Gearing towards elections the
Democratic Party, a junior partner in the government, has left the ruling coalition with the
Mongolian People’s Party (MPP). We expect lively political discourse on equitable economic
development, poverty reduction and welfare, society and environment in the run up to the
elections. A number of parties will participate in the elections, but we expect the Mongolian
People’s Party and the Democratic Party to dominate the elections and political agenda. The
elections will be held under the new Elections Law adopted in December 2011. The law
introduced proportional system into the election process. Previously, all 76 MPs were
elected by direct vote from single mandate districts. Under the new law, 48 MPs will be
elected by direct vote and 28 MPs will be elected on party list voting. The number of MPs
www.eurasiac.com

13
Mongolia Outlook 2012
World’s Fastest Growing Economy

31 January 2012

remains unchanged at 76. The Mongolian nationals living abroad will be able to vote only on
party lists.
Everyone will be wary of a repeat of the post 2008 elections crisis. The elections in 2008 saw
a brief period of turmoil and civil unrest before the forming of a coalition government
between MPP and DP. The coalition government succeeded in stabilizing the country and
focused on attracting investments, diversifying economy and fighting corruption. Overall, we
do not expect repeat of 2008. The country is developing at furious pace and there is an
intuitive consensus among major political parties on economic development. Regardless of
the election outcome, we do not expect reversal of recent achievements and major changes
to the economic governance.

www.eurasiac.com

14
Mongolia Outlook 2012
World’s Fastest Growing Economy

31 January 2012

GLOBAL ECONOMY
With an economy dependent on exports and foreign capital, Mongolia is not immune from
the trends in the global economy, in our view. Significant decline in international prices for
commodities may pose a risk to the Mongolian export revenues. The moderately growing
U.S. economy, sovereign debt crisis in Europe and slowdown in developing countries may
affect the demand for commodities, therefore putting downside pressure on prices. The
World Bank estimates the world economy to grow at a moderate rate of 3% in 2012
according to its Global Economic Prospects report released in January 2012. In particular,
growth in high income economies is projected to slow to 1.4% GDP growth rate this year
and the developing economies to 5.4%. The economy of China, the largest export market for
Mongolia, may slow to 8.4% amid expected weakening demand in the US and European
markets.

Global Economic Growth (2010 2012f)
18
16

15.1

14
12
10

8.4

8
5.4

6
4

3

1.4

2
0

0.3

2
World

High income Euro area Developing
economies
2010

2011e

China

Mongolia

2012f

Source: The World Bank (GEP, January 2012), NSOM, National Statistics
Bureau of China

Despite all these, we believe that the current demand level in China should still be
considered strong for the Mongolian commodities exports. In our view, Mongolia may
strengthen its market position further in China this year by winning more market share from
its competitors such as Australia and Indonesia through supplying commodities at relatively
cheaper price and due to infrastructure bottlenecks in the respective provinces of China.
Even if a moderate decline in the commodities prices is expected to persist, Mongolia should
benefit from the increase in physical volume of its exports, primarily coal and iron ore.

www.eurasiac.com

15
Mongolia Outlook 2012
World’s Fastest Growing Economy

31 January 2012

COMMODITIES: BULLISH AMID MODEST GLOBAL GROWTH
Prospects of commodities whether it will be attractive or daunting largely depend on the
performance of the global economy in particular on the ability of the U.S. and China to
successfully support their economies and on the ability of European leaders to come up with
a constructive solution to the Eurozone crisis. However, the uncertainty is that the outlook
for the global economy in 2012 is not strong which if realized might put downward pressure
on commodity prices. According to the IMF, the World Bank and to the median of 70
economist estimates compiled by Bloomberg, the worldwide economy is likely to slowdown
in 2012. Although this is the case, the pessimistic global outlook is not fully reflected in the
forecasted positive commodity prices according to the analysts’ estimates compiled by
Bloomberg. The bullish forecast by the analysts about commodity prices shows the
anticipation that the world in particular the U.S., China and Europe will be able to positively
resolve the economic challenges ahead of them supporting demand for commodities. It is
worth noting that although the analysts in Bloomberg Survey were able to predict correctly
a downturn in commodity prices for 2011 they were off the target for 2010 predictions.
Putting Mongolia into perspective, we think Mongolia as a heavily mineral dependent
economy will remain vulnerable to commodity price fluctuations since mineral exports of
Mongolia constitute the lion’s share, approximately 88%, of total exports. Moreover,
Mongolia’s prospect partially depends on the reasonable budget assumptions about the
price of the key commodities (coal and copper) and China’s ability to engineer soft landing
for the economy.

Commodity Price Forecasts
2010

2011
Actual

Difference

+21.7%

98.83

+13.5%

Forecasted
(median)
100

+48.8%

8,859

7,600

14.2%

8,625

147

+37.4%

135.63

168

+23.8

150

18,375
2,062

24,750
2,454

+34.7%
+19%

23,937
2,375

18,710
1,875

21.8%
21.1%

20,812
2,140

Lead, US$/t

1,874

2,550

+36.1%

2,450

2,035

16.9%

2,250

Gold, US$/t

1,099

1,420

+29.2%

1,426

1,563

9.6%

1,572

Copper, US$/t
Iron Ore Fines 62% FE spot,
US$/t
Nickel, US$/t
Zinc, US$/t

Actual

Difference

94.31

6,450

9,600

107

2012

Forecasted
(median)
87

Crude oil (WTI), US$

Forecasted
(median)
77.5

Hard quality Coking Coal,
*191
*289
US$/t
Thermal Coal Australian
106.03
129.58
Newcastle, US$/t, average
annual
Source: Bloomberg Survey, Steel Index, globalCoal, *BREE, ABARES Australia Japan average contract price

*226

www.eurasiac.com

16

120
Mongolia Outlook 2012
World’s Fastest Growing Economy

31 January 2012

MINING
Importance of mining industry for the Mongolian economy has been increasing over the last
years. Contribution of mining and quarrying industry to GDP increased 8.7% in 2011
compared to 3.6% in 2010. Even though production of copper, molybdenum, fluor spar, zinc
concentrates and gold declined compared to the last year, the production of commodities
which are the key contributors to GDP increased significantly. Coal, crude oil and iron ore
output rose substantially by 22.6%, 16.8% and 77.3%, respectively, in 2011, according to the
preliminary data provided by the Mongolia National Statistical Office data. It should be
noted that our projection regarding coal output is in line with actual statistics. As we have
forecasted coal production hit all time high of 30Mt in 2011 on the back of strong demand
from China. In 2012 we forecast that Mongolia would produce 38Mt of coal. For the long
term we stick to our view that Mongolian annual coal production will surge to 100Mt by
2020 in a pattern similar to what Indonesia experienced during 1997 2004.
Exports of Key Commodities
2009
Volume
Gold, tonne
Copper concentrate, 000 tonnes
Molybdenium ores and
concentrate, 000 tonnes

10.9
587
6.7

Fluor spar ores and concentrate,
314
000 tonnes
Iron ore, 000 tonnes
1,598.1
Iron ore scrap, tonnes
656
Zinc concentrate, 000 tonnes
150.7
Coal, 000 tonnes
7,113.2
Crude oil, 000 barrel
1,938.5
Source: National Statistics Office of Mongolia

2010
Value,
US$’000
308,473.2
501,923.7
50,308.8

Volume

2011

2010 vs 2011
Volume,
Value, %
%
47
36
0.72
25
12.5
9.8

Volume

5.1
568.7
4.8

Value,
US$’000
178,339.0
770,594.2
51,989.1

2.7
572.8
4.2

Value,
US$’000
113,046.6
963,596.0
46,393.6

48,223.9

405.6

68,824.5

404

94,876.7

0.39

37.9

88,769.5
139.9
122,494.3
306,300.6
115,632.5

3,563.7
1,010.2
119.8
16,726.2
2,070.8

253,825.1
313.9
134,135.3
881,998.3
154,386.1

5,753.1
1,261.9
120.7
21,105.6
2,540.5

437,328.3
512.0
142,678.4
2,250,046.4
252,191.8

61.4
24.9
0.8
26.2
22.7

72.3
63.1
6.4
155.1
63.4

Mongolia Dwarfs Australia in Coking Coal Exports to China
As we have identified in our Mongolia Outlook 2011, coal exports surpassed copper exports
in monetary value by US$111.4mn in 2010 for the first time in Mongolian export history. In
2011 value of coal exports exceeded that of copper 11.5 times or by US$1.28bn. Moreover,
in 2011 another important milestone was achieved as Mongolia overtook Australia as the
largest exporter of coking coal to China. In just three years Mongolia emerged from being a
minor to a major coking coal exporter to China. We estimate that in 2011 Mongolia met
approximately 38% of China’s coking coal imports demand. The main reasons for China
increasing its coking coal imports from Mongolia are big price difference (more than 2 times)
between seaborne market supplied coking coal and Mongolian coking coal, transportation
bottleneck in China to bring coal from coastal areas to developing regions in the north and
extreme flooding in Australia that decreased coking coal supply from Australia. Looking
forward we anticipate that Mongolia will likely strengthen its position in China’s coal
imports.

www.eurasiac.com

17
Mongolia Outlook 2012
World’s Fastest Growing Economy

31 January 2012

China’s Coking Coal Imports by Source

2009

Others
13%

2010

2011E

Mongolia
12%

Canada
9%

Mongolia
32%

Others
24%

Mongolia
38%

Others
31%

Canada
7%

Australia
66%

Australia
37%

34.5Mt

47.3Mt

Canada
6%

Australia
23%

55.19Mt*

Source: China Customs data, Statistics Offices of Australia, Canada and Mongolia, *Eurasia Capital estimates

Mining IPOs Not As Dynamic As in 2010
In 2011 mining IPOs were not as dynamic as in 2010. There was only one full fledged IPO on
ASX made by FeOre Ltd (FEO:AU), a Mongolia focused iron ore explorer, that has started
trading on December 15, 2011 after raising A$35mn. Another Mongolia focused exploration
company, Kara Minerals, was planning to raise A$20mn through IPO on ASX and start
trading in early December 2011. However, the company has withdrawn its application from
ASX without being able to generate enough interests in the offering, in our view. Kara
Minerals Ltd. was incorporated in Australia to acquire and develop Nasryn Hundlun Tin
Project in north east of Mongolia. Guildford Coal was also considering listing its unit, Terra
Energy, on ASX. A float is still under consideration in 2Q2012. In 2011 several companies
came to the market through a reverse takeover of Mongolian assets (exploration licences).
These companies, Draig Resources Ltd. (former C@ Ltd), Modun Resources Ltd. (former TVN
Corp. Ltd), UTMI (former Wedge Energy International Inc.), Mongolian Resources Corp. Ltd
(former Alamar Resources Ltd) and Kincora Copper Ltd. (former Brazilian Diamonds Ltd.), are
currently trading on stock exchanges in Australia and Canada.
Much anticipated IPO of Erdenes Tavan Tolgoi, the state owned enterprise that holds the
mining licence for the world’s largest untapped coking coal mine, didn’t take place in 2011
as it was expected. Early in July, the Government announced that it has selected China’s
Shenhua Energy Company, U.S. Peabody Energy Corp. and Russian Mongolian consortium to
develop the Western Tsankhi area of the Tavan Tolgoi deposit. However, due to the public
pressure and dissatisfaction among the bidders over the selection process as well as refusal
by the National Security Council, the Government had to backtrack on the deal. Complex
and opaque process caused considerable concerns among investors over the Government’s
ability to successfully finalize the deal. Later the Government resumed negotiations with all
bidders and announced that Erdenes Tavan Tolgoi may raise more than US$3bn in IPO on
the Mongolian and London Stock Exchanges by July 2012. In our view, the government
www.eurasiac.com

18
Mongolia Outlook 2012
World’s Fastest Growing Economy

31 January 2012

anticipates that it will be able to do the IPO of Erdenes Tavan Tolgoi in 2012 since it has
already included the prepayments from the deal in the 2012 budget. We are slightly
cautious about the government’s ability to successfully launch the IPO this year taking into
account upcoming parliamentary elections and uncertainties in global markets.
Political Maneuvering Triggered by Elections
In September 2011 twenty MPs and several lawmakers demanded the coalition government
to reconsider existing agreement on the Oyu Tolgoi mine by requesting to increase
Mongolia’s stake in the project to 50% from 34%. However, Rio Tinto and Ivanhoe Mines
refused to accept proposed amendment to the agreement. This situation gave a warning
signal to international investors indicating that Mongolia could be an unstable country to
invest. As a result the share prices of international mining companies with operations in
Mongolia tumbled significantly on the back of this news. Fortunately, for the benefit of
investor community and Mongolia as whole, the coalition government issued a joint
statement with the two mining companies in which it reaffirmed its commitment to the
existing investment agreement. We view that request for renegotiation of investment
agreement was politically driven amid the forthcoming parliamentary elections in June 2012.
Looking forward we see the risk that ahead of upcoming elections similar unusual requests
might make the country go through turbulent times. Nevertheless, even though Mongolia,
similar to other countries, is sensitive to such kind of events, we think that the government
is acting in the public interest and taking pragmatic approach to manage the challenges.
New Exploration Licences Still Not Granted
Temporary suspension of granting new exploration licenses set in 2010 was not lifted in
2011. Instead government agencies were cleaning holders of exploration and mining
licences from companies that were violating the laws. The State Specialized Inspecting
Agency (SSIA) has shut 73 mining companies down that were operating illegally near the
river and forest basins. Majority of closed companies were small illegal gold mining
companies. The ban on granting new exploration licences is expected to be effective until
the government passes a new law on mineral resources. Moreover, the government intends
to reduce total area of Mongolia covered by exploration licences from today’s 17% to 10%.
As of November 25, 2011 there were 3,763 active exploration and mining licences in
Mongolia.

www.eurasiac.com

19
Mongolia Outlook 2012
World’s Fastest Growing Economy

31 January 2012

BANKING
Representing the Booming Economy
Mongolian banking sector expanded a record pace of 50.1%, compared with 41.2% in 2010,
along with the rapid expansion in the economy. Large FDIs particularly in the mining sector
and the consequent increase in commodity export income had significant positive impact on
the whole economy. Goods and services industries benefited from increased demand from
households, growth in state and corporate investments, and strong corporate and individual
income boosted tax revenue to the budget. The banking sector assets surged to
MNT9,372bn (US$6.7bn) and bank assets to GDP ratio reached to the new height of 86.5%,
clearly representing the booming economy.

Bank Assets and Growth

Assets/GDP Ratio, %

10,000

60%

100%

8,000

50%

80%

40%

6,000

30%
4,000

20%

2,000

10%
0%

0
2007

2008
2009
Assets, MNTbn

2010
2011
Growth, %

Source: The Bank of Mongolia, Eurasia Capital

87%
74%

67%

74%

56%

60%
40%
20%
0%
2007

2008

2009

2010

2011

Source: The Bank of Mongolia, Eurasia Capital

Current accounts (CAs) and deposits grew 30.2% and 40.0% in 2011 compared with 109.5%
and 49.5%, respectively, in 2010. Combined growth of 36.5% to MNT5,739bn in CAs and
deposits created half of the sector growth.
Other capital sources grew more than CAs and deposits in 2011. Loan from the banking
sector increased 61% (77% of this growth came from the central bank) to MNT672bn
supporting sector wide growth by 4.1%. Foreign liabilities grew 54.4% to MNT688bn and
government deposits surged 120.6% to MNT932mn, each supporting sector growth by 3.9%
and 8.2%, respectively. Together with shareholders’ equity growth of 77% to MNT677bn and
other liabilities growth of 78.3% to MNT662bn, all the “non CAs and deposits” capital
sources contributed to the other half of growth in 2011.
It should be noted that there was an extraordinary increase in each of loans from the Bank
of Mongolia, foreign liabilities, and government deposits in December because of the
competition among the banks to show higher year end asset numbers in their balance
sheets.
XacBank announced its plan to sell US$300mn bonds on Euro Medium Term Note
programme in international markets. The bank plans to raise up to US$150mn within the
programme in 2012. This has been in line with our general expectation that the banks will

www.eurasiac.com

20
Mongolia Outlook 2012
World’s Fastest Growing Economy

31 January 2012

seek access to foreign capital markets primarily through bond deals and private equity to
increase capacity to provide long term loans. The banks were also able to add MNT86.5bn
into their equity last year.
The large state budget had its place in the banking sector balance sheet having 120% higher
figure compared with the previous year. In monetary terms, the government deposit
increased by MNT509bn to MNT932bn representing almost 10% of the sector asset sources.

CAs and Deposits, Growth and Share in Assets
8,000

Banks Financing Sources 2011
80%
Current Accounts

60%

6,000

7%
7%

40%

21%

4,000
20%

0

8%

20%
2007

2008

2009

2010

2011

CAs and Deposits
CAs and Deposits % in Assets
CAs and Deposits Growth, %

Source: The Bank of Mongolia, Eurasia Capital

Liabilities to the Banking
Sector
Foreign Liabilities

10%

0%

2,000

Deposits

7%

Government Deposits

40%

Equity
Others

Source: The Bank of Mongolia, Eurasia Capital

The domestic loan demand was very strong during 2011 and is expected to continue
growing the following years. Total outstanding loans jumped 73.4% y o y to MNT5,598bn
which was 59.7% of total assets at the end of 2011. As the sector wide loan quality,
measured by past due in arrears and non performing loans (NPLs) ratios, significantly
improved in 2010, the banks started loosening credit policy from the beginning of 2011.
During 1H2011, the total outstanding loans increased 40% (5.8% per month) or by
MNT1,289bn.
The global financial market uncertainty during 2H2011 had a negative effect on the MNT
performance, export income and FDI inflow, thus eventually raising risk aversion of the
banks. New loans granting speed observably slowed from July. During 2H 2011 new loans
increased only 24% (3.6% per month) or by MNT1,080bn.
The Bank of Mongolia raised reserve requirement ratio from 5% to 9% in February and
further to 11% in August last year against surging inflation. However, as the banks had
plenty of reserves, this tool didn’t effectively work to slow loan growth. The central bank’s
only effective tool was policy rate, in our view, and therefore, the already high rate was
further raised three times by 50bps to 11.5% in April, by 25bps to 11.75% in August, and by
50bps to 12.25% in October.

www.eurasiac.com

21
Mongolia Outlook 2012
World’s Fastest Growing Economy

31 January 2012

Loans, Growth and Share in Assets

Reserve and Liquidity Ratios
80%

6,000
5,000

60%

4,000

60%
50%
40%

3,000

40%

2,000

20%

1,000

30%
20%
10%

0

0%
2007

2008
2009
2010
2011
Outstanding Loans, MNTbn
Loans/Assets, %
Outstanding Loans Growth, %

Source: Bank of Mongolia, Eurasia Capital

0%
2007

2008

2009

2010

2011

Reserve, Cbills/CAs and Deposits, %
Liquidity Ratio, %*
Source: Bank of Mongolia, *Eurasia Capital Estimates

In line with our expectation, past due in arrears and NPLs ratios improved throughout the
year, the former dropping to historical low of 1.3% and the latter substantially down to 5.8%
at the end of 2011. In absolute terms, these sub loans declined 17.3% and 11.8%,
respectively.

NPLs and Past Due in Arrears Ratios
17.4%

20%
15%
10%

5.8%

5.8%
3.3%

5%
2.4%

4.6%

2.0%

1.3%

0%
2005

2006

2007

NPL/Loans, %

2008

2009

2010

2011

Past Due in Arrears/Loans, %

Source: Bank of Mongolia, Eurasia Capital

Market Bet for MNT
The currency structure of CAs and deposits give us some notion regarding the market bet on
the currency rate. Domestic currency CAs and deposits soared 48.3%, y o y. Its share in total
CAs and deposits increased to 70% while foreign currency CAs and deposits increased only
15.3% y o y and its share down to 30%.

www.eurasiac.com

22
Mongolia Outlook 2012
World’s Fastest Growing Economy

31 January 2012

Respective weighted average annual rates 10.5% and 2.8% on MNT denominated CAs and
deposits against 4.5% and 1.1% on US$ denominated CAs and deposits, at the end of 2011,
show the attractiveness of holding assets in MNT. Throughout 2011, individuals and
corporate entities preferred holding their money in MNT as they were betting on MNT
appreciation, though the local currency had steadily lost against US$ during 2H2011. The
MNT depreciation during 2H 2011 didn’t clearly show dragging impact on the MNT
denominated CAs and deposits’ growth.

Currency Structure of CAs and Deposits
100%
80%
60%

67%

62%

61%

64%

70%

33%

38%

39%

36%

30%

40%
20%
0%
2007
2008
Foreign Currency

2009
2010
Domestic Currency

2011

Source: The Bank of Mongolia, Eurasia Capital

The Blanket Guarantee Law on CAs and deposits approved in 2008 expired in January 2012.
The Bank of Mongolia, the Financial Regulatory Commission and the Ministry of Finance had
developed a commercial deposit insurance law during the last two years. As we projected a
year ago, the law was not approved in 2011 and the parliament is currently discussing the
law. We expect the law will be approved this year and it will serve for the sector
development in the long term.

Record Earnings
2011 was a golden year for the banking sector. It counted 2.8 times larger net earnings
compared with the previous year. The sector wide net earnings summed to MNT184.3bn,
the central bank numbers show. The profitability of the sector gauged by ROA and ROE
ratios peaked to the top rates of our reference period of since 2003. These ratios peaked to
2% and 27.2%, respectively, last year.
During the past financial crisis the sector netted MNT210bn cumulative loss in 2008 2009,
which was mostly cost of the bankruptcies of two banks Zoos and Anod.

www.eurasiac.com

23
Mongolia Outlook 2012
World’s Fastest Growing Economy

31 January 2012

Record ROA and ROE

Largest 10 Banks By Outstanding Loans (2011, MNTbn)

40%
20%

27%
17%

15%

0%
20%

2007

2008

2009

2010

2011

20%
40%
ROA, %

60%
80%

1,600
1,400
1,200
1,000
800
600
400
200

62%

Source: The Bank of Mongolia, Eurasia Capital

ROE, %

Source: The Bank of Mongolia, Eurasia Capital

2012 Outlook: Will Hopefully Manage Well
We expect the banking sector to expand about 30% this year. We believe this growth
estimate is reasonable based on our economic growth target, inflation and MNT forecasts,
and FDI expectation. On one hand, highly expansionary state budget and anticipated fund
raising by the banks from the international capital markets may cause the sector to see
higher than our estimated growth. On the other hand, heightened inflation fueled by the
budget would possibly drag the growth of the sector through lower capital inflow.
We expect that the market will remain betting on MNT in 2012 as we retain our long term
bullish outlook on the local currency and target 1,300 MNT/US$ rate. In our view MNT
denominated CAs and deposits’ share in total will stay stable at 70% and the balance will be
on foreign currencies.
Annual rates on CAs and deposits are likely to remain stable, we believe, as the banks have
plenty of reserves in cash in Central Bank accounts (12.2% of total assets at the end 2011),
Central Bank bills (9.4% of assets), assets deposited abroad (7.6% of assets), and
government bonds and stocks (5% of assets). Therefore, the banks will not fiercely compete
for capital by raising deposit rates, in our view. On the contrary, tightening monetary policy
and heightened inflation expectation would possibly push the banks to raise rates. The Bank
of Mongolia raised the liquidity ratio requirement for banks to 25% effective from January
2012.
Due to the short term nature of banking sector liabilities (CAs and less than one year term
deposits), the banks must seek access to long term capital available in the international
capital market. XacBank intends to issue US$150mn of its planned US$300mn Euro Medium
Term Notes in Singaporean Stock Exchange this year. We may see that the largest two banks
also contemplate to tap into the bond market. Golomt Bank received the debut ratings from
Standard & Poor's and Moody’s in November 2011 that may indicate preparation for bond
issuance.
In 2011, the Bank of Mongolia resolved that the equity capital adequacy ratio will be raised
from current 12% to 12.5% on June 30, 2012, to 13% on December 31, 2012, and further to
14% on June 30, 2013. In addition, the banks have to increase their equity capital at least to
www.eurasiac.com

24
Mongolia Outlook 2012
World’s Fastest Growing Economy

31 January 2012

MNT16bn by May 1, 2013. Meeting the absolute equity requirement does not pose a
problem for most of the banks. However, increased capital adequacy requirement and sharp
sector expansion will inevitably force the banks to go public in the coming years. We view
that the banks will try to raise capital in private equity deals this year, and starting from the
next year they will seek opportunities for possible IPOs. We recall that earlier in 2010, the
CEO of Golomt Bank stated that the bank may go public on an international stock exchange
in 2012.
We estimate 40% more new loans to be granted in 2012 taking into account of continued
strong demand, significant reserves of banks, capital growth as supporting factors.
Meanwhile inflation threat and the expected more tightening monetary policy from the
Bank of Mongolia will still be present. The Bank of Mongolia has been increasing reserve,
liquidity and capital adequacy requirements and policy rate decline is unlikely this year. It
appears that interest rates are not likely to decline in 2012.
Loan quality will further improve, in our view. Loans in arrears rate already at the record low
level, and we anticipate this to remain stable. Non performing loans ratio was markedly
down from 11.5% to 5.8% as of the respective 2010 and 2011 year ends, and we expect to
see further improvement on the ratio, smoothly declining below 5%.
2011 was a golden year for the Mongolian banking sector as it counted record profits. The
local banks will do well again this year, based on our belief that the banks will not raise rates
offered for capital, loans interest rates will not decline and loan repayment will further
improve.

www.eurasiac.com

25
Mongolia Outlook 2012
World’s Fastest Growing Economy

31 January 2012

ASSET CLASSES
Local Equities: Second Best Performing Market Globally
MSE Hit the Target
In line with our projections that the Mongolian equity market will be among the world’s top
three best performing markets, the MSE closed 2011 as the second best performing market
globally. The market benchmark, the MSE Top 20 Index, surged 46.9% (32.3% in US$ term)
to 21,687.57. This is higher than our initial target of 20,000, +40% growth estimated in our
2011 outlook.
The MSE Top 20 Index outperformed developed and emerging markets, while the S&P 500
Index remained flat, and MSCI EM Asia and MSCI Frontier indices lost 19.1% and 22.1%,
respectively.
MSE Top 20 Index Performance 2011

MSE Top 20 vs Global and Regional Benchmarks

34,000

20,000

30,000

250%

15,000

22,000

10,000

18,000

200%

MNTmn

26,000

MSE Top 20
MSCI EM Asia
S&P 500
MSCI Frontier

150%

5,000

14,000

100%
Dec 11

Source: MSE, Eurasia Capital

Dec 11

Nov 11

Oct 11

Sep 11

Jul 11

Aug 11

Jun 11

May 11

Apr 11

Mar 11

Jan 11

Top 20 index

Feb 11

Top 20 Trading Volume (MNTmn)

50%
Dec 10

Oct 11

Nov 11

Sep 11

Jul 11

Aug 11

Jun 11

Apr 11

May 11

Feb 11
Mar 11

Jan 11

10,000

Source: MSE, Eurasia Capital

MSE market cap reached MNT2,168.6bn (US$1,554.5mn) at the end of 2011 adding
MNT794.6bn (US$570mn) in total during the year. Shortly after exceeding US$1bn threshold
first time in mid November 2010, MSE market cap almost tripled in three months hitting
US$2,829.5mn at the peak on February 25, 2011. However, the market declined till the end
of May. The total equity trading volume at the MSE was MNT109.1bn (US$78.2mn) last year,
28.2% higher compared with 2010.
MSE Market cap, US$mn

MSE Stock Trading Volume, US$mn

3,000

US$mn

2,500
2,000
1,500

Source: MSE, Eurasia Capital

www.eurasiac.com

Dec 11

Nov 11

Oct 11

Sep 11

Aug 11

Jul 11

Jun 11

May 11

Apr 11

Mar 11

Feb 11

Jan 11

1,000

90
80
70
60
50
40
30
20
10

78
53

16

11

2006

50

47

2007

2008

2009

2010

2011

Source: MSE, Eurasia Capital

26
Mongolia Outlook 2012
World’s Fastest Growing Economy

31 January 2012

Bubble and Burst
MSE experienced significant volatilities last year due to low liquidity, increased awareness of
the market, new development initiatives and international financial market turbulences.
Rush to take exposure as early as possible created a bubble in the MSE pushing the Top 20
Index up 123.3% to 32,954.97, within less than two months at the beginning of 2011. The
2010 global outperformance of the MSE (138.4%), the London Stock Exchange (LSE)’s
strategic partnership agreement and the Master Service Agreement to modernize the MSE
and the country’s stock market as a whole combined with positive general economic outlook
loudly signaled about the opportunities of the market. Furthermore, the government
announced that 10% common shares of Erdenes Tavan Tolgoi (ETT) will be distributed to
every Mongolian citizen in 1Q2011 raised awareness of the market among the Mongolian
people and foreign investors. Though the total market capitalization gained US$1.7bn during
this period, an average daily volume was only US$230,000.
During three months till the end of May following the peak, the index went through
significant correction and lost 43.8% to 18,534.23 on an average daily volume of
US$330,000. The international financial market slide and increased volatility started from 2Q
further worsened through the remainder of the year which had a freezing impact on the
cash inflows from foreign investors. During the second half of the year, the index ranged
between 18,000 and 22,000 while the average daily volume further improved to
US$370,000.
Our 2011 Calls Played
The top 5 companies of the exchange together with other two big gainers comprised over
80% (US$511mn) of the total market gain (US$570mn) in 2011. Tavan Tolgoi (TTL) and APU
(APU) hit our 2011 targets. TTL, the largest cap stock of the bourse, surged 91% and APU,
becoming the second largest, jumped 111.1% supporting the market expansion by
US$198mn and US$118mn, respectively. However, Mongolia Development Resources
(MDR), a real estate play, declined 22.3%.
The third and fourth largest stocks of
Main contributors to MSE 2011 Growth
the bourse, Baganuur (BAN) and
Shivee Ovoo (SHV) advanced at
16%
relatively moderate rates of 24.8% and
4%
35%
17.7% adding US$39mn and US$22mn
4%
to their market caps, respectively. The
5%
other two big gainers were Berkh Uul
7%
(BEU) which contributed US$50mn,
9%
20%
the third biggest, to the market cap as
its share price soared over 24 times
from a year earlier level and UB BUK Source: MSE, Eurasia Capital
(BUK) which contributed US$23mn as it grew over 6 fold.

Tavan Tolgoi
APU
Berkh Uul
Baganuur
Sharyn Gol
UB BUK
Shivee Ovoo
Others

Our belief that the Mongolian stock market had been well undervalued has been proved by
the spectacular growth for the past several years. The investors who understood the real
opportunity in the market counted tremendous performance in their portfolios again in
www.eurasiac.com

27
Mongolia Outlook 2012
World’s Fastest Growing Economy

31 January 2012

2011. The high performance of the blue chip large cap stocks was supported by the factors
that first, these were fundamentally undervalued and second, they have strong growth
outlook. We view that the valuations of some large cap stocks have reached the bottom of
their reliable intrinsic value ranges considering their fundamentals, growth outlooks and, as
well as the market and individual company risks. We believe that the downside risk in the
market is limited as the Mongolian economy expanded 17.3% last year and is expected to
speed up further this year and to remain as the world’s fastest growing economy for several
years to come.

MSE Top 20 Companies Share Performance 2011
50%
Bayanteeg
Suu
Talkh Chikher
Mogoin Gol
Remicon
APU
Tavan Tolgoi
Hotel Mongolia
Bayangol Hotel
BDSec
State Department Store
Baganuur
Shivee Ovoo
Sharyn Gol
Khukh Gan
Genco Tour Bureau
Gobi
8%
Mongolia Development Resources 22%
Mongolian Telecom 23%
Aduunchuluun 25%

0%

50%

100%

150%

200%

250%

300%

350%

400%

450%
414%

210%
184%
163%
144%
111%
91%
61%
50%
40%
35%
25%
18%
8%
7%
0%

Source: MSE, Eurasia Capital

“Hidden Jewels” Being Exploited
Many small caps grew at skyrocketing rates emerging from very low bases. In 2011, 54 small
caps out of the total listed 334 (MSE) companies surged more than 100%. The average share
price growth of these 54 companies was 1,600% (median 491%), ranging from 107% to
28,010%. The combined market cap of these “hidden jewels” increased by MNT184bn
(US$130mn) to MNT215bn (US$154mn) from a year earlier level of only MNT31bn
(US$25mn). Most of them are industrial, consumer goods and mining plays.
The tremendous growth is attributed to the following factors:
The balance sheet assets were significantly undervalued or asset book values were
much lower than the market values or replacement costs,
Profits are hidden. The fundamental problem of accounting misreporting peculiar to
frontier and early emerging markets is common in Mongolia. The belief that the
accounting issues will be resolved leading to realization of hidden profits is one
factor which supported the performance.

www.eurasiac.com

28
Mongolia Outlook 2012
World’s Fastest Growing Economy

31 January 2012

Speculation. It should be noted that there is a speculation component with the
general view that the market is undervalued and the Mongolian corporate sector
has very positive prospects.
We believe there are certainly a number of “hidden jewels”, however, investors should be
mindful of the risks to explore and exploit them. The inherent risk of low liquidity of the
market must be noted. The US$130mn market cap growth of these small caps was
generated only on US$4.1mn total annual trade volume.

2011 MSE Top 10 Performers
0%

Top 10 New Million $ Companies

10000%

20000%

APP (Sudut)

30000%
28010%

Teever Darkhan

13014%

Tav

10917%

Ar Bayankhangai

3221%

0

1

Market Cap, US$mn
2
3

4

5

APP (Sudut)
Teever Darkhan
Gutal
Tav

Berkh Uul

2447%

Khereglee Impex

2148%

Sor

USIB

2014%

Agro Tech Impex

Ikh Barilga

1650%

Nekheesgui Edlel

Mongeo

1513%

Darkhan Hotel

2010 Market Cap

1338%

Bukhug

2011 Market Cap

Khusug Trade

Source: MSE, Eurasia Capital

Ikh Barilga

Source: MSE, Eurasia Capital

MSE Fund Raising Activity Improving and New IPOs Expected in 2012
We expect a number of additional share offerings and few IPOs in 2012. Several currently
listed companies and private companies submitted their IPO and additional offering
documents to the Financial Regulatory Commission (FRC) for approval. Three companies
received approval from FRC for additional share offering last year.
On August 9, Silikat (SIL), an operator of light concrete plant in Darkhan city in Mongolia,
successfully raised MNT3.65bn (US$3mn) issuing additional 16.2mn shares at MNT225 per
share.
On October 17, one of the blue chip coal stocks of the MSE, Sharyn Gol (SHG) completed
MNT18.3bn (14.2mn) fund raising additionally offering 1.65mn or 16.2% of its shares at a
price of MNT11,117 per share. This was the first capital raising by a mining company on the
MSE and one of the largest. New York based Firebird Management’s funds acquired a
controlling stake of the company in 2010 and SHG carried out additional exploration worth
US$5mn in that year. In February, 2011, SHG released the new JORC compliant resource of
373.8Mt of thermal coal.
Remicon (RMC), which operates concrete mixture plant in Ulaanbaatar, received approval
from the FRC on its planned MNT7.5 9.4bn (US$5.4 6.7mn) secondary offering in December
and currently collecting orders.

www.eurasiac.com

29
Mongolia Outlook 2012
World’s Fastest Growing Economy

31 January 2012

New IPOs and more additional fund raisings are expected in 2012. As we reported last year
the Mongolian Government approved a list of State Owned Enterprises (SOEs) that are
slated for privatization; these are entities in mining, mineral processing, power generation
and distribution, construction materials, telecom and transportation. The leaders among
these expected privatizations we closely watch in 2012:
Erdenes Tavan Tolgoi (ETT): The Mongolian government has planned to float up to
30% of the shares of ETT, who holds world’s largest untapped coking coal deposit,
on the LSE and MSE within 1H2012. 10% of common shares were already distributed
to all Mongolian citizens without charge in April, 2011. Another 10% should be sold
to Mongolian companies according to the parliament resolution in 2010. However,
the parliament is currently discussing whether to sell that 10% to Mongolian
companies or to distribute it additionally to citizens.
Mongolian Railway: In May 2011, the government announced that it had decided to
raise the required fund for the construction of government’s planned new 1,100km
railroad selling 49% of Mongolian Railway LLC on the MSE. The enterprise was
established in 2008 with the intention to construct, own and use the railroads which
will be built according to the state policy. And, now it is building the 1,100km
railroad from South Gobi to the eastern border of Mongolia, in accordance with the
state policy approved in 2010. The project cost is estimated to be US$2 3bn. We
view that after the Erdenes Tavan Tolgoi IPO, the state priority will shift to this
project though the time requirement for the project would possibly be longer than a
single year.
Baganuur: In 2010, the government approved Baganuur’s (MSE: BAN) additional
share offering in the market by 2012. The company started the tender process to
select technical and financial advisors for the project in October, 2011. The size of
the offering is expected to be about 24% of the total shares.
LSE and MSE Strategic Partnership Evolving
In April 2011, Mongolia took a historically important step to develop its capital markets as
the State Property Committee of Mongolia (SPC), MSE and London Stock Exchange (LSE)
signed the landmark Master Service Agreement (MSA) to develop the MSE. The three
institutions agreed on the details of modernizing the MSE with the support by the LSE during
the next three years.
According to the service agreement, the LSE will assist the MSE to introduce an integrated
securities trading system, create effective legal environment, bring the infrastructure,
technology, and help upgrade human resources capability in line with the international
standards appointing a management team at the MSE.
Since the agreement was signed, the LSE team together with the MSE and SPC has made an
important progress in the areas of sector legal environment improvement, internal
restructuring of the bourse, and professionals education. These include:
Securities Market Law development: The restructured MSE led by the LSE team
together with other sector regulatory and participatory organizations have
developed new Securities Market Law and submitted to the Ministry of Justice for
www.eurasiac.com

30
Mongolia Outlook 2012
World’s Fastest Growing Economy

31 January 2012

the review on September 1, 2011. The new law defines custody services and enables
set up of custodians, nominee and omnibus accounts, trading and settlement of
Depository Receipts. The law is expected to reduce legal conflicts. These
amendments and revisions introduce international standards and are in line with the
strategic partners’ plan to transform the securities settlement system of the MSE
from current T+0 to T+3 which is standard in developed countries.
MSE Rules and Regulations: The revised trading rules, membership rules are already
approved, and listing rules, clearing & settlement rules are at the stage of approval.
As the MillenniumIT system is installed in the MSE, the appropriate international
standard trading and clearing & settlement rules are being developed.
MillenniumIT: The system is completely installed by December, and the market
professionals are currently exercising on trial trading.
Training: The Academy of the LSE has carried out training programs for regulators,
market participants and other stakeholders in UB and London during the last year.
The major developments investors should expect to see in the Mongolian securities market
and MSE in 2012 include:
New Market and Trading Structures: MillenniumIT system will start officially and
T+3 settlement cycle will replace T+0. Custodian services will be introduced, and
Mongol Bank will start operating as a settlement bank, trading and clearing
members will be registered. Minimum capital, financial and risk requirements for
those participants will be re regulated. The Settlement Guarantee Fund (SGF) will be
funded and enhanced.
Listing and Membership Fees to Change: The MSE plans to change the initial listing
and annual membership fees based on the market cap rather than nominal volume.
They expect it will serve as an incentive for new companies to raise money listing on
the exchange.
Lower Trading and Settlement Fees: Currently the trading and settlement fees are
very high compared with other international markets, and the MSE proposes to
decrease the fees by 50% in 2012. As liquidity increases over time, the fees will be
lowered to international levels, and be based on transactions not on monetary
volumes of trades. The development will support the market liquidity making the
market more attractive for international and domestic investors.
Erdenes Tavan Tolgoi Listing: This will have significant direct and indirect impact to
increase market size and liquidity attracting local and international investors.
The MSE plans to improve corporate governance and transparency of the listed companies
from this year. The new Company Law approved in October 2011 inserted many new
concepts on corporate governance and transparency. We believe the law will support the
securities market development.

www.eurasiac.com

31
Mongolia Outlook 2012
World’s Fastest Growing Economy

31 January 2012

2012 Outlook
We remain bullish on MSE listed equities in 2012. We expect the Mongolian equities to
benefit from increased capital inflows and estimate the MSE TOP 20 Index to
reach 28,000 by the end of this year, or +30% gain for 2012. We favor small caps that will
outperform the index due to high growth of their businesses buoyed from low base effect
and attractive valuations. We anticipate more IPOs and secondary offerings of Mongolian
companies, both domestically and internationally, especially much anticipated jumbo IPO of
Erdenes Tavan Tolgoi. Therefore, we strongly recommend our clients to invest in the
Mongolian local equities as the most effective way to gain exposure to the Mongolian
growth story. Our top picks for the next 12 months are Tavan Tolgoi (coking coal), APU
(beverages), Remicon (construction materials) and Mongolia Development Resources
(property).
The pace of the upward move measured by the performance of the TOP 20 companies will
be at a slower pace than the last year. Because first, the market has already come out of the
low base and second, we view that the valuation of some large cap stocks have come into
the their reliable intrinsic value ranges considering their fundamentals, growth outlooks as
well as market and individual company risks. In our view, the downside risk is limited as the
market has already reflected the significant correction since March 2011.
We note that Mongolian stock market still remains illiquid and any inflow or outflow of hot
money may significantly move the market up or down, as was the case in both 2010 and
2011. Erdenes Tavan Tolgoi’s IPO is expected to create crowd in the market. The MSE
schedules to implement the public education programme during the year as all Mongolians
are now shareholders of Erdenes Tavan Tolgoi.
Flow of funds from foreign individual and institutional investors into Mongolia is projected
to intensify starting from 2H2012. We expect within 1H2012 the European crisis situation
will stabilize and Erdenes Tavan Tolgoi IPO will take attention of international investors into
Mongolia.
Although the market liquidity is currently low, it is likely to improve as new IPOs and new
investors are expected to come into the market. In addition, the “Hidden Jewels” (small cap
non resources sector companies) on the MSE will be further explored. The renovation and
development measures at the MSE including start of MillenniumIT system, T+3 settlement,
custodian services establishment, improvement in listing and membership fees and 50%
decrease in trading commission are all to support the liquidity and attract new investors.

www.eurasiac.com

32
Mongolia Outlook 2012
World’s Fastest Growing Economy

31 January 2012

We target the SILKMN index to reach 1,330 (+20% growth) in 2012, to be somewhat weighed
down by expected subdue share performance of Ivanhoe Mines, the largest component of
SILKMN index. Mongolian Mining Corp. (coking coal), Prophecy Coal (thermal coal, power),
Entrée Gold (gold) and Erdene Resource Development (molybdenum and coal) are our top
picks among the SILMN index companies. We advise investors to snap up the most beaten up
stocks as the companies’ strong fundamentals and value of their resource assets become
more apparent.

www.eurasiac.com

33

Dec 11

Oct 11

Nov 11

Sep 11

Jul 11

Jun 11

Apr 11

May 11

Jan 11

Feb 11
Mar 11

Dec 10

Oct 10

Nov 10

Sep 10

Jul 10

Aug 10

Jun 10

Apr 10

May 10

Feb 10
Mar 10

Financial turbulences and debt crisis in
Silk Road Mongolia Index
Euro zone sent down emerging market
1,880
stocks significantly. Mongolia linked
1,780
internationally listed companies have
1,680
also suffered along with other emerging
1,580
markets companies. Total market
1,480
capitalization of Silk Road Mongolia
1,380
Index (SILKMN) which tracks 32
1,280
Mongolian companies was US$25.91bn
1,180
in 2011 and the index is down 27% y o
1,080
y. Silk Road Hong Kong Index (SILKHK),
980
includes 10 Hong Kong listed Mongolia
880
focused companies, is down 51% y o y.
Ivanhoe Mines, Centerra Gold and
Mongolian Mining Corp., the largest
companies by market capitalization in
Source: Silk Road Management
SILKMN index are down 22.9%, 10.2%,
35.6% y o y, respectively. The main reasons behind the drop of share prices of the SILKMN
index companies are, in our view, the overreaction by the investment community to the
economic events occurring globally and, to some extent, their response to company specific
events. However, thanks to strong demand by China for the Mongolian resources, sound
fundamentals of the companies and while the global markets stabilize, we believe that
internationally listed companies with operations in Mongolia are poised to experience
recovery in 2012.

Aug 11

International Equities
Mongolia Outlook 2012
World’s Fastest Growing Economy

31 January 2012

Mongolian Tugrik
We maintain our long term bullish
MNT and Current Account (2011)
view on the MNT while short term
Jan Feb Mar Apr May Jun Jul Aug Sep Oct Nov Dec
volatilities may occur in 2012. Our call
1450
made on January 31, 2011 that the
186
1,396.37 1400
500
MNT
may
repeat
global
outperformance
and
continue
1350
1,000
appreciating another 10% in 2011
1300
1,500
played out partially. The currency
strengthened 5% to MNT1,195 per US$
1250
2,000
1245.5
through April 1 after which it has
2,500
2,421 1200
weakened 16.8% by end 2011 to
MNT1,396 amid expanding current
1150
3,000
account deficit to US$2.4bn (end
Current account, $mn (cumulative) (LHS)
MNT/US$ (end month) (RHS)
2011) fuelled primarily by more than
expected increase in imports of capital
Source: Mongol Bank, NSOM, Eurasia Capital estimates
goods for mining projects. The
currency depreciated 11.1% y o y in 2011. The commercial banks experienced demand
pressure for the US$ amid accelerated imports that exceeded export revenues. The current
account deficit reached its record level of US$2.4bn by end 2011. The central bank that
follows the flexible exchange rate regime has not intervened in the foreign exchange market
and supplied limited amount of foreign currencies in the market. This resulted in
accumulation of international reserves in the central bank a record level of over US$2.3bn at
the end of 2011.
We expect the MNT to experience volatility this year. Our target for the currency is 1,300
per US$ that represents approximately 7% appreciation in 2012. On one hand, there is a
possible downside risk caused by further acceleration in imports for the development of key
mining projects, including Oyu Tolgoi copper gold and Tavan Tolgoi coal mines as well as for
building the major transport infrastructure. For example, import of trucks surged 177% to
US$578mn last year. Expected high prices for petroleum products (petrol, diesel fuels) that
represent over 16% Mongolia’s total imports and whose value jumped 68% last year (to
US$1,052mn in 2011 from US$626mn a year earlier) may also increase the pressure on the
downside. On the other hand, the national currency should expect some strength supported
by ramp up in exports by key coal producers and inflow of foreign investments.
Assuming that international prices for the country’s major export commodities – coal and
copper – are expected to stay firm in 2012, and demand in China remains firm, the
Mongolian economy should benefit from increase in physical volume of their exports,
especially that of coal. We estimate that the coal exports may increase at least 40% y o y to
30 million tonnes in 2012 (from over 21 million tonnes in 2011) easing the downside
pressure on the currency.

www.eurasiac.com

34
Mongolia Outlook 2012
World’s Fastest Growing Economy

31 January 2012

In addition, we expect the central bank will likely intervene in the foreign exchange market
to stem high inflation as political stress rises amid the June 2012 Parliamentary elections.
We already see growing critics from the members of the Democratic Party, which withdrew
from the coalition government this month, to seek more support from the voters as the
elections approach. The democrats blamed the central bank that the high exchange rate of
the US$ has affected fuel prices and, consequently other consumer goods that caused
concerns among the people. Therefore, in our view, the central bank sold relatively large
amount of US$ in the market to ease the accelerated depreciation of the MNT in January
this year.

www.eurasiac.com

35
Mongolia Outlook 2012
World’s Fastest Growing Economy

31 January 2012

Fixed Income
Positive outlook is expected in 2012 for government bonds, certificates of deposits (CDs)
and term deposits in major commercial banks in Mongolia. We view that in 2012 the
government of Mongolia will further utilize debt markets both domestically and
internationally for development in mining, construction of roads and houses, as well as to
support social spending. The issuance of dollar denominated government bonds will
accelerate the process to tap global international debt markets. It is currently unclear that
the upcoming year will be successful for corporate bonds as they continue to undergo the
test period started in 2011 with the Meat Bond offering. CDs and term deposits of major
banks in Mongolia will continue offering attractive investment opportunities with high
interest rates.
The last year experienced relative improvement in government bond figures backed by
confidence in Mongolia’s expected growth. Primary bond sales increased over 7.867 times in
nominal terms year over year with a total amount of MNT236.73bn (over US$169mn) in
2011, although there was significant slowdown in later offerings. During June through
August, the government offered bonds to finance the long term housing loan program for
4,000 government officials, and nearly MNT65bn was successfully sold out of the MNT72bn
offer. The Mongolian government announced MNT300bn bonds issue in several offerings
starting from August, to support cashmere, wool industries, and small and medium
enterprises (SMEs). Though nearly MNT172bn of the issue was traded, further sales in
October and November declined next to zero, affected by the negative global sentiment
over government debts. Therefore, it is worth noting that further developments in
government bond offerings might be significantly affected by the same factor in 2012.
The Development Bank of Mongolia (DBM), with the unconditional backing of the Ministry
of Finance of Mongolia and ING Groep of the Netherlands, established a US$600mn euro
medium term note program. In December, the DBM sold the initial US$20mn one year
bonds at 6% to ING Groep in a private placement. Given that Mongolia needs huge amounts
of investment to finance railway, mining, and agriculture projects, construction of roads and
accommodation, and various social spending, the DBM is expected to facilitate access to
foreign debt for several debt issues.
Meat Bonds (also “Makh Bond”) issued by Just Group kicks off the corporate bonds offer
after a long break since 2007. While tapping into the debt market by the companies may be
considered a good sign to diversify the sources of capital to implement projects at the
company level, Mongolia is currently undergoing a testing period to measure the appetite of
the corporate debt investors. Just Group was able to raise only just over MNT4bn out of the
planned MNT30bn to finance meat processing activities. The disappointing bond sales were
mainly due to risk aversion toward the debt instrument. We may expect such uncertainty in
2012, and it is unclear if there will be any bond offer by local companies, considering the
risks of investing in untested market.
CDs and term deposits at the top four commercial banks offer over 13% rates annually in
MNT and 6% rates in the US$ for individuals. These banks offer negotiable rates for

www.eurasiac.com

36
Mongolia Outlook 2012
World’s Fastest Growing Economy

31 January 2012

corporate clients at about 6% 8% in the national currency. Despite these favorable rates, for
foreign investors, we believe the deposits in MNT should be considered together with the
risks involved in the exchange rate.

Deposits rates by major banks
Bank
Golomt Bank
Trade and Development Bank
Khan Bank
Xac Bank
Source: Company Data

www.eurasiac.com

12 month rate in
MNT
13.8%
13.5%
13.4%
13.2%/14.4%

12 month rate in
US$
6.6%
6.6%
6%
6%/6.2%

Type
CDs
CDs
Term deposit
“Housing”/“Age gracefully” deposits

37
Mongolia Outlook 2012
World’s Fastest Growing Economy

31 January 2012

Property

US$/sqm

In Mongolia Outlook 2011, we mentioned
Silk Road Ulaanbaatar Property Index, US$ per sqm
that strong economic growth, national
1050
currency appreciation and speculative inflow
1000
of foreign capital have driven residential
950
property prices up nearly 20% during 2010.
900
We also concluded that growth of property
850
prices in US$ terms was mainly attributed to
800
MNT appreciation of 12.9%. At the end of
750
2011, Silk Road Ulaanbaatar Property Index
700
(SRPUB), the benchmark that tracks the
650
property prices in Ulaanbaatar advanced
600
18.4%. It implies that the average price of
Jan 09 Jun 09 Nov 09 Apr 10 Sep 10 Feb 11
Jul 11
residential property in the secondary market
reached US$1,018 per square meter and for
Source: Silk Road Management
the first time during the past 3 years it
exceeded US$1,000 threshold. It has to be mentioned that unlike 2010, when Mongolian
currency appreciated, this year MNT lost 11.1% y t d. The plunge of tugrik had downside
impact in property prices in US$ terms, which suggests that price growth in MNT is even
more significant.
Mongolian banking system has been rapidly
expanding but the effect of mortgage loan
penetration was not significant at 4% in
2010 and 6% in 2011. Despite this,
mortgage loans still nearly doubled from
last year from MNT334bn to MNT656bn
and had major impact in residential
property market during 2011. We expect
that Ulaanbaatar residential property prices
will continue appreciation as the availability
of mortgage financing increases and the
rate of loan penetration grows.

Mortgage loans, MNTbn
700
600
500
400
300
200
100
0
2008

2009

2010

2011

The Central Bank of Mongolia

Luxury residential property segment is
driven by foreign investors in the market and the growing number of wealthy Mongolians.
With population of 2.7 million and fast growing economy, the significance of wealth creation
for Mongolians will be even more apparent in the coming years. This factor has already
resulted in increasing number of luxury residential developments as well as stimulating the
demand from local population. In addition, cost of construction has increased as a result of
appreciation of land prices in central locations. Majority of the luxury apartments were
priced at US$1500 2700 per sqm during 2011 and average house or larger apartment could
be priced at over US$500,000.

www.eurasiac.com

38

Dec 11
Mongolia Outlook 2012
World’s Fastest Growing Economy

31 January 2012

Although the pace of construction slowed during 2009 2010 and office property projects
stalled, market has picked up from 2H2010 and the supply of quality office space is expected
to increase significantly going forward. Completion of Monnis Tower and Central Tower
(51% owned by Shangri La Asia), has contributed to the increase of quality office space,
followed by launch of Express Tower and Blue Sky Tower, all concentrated in the Sukhbaatar
Square area. However the total space of modern class office space is estimated at
160,000sqm, still not adequate to alleviate demand pushing rental rates up. In the
immediate future we do not expect that Grade A offices will be impacted by the increased
supply and the rental rates will continue to increase. Situation might change from 2H2013
when the major projects will be completed and the market will see substantial increase of
new office spaces.
Mongolian commercial property market has rather young history. Robust economic growth
during the last few years and improving
living standards of the local population of Construction by property type, MNTbn
Mongolia has driven retail sector to expand
300
significantly.
According
to
National
250
Statistical Office, wholesale and retail trade
200
in Ulaanbaatar surged 57.7% from 1.75bn to
MNT2.75bn in 2011. With the launch of
150
Max Mall and Naran Mall, the supply of
100
prime retail space has increased but rental
50
rates remain to be close to office rents,
suggesting that there is significant potential
0
for growth.
2006
2007
2008
2009
2010
Residential
Trade & service
Other

2011

Industrial
Hospitals, schools and cultural

Estimated total contribution of the tourism
sector to GDP in Mongolia remains to be
Source: National Statistical Office of Mongolia
around 9%. The number of visitors in
Mongolia has been on the rise and reached
all time high of over 492,800 visitors in 2009. In 2011, total of 460,360 tourists visited
Mongolia according to General Authority for Border Protection. The demand for luxury hotel
rooms is expected to grow as the booming mining sector will stimulate business travel.
Currently operating hotels, that are considered to be 4 5 stars, do not fully comply with
international quality standards. However situation is changing quickly. In 2011 Ramada hotel
opened its doors, the first in a new wave of international brands to move into Ulaanbaatar.
Construction projects are already underway for Shangri La, Best Western, Hilton, Sheraton,
Hyatt and Radisson.
In 2012, we reiterate our view that the Mongolian property market possesses significant
growth potential. With the robust economic growth expectations, we estimate that property
prices will continue to grow at double digit rates. Residential property prices in Ulaanbaatar
should add another 15% in 2012 and reach US$1,150 per sqm. We also stand by our view
that the growth will be boosted by economic growth, wealth creation and national currency
appreciation. However we expect that from 2012 mortgage loans will start playing major
role in property market growth.
www.eurasiac.com

39
Mongolia Outlook 2012
World’s Fastest Growing Economy

31 January 2012

Private Equity
Accelerating economic growth in Mongolia will offer a strong appeal for more sophisticated
investors to search for private equity deals in financial services (banking, insurance, leasing),
agricultural, manufacturing, media, IT, property advisory, tourism and hospitality sectors.
Moreover, we believe that there are numerous under capitalized small to medium sized
resource companies in Mongolia which are seeking for funds to develop their resources. A
growing number of privately held companies, looking to list domestically and internationally,
will create pre IPO opportunities.
The telecom market appears to be relatively saturated with more than 60% penetration rate
of cell phone users, according to South Korea’s SK Telecom. In 2011, SK Telecom exited the
market selling its entire 29.3% stake at Skytel LLC for US$25mn to existing shareholders.
Terra Energy LLC (TE), owned by Guildford Coal, may create a pre IPO opportunity as the
owners initially planned to list TE with several exploration licenses in South Gobi region of
Mongolia.
M&A
Mongolia experienced significantly larger M&A activities during 2011 in line with our
projections the previous year. We estimate 39 M&A deals were observed with the total
volume of over US$2bn in 2011, nearly twice as much as in 2010. Mining and exploration is
an exclusive sector for M&A in Mongolia, particularly in 2011, many international mining
and exploration companies were active participants in the process. According to our
estimates, since 2007, the Mongolian coal industry has experienced over 50 M&A deals with
total value of US$2.19bn. In 2011 only, 27 coal related M&A deals worth US$1.65bn were
completed. The most prominent names in terms of the M&A deal size throughout the year
include Banpu (Thailand), Mongolian Mining Corp. (Mongolia), Noble Group (Asia), Guildford
Coal (Australia).
Banpu, Thailand’s coal magnate, acquired Hunnu Coal with over 800Mt JORC
compliant coking and thermal coal resources in 11 exploration projects in Mongolia.
Banpu acquired 12.2% of Hunnu in March for AUS$45mn and the rest for
AUS$477mn (US$493mn) in September through November at AUS$1.8 per share,
paying nearly 30% takeover premium to shareholders.
Mongolian Mining Corp. acquired the Baruun Naran (QGX) coking coal mine with
253Mt NI 43 101 compliant Measured and Indicated resources for US$464.5 from
Kerry Mining (90%) and MCS Minerals (10%). The acquisition value may be adjusted
to US$950mn depending on the proven and probable reserves as well as production
from the Baruun Naran mine.
Noble Group, a large Asian commodities trader, acquired 10.1% undiluted interest
in Aspire Mining by the end of 2011. Through a joint venture (50/50) with Xanadu
Mines, Noble owns the Nuurstei coking coal project (with the right to own up to
80%) and Javkhlant project.

www.eurasiac.com

40
Mongolia Outlook 2012
World’s Fastest Growing Economy

31 January 2012

Guildford Coal, an Australian exploration company, made exploration license
acquisitions worth a total of US$50.73mn through its joint venture, Terra Energy,
with local partners. The company managed to increase its stake in Terra from 50% to
70% this year for US$7.23mn. Guildford recently carried out talks with potential
buyers.
Draig Resources (formerly C @ Ltd.), another Australian exploration company,
acquired 100% shares of BDBL LLC, a subsidiary of Peabody Winsway Resources,
with 8 coal exploration licenses. The settlement worth of US$7.87mn was completed
in late 2011.
We believe Mongolia continues to be one of the most appealing targets for M&A deals in
2012. Coal companies, both exploration and mining, will dominate in the list of potential
strategic buyers. Mongolia holds estimated 160 billion tonnes of coal resources with
significant further exploration potential and only 17% of the area has been explored. M&A
target prospects, in our view, will include SouthGobi Resources (SGQ: TSX), Mongolia Energy
Corp. (276: HK), Aspire Mining (AKM: ASX), Guildford Coal (GUF: ASX), Sharyn Gol (SHG:
MSE), Xanadu Mines (XAM: ASX), Mogoin Gol (BDL: MSE). Naturally, the international
players will account for the majority of the strategic buyers as they contribute to the
development with much needed funds and expertise. We expect potential strategic buyers
such as ArcelorMittal, Vale, Xstrata, Glencore, Noble Group, KORES, JOGMEG, Teck
Resources to expand actively in Mongolia. Following the activities in mining, logistics will be
an attractive topic. In 2011, Tembusu Investments (TIL: AIM), a logistics company, acquired
Salins Limited, a local company with assets licensed to carry out coal transportation and
other logistics services in Mongolia.

www.eurasiac.com

41
Mongolia Outlook 2012
World’s Fastest Growing Economy

31 January 2012

Infrastructure
Mongolia requires significant investments into infrastructure to support mining
development. Infrastructure may turn into the major impediment to growth. Infrastructure
problems faced by the country are reflected in an IFC Doing Business 2012 report, which
ranked Mongolia 171 among 183 economies in ‘Getting electricity’ category. For
comparison, the country is ranked 29 in ‘Protecting investors’ and 26 in ‘Registering
property’. The rankings indicate what the country needs to improve in order to realize its
considerable growth potential. Mongolia needs to provide power and water to growing
mining projects and urban areas, expand its railroad and road infrastructure.
The World Bank estimated that basic infrastructure development costs to support mining
activities in Southern Mongolia alone will be over US$5bn. Implementation of ambitious
railroad construction project may require approximately US$4.5bn in the next two to three
years for about 1,800km of new railroads. They will connect mineral deposits in Southern
Mongolia to Sainshand, where a large industrial complex is planned, and further to China
and Russia. Construction of the industrial complex in Sainshand is estimated to cost
US$10bn. The country needs to develop its water sources and increase power capacity to
support its fast developing mining sector and urban settlements.
The cost of building infrastructure will be substantial. Therefore, Mongolian government is
seeking private sector investments into infrastructure through public private partnerships
(PPPs). The Concessions Law adopted in 2010 sets the legal framework for private sector
participation in the development of infrastructure projects in Mongolia.
The government identified 121 projects to be implemented with private sector participation.
Both foreign and domestic companies can participate in the projects individually or jointly.
Concessions could be gained via open tender, competitive bidding or direct contract.
Power
In 2011 Mongolia made tangible steps to attract private investments into infrastructure
development. The State Property Committee of Mongolia (SPC) announced a number of BOT
tenders in power generation and road transportation. The year marks conclusion of the first
concession agreement in power sector. SPC and the foreign invested New Asia Mining Group
signed BOT concession agreement on Mogoin Gol Power Plant. Under the agreement the
company builds 60MW Mogoin Gol Power Plant near Mogoin Gol coal mine to provide
power to Zavkhan and Gobi Altai provinces. The power plant may also provide power to
nearby Aspire Mining coal project, when it starts production at its property in the near
future. The company will transfer the power plant to state after 20 year concession period.
Construction is estimated to cost US$110mn and expected to be completed in the next two
years.
The State Property Committee of Mongolia also started competitive selection of private
partners to build Combined Heat and Power Plant (CHP 5) in Ulaanbaatar with initial
capacity 450MW, to be expanded to over 1GW by 2020, and Power Plant in Dornod province
with initial capacity 100MW with an option to increase to 250MW.

www.eurasiac.com

42
Mongolia Outlook 2012
World’s Fastest Growing Economy

31 January 2012

Private sector initiated several projects in power generation. Clean Energy Company, a
subsidiary of Newcom Group, is implementing US$100mn wind farm project with 50MW
total capacity. The wind farm is situated about 70km southeast of Ulaanbaatar and will be
connected to central electricity grid. Construction is expected to be completed in the
autumn of 2012. Prophecy Coal has obtained all government permissions to build 600MW
power plant at Chandgana coal property. The project is still at early stages of
implementation and still needs to secure financing and negotiate a power purchase
agreement in Mongolia or abroad.
Road
In 2011 Gobi Road LLC, a subsidiary of Mongolian Mining Corporation (MMC) completed
construction of 245km paved road from MMC coal mine to Chinese border under 10 year
BOT agreement with SPC. The new road is planned to accommodate 2,000 trucks per day
and have an annual throughput capacity of 18Mt of coal. Other concession projects
announced by SPC included:
50km Narynsukhait – Shiveekhuren highway project for mining transportation and
public use
435km Tavan Tolgoi – Khanbogd – Khangi highway project for mining transportation
and public use
Ulaanbaatar – Khushig Valley New International Airport highway project for public
use
367km Altanbulag – Ulaanbaatar highway project for public use
630km Ulaanbaatar – Zamyn Uud highway project for public use
Railroad
There is a slight delay in implementation of the three stage Railway Policy adopted in June
2010. It reflects the sheer ambition of the initial plan to build thousands of kilometers of
new railroads in a matter of years. Financing railroad construction is set as a priority for the
state owned Development Bank of Mongolia. The Bank was specifically established to
finance large infrastructure, mining and industrial projects. It is planning to raise up to
US$600mn in international debt markets for domestic projects.
Construction of the new railroads may require approximately US$4.5bn. The country plans
to construct 1,766km of new railroads in south and east. Proposed routes are:
Tavan Tolgoi – Sainshand 468km
Sainshand – Khoot 450km
Khoot – Choibalsan 155km
Khoot – Nomrog 380km
Tavan Tolgoi – Gashuunsuhait 267km
Nariinsuhait – Shiveehuren 46km
It appears that the first and second stages of the Railway Policy will be implemented
simultaneously opening new trade routes to Russian and Chinese markets. The railroad
construction plan is still ambitious and financing the project remains a challenge.

www.eurasiac.com

43
Mongolia Outlook 2012
World’s Fastest Growing Economy

31 January 2012

Planned Railways in Mongolia

Source: Mongolian Railroad Policy, Eurasia Capital

Infrastructure Investment Key in 2012
Construction of new railroads expected to start in 2012 would create opportunities for
investors, construction and operating companies. The government of Mongolia is likely to
provide a concession to the private sector to build the railroad under a BOT model. Beyond
railroads, the US$10bn Sainshand Industrial Complex project may go ahead in 2012 offering
numerous opportunities for investors and contractors alike. The complex is designated to
become a super hub for processing Mongolian raw materials and producing semi and
finished products for export.
Infrastructure services to mining projects represent strong investment opportunities
through 2012 and beyond. Gobi Road LLC toll road for coal transportation in the south and
Mogoin Gol Power Plant in the north of the country are examples of opportunities that exist
in infrastructure in Mongolia. Demand for road transportation of minerals is set to rapidly
increase as the country ramps up coal output while new railroad construction is delayed.
Financing captive infrastructure for mining projects, including roads, power and water
supply may yet turn out to be the best way of capitalizing on ongoing mining boom.
Furthermore, mining settlements around major projects would require a complex of
infrastructure services beyond accommodation, power and water supply. Infrastructure
services provided by third party will allow mining companies to free capital and other
resources for mining activities. The concept is still quite new for Mongolian companies and
represents a niche yet not occupied by strong, entrenched player.

www.eurasiac.com

44
Mongolia Outlook 2012
World’s Fastest Growing Economy

31 January 2012

ANNEX 1: 2011 M&A LEAGUE TABLE
Buyer
1
2
3
4
5
6
7
8
9
10
11
12
13
14
15
16
17
18
19
20
21
22
23
24
25
26
27
28
29
30
31
32

Mongolian Mining Corp
Banpu Minerals
Goldstream
Sovereign Wealth Funds
Banpu Minerals
Hunnu Coal
Guildford Coal
Sun Clay Group and Global Com
Think Environmental
Noble Group
Guildford Coal
Origo Partners
Geological Resource Partners
Global Met Coal
Draig Resources (former CEO)
Guildford Coal
Voyager Resources
Lucky Strike Resources
Guildford Coal
Wedge Energy International
Prophecy Coal
TVN Corporation
Robe Australia
General Mining Corp
Lucky Strike Resources
Firebird Mongolia Fund
Blina Minerals
Local Mongolian Companies
Garrison International
Xanadu Mines
Haranga Resources
Kara Minerals

33
34
35

Buyer
Country
MGL
TN

TN
AUS
AUS
SNG
HK
AUS
UK
US
CN
AUS
AUS
AUS
CN
AUS
CN
CN
AUS
AUS
AUS
CN
US
AUS
MGL/US
CN
AUS
AUS
AUS

Banpu Minerals
TN
General Mining Corp
AUS
Xanadu Mines/Xanadu Metals
AUS
Mongolia
36 Solartech International Holdings
HK
37 Xanadu Mines
AUS
38 Xanadu Noble JV
AUS/HK
39 Hunnu Coal
AUS
Total
Source: Company data, Eurasia Capital estimates

www.eurasiac.com

Target
Baruun Naran Coking Coal Mine
Hunnu Coal
ZAO Zolotoy Vostok Mongolia
Gobi Coal and Energy
Hunnu Coal
Rio Tinto Minerals Developments
Mongolian company
SK Telecom Co
Azargyn Gol Chonot
Aspire Mining
Deliin Shand Project
Moly World
Blue Wolf Mongolia Holdings Corp.
MG Energy
8 coal licences
Terra Energy
Mongolian company
Mongolian companies
Alag Tevsh
Undur Tolgoi Minerals
Mongolian company
Nuurst Thermal Coal Deposit
Tsagaan Gol Exploration Licence
Uvs Basin Mongolia Coal Project
Mongolian company
Berkh Uul
BSI
Berkh Uul
Dehroy Financial Advisory
Khavtsgait coal project
Selenge Iron Ore Prooject
Amirlangui Ujin / Narsyn Hundlun
Tin Project
Hunnu Coal
Khuden Coal Deposit
Soduntag
Vangyunshing
Javhlant Coking Coal Project
Nuurstei coking coal project
Unst Khudag Coal Mine

Type

100%
100%
100%
15%
12%
70%
100%
29%
51%
3%
100%
20%
9%
35%
100%
20%
80%
80%
100%
90%
100%
100%
100%
100%
up to 75%
50%
N/A
3%
100%
100%
20%
100%

Value,
US$ mn
950
493
300
91
44
40
25
25
16
15.95
15
10
9.2
8.8
7.8
7.23
6.5
5.8
3.5
2
2
1.5
1
1
0.9
0.61
0.3
0.3
0.022
N/A
N/A
N/A

31.05.2011
17.11.2011
16.09.2011
Dec, 2011
08.03.2011
23.05.2011
08.07.2011
12.01.2011
23.06.2011
22.03.2011
08.07.2011
02.06.2011
04.08.2011
04.11.2011
17.07.2011
31.03.2011
09.05.2011
11.07.2011
09.08.2011
22.08.2011
04.05.2011
24.06.2011
12.10.2011
27.09.2011
27.04.2011
05.04.2011
17.05.2011
05.04.2011
18.08.2011
22.11.2011
11.11.2011
11.11.2011

Coal
Coal
Copper

90%
N/A
100%

N/A
N/A
N/A

07.11.2011
12.10.2011
30.03.2011

Rare earth
Coal
Coal
Coal

N/A
100%
80%
15%

N/A
N/A
N/A
N/A
2083.41

05.01.2011
22.07.2011
15.06.2011
25.01.2011

Coal
Coking coal
Gold
Coking coal
Coal
Coal
Coal

Coal
Coal
Molybdenum
Coal
Coal
Coal
Gold
Coal
Coal
Copper gold
Coal
Coal
Coal
Coal
Coal
Coal/Gold
Copper Gold
Coal
Coal
Coking coal
Iron ore
Tin

Stake, %

Date

45
Mongolia Outlook 2012
World’s Fastest Growing Economy

31 January 2012

ANNEX 2: SILK ROAD COMPOSITE INDEX COMPANIES
#

Ticker

Name

1
2
3
4
5
6
7
8
9
10
11
12
13
14
15
16
17
18
19
20
21
22
23
24
25
26
27
28
29
30
31
32
33
34
35
36
37
38
39
40
41
42
43
44
45
46
47
48
49
50
51
52
53
54
55

IVN : US
ENRC : LN
KAZ : LN
KMG : LI
CG : CN
DGO : LN
GENL : LN
975 : HK
GKP : LN
UUU : CN
ZKM : LI
HSBK : LI
KZTK : KZ
AFR : LN
DNO : NO
1733 : HK
SGQ : CN
KKB : LI
HOIL : LN
276 : HK
BUND : IQ
TTL : MO
BGEO : LI
BDSI : IQ
BBOB : IQ
GUF : AU
BROI : IQ
BNOR : IQ
SNM : CN
CCBN : KZ
WZR : CN
AKM : AU
APU : MO
BKUI : IQ
BAN : MO
OPP : LN
CPI : CN
MXP : LN
IBSD : IQ
BIME : IQ
ETG : CN
FEO : AU
SHV : MO
TPL : CN
YAK : CN
KGL : AU
BEFI : IQ
KYS : LN
BMNS : IQ
BCOI : IQ
GNF : CN
CGH : LN
TAU : LN
VOR : AU
STCM : LN

Ivanhoe Mines
Eurasian Natural Resources
Kazakhmys
Kazmunaigas Exploration
Centerra Gold
Dragon Oil
Genel Energy
Mongolian Mining Corp.
Gulf Keystone Petroleum
Uranium One
Zhaikmunai
Halyk Savings Bank
Kazakhtelecom
Afren
DNO International
Winsway Coking Coal Holdings
Southgobi Resources
Kazkommertsbank
Heritage Oil
Mongolia Energy Corp.
United Bank Of Iraq
Tavan Tolgoi JSC
Bank Of Georgia
Dar Es Salam Investment Bank
Bank Of Baghdad
Guildford Coal
Credit Bank Of Iraq
North Bank
Shamaran Petroleum Corp.
Bank CenterCredit
Westernzagros Resources
Aspire Mining
Apu JSC
Kurdistan International Bank
Baganuur JSC
Origo Partners
Condor Petroleum
Max Petroleum
Baghdad Soft Drinks
Iraqi Middle East Investment Bank
Entree Gold
Feore
Shivee Ovoo JSC
Tethys Petroleum
Mongolia Growth Group
Kentor Gold
Economy Bank For Investment
Kryso Resources
Al Mansour Bank
Commercial Bank Of Iraq
Greenfields Petroleum Corp.
Chaarat Gold Holdings
Tau Capital
Voyager Resources
Steppe Cement

56
57
58
59
60
61
62
63
64
65

HMAN : IQ
SHG : MO
BIBI : IQ
PCY : CN
FML : LN
CAML : LN
BNOI : IQ
MATD : LN
BBAY : IQ
BSUC : IQ

Mansour Hotel
Sharyn Gol JSC
Investment Bank Of Iraq
Prophecy Coal
Frontier Mining
Central Asia Metals
National Bank Of Iraq
Petro Matad
Babylon Bank
Sumer Commercial Bank

www.eurasiac.com

MCap,
US$mn
13,095.4
12,692.0
7,617.7
6,298.8
4,184.1
3,628.6
3,140.3
2,786.0
2,516.8
2,033.8
1,794.5
1,589.7
1,528.6
1,426.7
1,189.0
1,112.5
1,073.0
1,052.1
781.9
595.4
460.2
415.6
407.4
384.6
336.1
331.1
308.0
300.9
282.2
262.5
244.6
235.5
223.8
213.9
197.1
195.5
187.3
168.7
164.7
164.2
154.9
151.9
147.3
146.6
141.0
130.7
127.5
112.9
110.4
108.6
100.8
99.1
97.0
93.4
93.0

2011
Growth
22.7%
39.4%
42.6%
24.6%
9.3%
14.9%
12.0%
35.6%
1.6%
55.1%
21.1%
51.6%
7.0%
41.5%
8.1%
51.0%
50.7%
54.6%
57.4%
69.8%
13.1%
91.0%
35.6%
23.0%
86.6%
2.7%
63.3%
7.0%
68.8%
59.0%
49.5%
22.9%
111.1%
76.1%
24.8%
14.6%
60.7%
41.1%
36.4%
66.4%
64.3%
12.0%
17.7%
67.7%
457.1%
33.3%
4.6%
62.7%
8.6%
9.4%
23.3%
64.1%
12.2%
26.9%
37.4%

85.6
82.8
81.3
79.9
77.2
76.0
72.7
70.8
69.3
68.4

4.0%
8.1%
25.8%
52.6%
64.3%
37.0%
3.7%
79.7%
8.0%
1.2%

Industry
Metals & Mining
Metals & Mining
Metals & Mining
Oil and Gas
Gold
Oil and Gas
Oil and gas
Metals & Mining
Oil and gas
Energy
Oil and Gas
Bank
Telecom
Oil and gas
Oil and gas
Coal
Energy
Banks
Oil and gas
Energy
Bank
Energy
Bank
Bank
Bank
Energy
Bank
Bank
Oil and gas
Bank
Oil and gas
Metals & Mining
Beverages
Bank
Energy
Investments
Oil and Gas
Oil and Gas
Consumer Goods
Bank
Metals & Mining
Steel
Energy
Oil and Gas
Investments
Gold
Bank
Gold
Bank
Bank
Oil and Gas
Gold
Investments
Gold
Construction
materials
Hotel & Tourism
Energy
Bank
Energy
Metals & Mining
Metals & Mining
Bank
Oil and Gas
Bank
Bank

Country of
operation
Mongolia
Kazakhstan
Kazakhstan
Kazakhstan
Kyrgyzstan
Turkmenistan
Iraq
Mongolia
Iraq
Kazakhstan
Kazakhstan
Kazakhstan
Kazakhstan
Iraq
Iraq
Mongolia
Mongolia
Kazakhstan
Iraq
Mongolia
Iraq
Mongolia
Georgia
Iraq
Iraq
Mongolia
Iraq
Iraq
Iraq
Kazakhstan
Iraq
Mongolia
Mongolia
Iraq
Mongolia
Mongolia
Kazakhstan
Kazakhstan
Iraq
Iraq
Mongolia
Mongolia
Mongolia
Kazakhstan
Mongolia
Kyrgyzstan
Iraq
Tajikistan
Iraq
Iraq
Azerbaijan
Kyrgyzstan
Kazakhstan
Mongolia
Kazakhstan
Iraq
Mongolia
Iraq
Mongolia
Kazakhstan
Kazakhstan
Iraq
Mongolia
Iraq
Iraq

46
Mongolia Outlook 2012
World’s Fastest Growing Economy
66
67
68
69
70
71
72
73
74
75
76
77
78
79
80
81
82
83
84
85
86

XAM : AU
BMFI : IQ
HAR : AU
BASH : IQ
AAZ : LN
402 : HK
BEU : MO
HNTI : IQ
EAS : CN
MCH : MO
JPR : AU
ALH : CN
KCC : CN
Bank : GG
HMB : LN
CHGG : LI
RXP : LN
MSR : AU
ERD : CN
61 : HK
MOU : AU

Xanadu Mines
Mosul Bank For Devt & Invest
Haranga Resources
Ashur International Bank
Anglo Asian Mining
Mongolia Investment Group
Berkh Uul JSC
National For Tourist Invest
East Asia Minerals Corp.
Mongolian Telecom
Jupiter Energy
Alhambra Resources
Kincora Copper
Liberty Bank JSC
Hambledon Mining
Chagala Group
Roxi Petroleum
Manas Resouces
Erdene Resource Development
North Asia Resources Holding
Modun Resources
Total
Source: Bloomberg, Silk Road Management, Eurasia Capital

www.eurasiac.com

31 January 2012
66.2
57.7
57.5
56.5
55.1
54.5
52.2
52.2
51.0
50.1
49.9
46.1
42.2
41.6
38.9
38.3
35.5
34.0
33.3
32.5
32.5
79,178

38.9%
48.4%
55.5%
12.5%
54.8%
68.9%
2446.7%
12.4%
94.2%
22.9%
24.3%
52.6%
14.8%
33.3%
53.5%
47.1%
36.2%
38.3%
69.8%
75.6%
350.0%

Metals & Mining
Bank
Steel
Bank
Metals & Mining
Investments
Energy
Hotel & Tourism
Metals & Mining
Telecom
Gold
Gold
Metals & Mining
Bank
Gold
Property
Oil and Gas
Gold
Metals & Mining
Energy
Energy

Mongolia
Iraq
Mongolia
Iraq
Azerbaijan
Mongolia
Mongolia
Iraq
Mongolia
Mongolia
Kazakhstan
Kazakhstan
Mongolia
Georgia
Kazakhstan
Kazakhstan
Kazakhstan
Kyrgystan
Mongolia
Mongolia
Mongolia

47
Mongolia Outlook 2012
World’s Fastest Growing Economy

31 January 2012

ANNEX 3: SILK ROAD HONG KONG INDEX COMPANIES
#

Ticker

1
2
3
4
5
6
7

Name

975 : HK
1733 : HK
1878 : HK
276 : HK
402 : HK
1166 : HK
61 : HK

Mongolian Mining Corp.
Winsway Coking Coal Holdings
Southgobi Resources
Mongolia Energy Corp.
Mongolia Investment Group
Solartech International Holdings
North Asia Resources Holdings
Total
Source: Bloomberg, Silk Road Management, Eurasia Capital

MCap,
US$mn
2,786.0
1,112.5
1,066.2
595.4
54.5
40.2
32.5
5,687.4

2011
Growth
35.6%
51.0%
54.2%
69.8%
68.9%
81.6%
75.6%

Industry
Mining
Energy
Energy
Energy
Investments
Energy
Energy

Country of
operation
Mongolia
Mongolia
Mongolia
Mongolia
Mongolia
Mongolia
Mongolia

ANNEX 4: SILK ROAD AUSTRALIA INDEX COMPANIES
#

Ticker

1
2
3
4
5
6
7
8
9
10

Name

GUF:AU
AKM:AU
FEO:AU
KGL:AU
VOR:AU
XAM:AU
HAR:AU
JPR:AU
MSR:AU
MOU:AU

Guildford Coal
Aspire Mining
Feore
Kentor Gold
Voyager Resources
Xanadu Mines
Haranga Resources
Jupiter Energy
Manas Resouces
Modun Resources
Total
Source: Bloomberg, Silk Road Management, Eurasia Capital

www.eurasiac.com

MCap,
US$mn
331.1
235.5
151.9
130.7
93.4
66.2
57.5
49.9
34.0
32.5
1,182.7

2011
Growth
2.7%
22.9%
12.0%
33.3%
26.9%
38.9%
55.5%
24.3%
38.3%
350.0%

Industry
Energy
Energy
Metals & Mining
Metals & Mining
Metals & Mining
Energy
Energy
Oil and Gas
Metals & Mining
Energy

Country of
operation
Mongolia
Mongolia
Mongolia
Kyrgyzstan
Mongolia
Mongolia
Mongolia
Kazakhstan
Kyrgyzstan
Mongolia

48
Mongolia Outlook 2012
World’s Fastest Growing Economy

31 January 2012

ANNEX 5: SILK ROAD MONGOLIA INDEX COMPANIES
#

Symbol

Name

1
IVN:US
IVANHOE MINES
2
CG:CN
CENTERRA GOLD
3
975:HK
MONGOLIAN MINING CORP
4
1733:HK
WINSWAY COKING COAL HOLDINGS
5
1878:HK
SOUTHGOBI RESOURCES
6
276:HK
MONGOLIA ENERGY CORP
7
TTL:MO
TAVAN TOLGOI JSC
8
GUF:AU
GUILDFORD COAL
9
AKM:AU
ASPIRE MINING
10
APU:MO
APU JSC
11
BAN:MO
BAGANUUR JSC
12
OPP:LN
ORIGO PARTNERS
13
ETG:CN
ENTREE GOLD
14
SHV:MO
SHIVEE OVOO JSC
15
YAK:CN
MONGOLIA GROWTH GROUP
16
VOR:AU
VOYAGER RESOURCES
17
SHG:MO
SHARYN GOL JSC
18
PCY:CN
PROPHECY COAL
19
CAML:LN
CENTRAL ASIA METALS
20
MATD:LN
PETRO MATAD
21
XAM:AU
XANADU MINES
22
HAR:AU
HARANGA RESOURCES
23
402:HK
MONGOLIA INVESTMENT GROUP
24
MCH:MO
MONGOLIAN TELECOM JSC
25
EAS:CN
EAST ASIA MINERALS CORP
26
KCC:CN
KINCORA COPPER
27
1166:HK
SOLARTECH INTERNATIONAL HOLD
28
TVN:AU
MODUN RESOURCES
29
ERD:CN
ERDENE RESOURCE DEVELOPMENT
30
61:HK
NORTH ASIA RESOURCES HOLDING
Data as of December 31, 2011. *Since IPO Date
Source: Bloomberg, Eurasia Capital

www.eurasiac.com

MCap,
US$mn
13,110.2
4,119.2
2,785.1
1,112.2
1,065.9
595.3
415.3
316.3
233.0
223.7
197.0
194.4
152.9
147.2
118.2
92.4
82.7
78.5
75.5
70.8
65.5
56.9
54.5
50.1
49.6
42.0
40.2
34.5
33.2
32.5

2011
Growth
22.6%
8.8%
35.6%
51.0%
54.2%
69.8%
91.0%
2.7%
22.9%
111.1%
24.8%
14.6%
64.6%
17.7%
457.1%*
26.8%
8.1%
53.2%
37.0%
79.6%
38.9%
55.5%
68.9%
22.9%
94.3%
14.8%
81.6%
350.0%
69.8%
75.6%

Industry

Eurasia Capital Call

Metals & Mining
Metals & Mining
Metals & Mining
Metals & Mining
Metals & Mining
Metals & Mining
Metals & Mining
Metals & Mining
Metals & Mining
Beverages
Metals & Mining
Investments
Metals & Mining
Metals & Mining
Investments
Metals & Mining
Metals & Mining
Metals & Mining
Metals & Mining
Oil & Petrol Products
Metals & Mining
Metals & Mining
Metals & Mining
Telecommunications
Metals & Mining
Metals & Mining
Metals & Mining
Metals & Mining
Metals & Mining
Metals & Mining

HOLD
UNDER REVIEW
BUY
UNDER REVIEW
BUY
BUY
BUY
HOLD
BUY
BUY
UNDER REVIEW
BUY
BUY
UNDER REVIEW
HOLD
BUY
BUY
BUY
BUY
BUY
HOLD
HOLD
UNDER REVIEW
SELL
HOLD
UNDER REVIEW
UNDER REVIEW
SELL
BUY
UNDER REVIEW

49
Mongolia Outlook 2012
World’s Fastest Growing Economy

31 January 2012

IVANHOE MINES LTD

Eurasia Capital Call

Ivanhoe Mines Ltd (IVN) is a New York and Toronto listed international mining
company with operations focused in the Asia Pacific region. Ivanhoe Mines holds a
66% interest in the world’s largest copper gold mine Oyu Tolgoi in southern Mongolia,
a 58% interest in Mongolian coal miner SouthGobi Resources, an 59% interest in
Ivanhoe Australia, a copper gold uranium molybdenum rhenium exploration and
development company, and a 50% interest in Altynalmas Gold Ltd., a private company
developing the Kyzyl Gold Project in Kazakhstan.

Key Stock Data
Ticker
IVN:US
Price (US$)
17.72
52 Wk high (US$)
28.91
52 Wk low (US$)
11.5
Market cap (US$mn)
13,095.41
Shares outstanding (mn)
739.02
Avg d'ly turn'r (US$mn)
61.43
Performance, y o y
22.7%
Valuation Ratios
P/E
Earnings Yield
P/B
3.2
ROE
ROA
Share Price Performance, US$

HOLD

30
25
20
15
10
5
Dec 11

Nov 11

Oct 11

Sep 11

Jul 11

Aug 11

Jun 11

Apr 11

0
May 11

In September 2011 twenty MPs and several lawmakers demanded the Coalition
Government to reconsider existing agreement on the Oyu Tolgoi mine by
requesting to increase Mongolia’s stake in the project to 50% from 34%. However,
Rio Tinto and Ivanhoe Mines refused to accept proposed amendment to the
agreement. The Coalition Government issued a joint statement with the two
mining companies in which it reaffirmed its commitment to the existing investment
agreement.

35

Mar 11

IVN announced in December 12, 2011 that it had received a decision regarding
arbitration with Rio Tinto. The arbitrator determined that, if Rio Tinto triggers IVN’s
Shareholders’ Right Plan and as a result becomes an “acquiring person”, the anti
dilution rights granted to Rio Tinto in the Private Placement Agreement will
nevertheless continue to apply. Moreover, the arbitrator also determined that Rio
Tinto had not breached its obligations under the Private Placement Agreement.

Jan 11

Rio Tinto announced on January 24, 2012 that it has increased its ownership in IVN
to 51% from 49% after buying 15.1mn shares for US$298mn from two sellers. Rio
Tinto stated in the press release that it has no “current intention” of buying more
stock. Although Rio Tinto has no current intention to buy additional shares of IVN,
it reserves its right to purchase additional IVN shares depending on various factors
such as IVN’s financial condition, share prices and overall economic environment.

Feb 11

Recent Developments

Shareholders' Structure

Growth Outlook

Rio Tinto

As of January, 2012 construction of the 1st phase of Oyu Tolgoi has been 70%
completed with the 1st production line being expected to be finished in mid July 2012.
Initial production from the Southern Oyu open pit mine is expected in mid 2012;
commercial production of copper gold silver concentrate is projected to begin in the
first half of 2013.

Goldamere
Holdings
Fidelity
Management
Newstar Holdings

25.73%

IVN possesses strong fundamentals primarily on positive outlook for commodity prices
fuelled by growing demand in neighboring China and expected launch of initial
production this year. Declining financing and operating risks associated with the
flagship Oyu Tolgoi project with Rio Tinto becoming a majority shareholder in the
Company and an operator of the project should also support the share price.

Ratios and Growth Rates
Net profit margin
EPS (pence)
Gross profit margin
Sales growth rate
Balance Sheet (US$mn)
Current asset
Fixed asset
Total asset
Total liabilities
Shareholders' equity
Total liabilities & equity

2009

2010

6.3%
2009
1,054.2
250.7
1,534.7
1,055.6
479.08
1,534.7

121%
2010
1,492.0
1,386.4
3,218.5
1,402.0
1,816.4
3,218.5

3Q 2011
12%
14.3%
27.8%
3Q 2011
1,712.7
3,494.5
5,638.8
804.9
4,833.8
5,638.8

51.07%

3.08%
4.37%

Profit & Loss (US$mn)
Revenue
Gross profit
Pretax profit
Net profit
Cash Flow (US$mn)
Operating Cash flow
Investing Cash flow
Financing Cash flow
Exchange gain
Cash at the beginning
Cash at the end

Caisse De Depot
ET
Robert Friedland

4.99%
5.12%
5.64%

Others

2009
36.0
2.3
315.5
280.2
2009
183.3
190.3
955.3

2010
79.8
2.3
298.1
211.5
2010
227.3
866.4
1,458.9

3Q 2011
60.5
8.6
18.4
7.3
3Q 2011
124.5
604.5
564.094

384.1
965.8

965.8
1,264.0

1,264.0
1,410.3

Stock data as of December 31, 2011
Source: Company data, Bloomberg, Eurasia Capital

www.eurasiac.com

50
Mongolia Outlook 2012
World’s Fastest Growing Economy

31 January 2012

CENTERRA GOLD INC

Eurasia Capital Call

Centerra Gold is a Toronto listed Canadian gold producer with mining assets in Central
Asia and Mongolia. In Mongolia the Company stopped production at its Boroo mine. It
has been developing nearby Gatsuurt property.

Key Stock Data
Ticker
Price (C$)
52 Wk high (C$)
52 Wk low (C$)
Market cap (US$mn)
Shares outstanding (mn)
Avg d'ly turn'r (US$mn)
Performance, y o y
Valuation Ratios
P/E
Earnings Yield
P/B
ROE (3Q 2011)
ROA (3Q 2011)
Share Price Performance, C$

UNDER REVIEW

Mining at Boroo deposit ceased at the end of November, 2010. The Boroo mill
operation could potentially continue for a couple of years processing stockpile
material
Centerra clarified the status of its Mongolian Licenses on November 19. The
Company said that it has four licenses on the list of alluvial gold mining licenses
that may be revoked under the Water and Forests Law and that none of these
licenses are material to the Company. Furthermore, the Company reported that
the Gatsuurt hard rock mining license is not on the list of revoked alluvial licenses
and it continues constructive discussions with the Government of Mongolia to
resolve uncertainty and to obtain necessary approvals for the commissioning of the
Gatsuurt project, which has been delayed and resulted in the laying off of 250
workers on December 1.

25
20
15
10

Shareholders' Structure

11.0%

In July 2010, Centerra sold its 64% interest in the REN joint venture in Nevada for
US$34.9mn to Homestake Mining Company, which is a subsidiary of Barrick Gold
Corporation.

33.0%

Kyrgyzaltyn
Institutional

Growth Outlook

Retail

Centerra Gold has 8.2mn ounces of proven and probable gold reserves and further
4.9mn ounces of measured and indicated resources. The company is expected to
produce 640,000 660,000 ounces of gold in 2011. The long term objective is to
produce 1.5mn ounces per year based on the potential of current properties and
acquiring new prospective properties. Economic uncertainty and gold’s role as a hedge
against inflation will continue to support demand for the precious metal.
Ratios and Growth rates
Net profit margin
EPS (US$)
EPS growth rate
Sales growth rate
Balance Sheet (US$mn)
Current asset
Fixed asset
Intangible asset
Total asset
Current liabilities
Long term liabilities
Shareholders' equity
Total liabilities & equity

20.0%
18.1%

2009
8.8%
0.27
(56.5%)
7.8%
2009
532.25
412.07
129.71
1,074.03
100.08
21.53
952.42
1,074.03

2010
38.1%
1.37
407.4%
23.5%
2010
718.12
548.85
129.71
1,396.68
102.30
24.89
1,269.49
1,396.68

3Q 2011
37.7%
1.23
68.5%
46.4%
3Q 2011
856.94
622.29
129.71
1,608.94
114.14
36.54
1,458.26
1,608.94

Profit & Loss (US$mn)
Sales
Gross profit
Operating profit
Pretax profit
Net profit
Cash Flow (US$mn)
Operating Cash flow
Investing Cash flow
Financing Cash flow
Exchange Translation
Net cash flow
Cash at the beginning
Cash at the end

56.0%

2009
685.49
389.55
138.84
89.50
60.31
2009
245.57
(220.19)
1.94

2010
846.47
582.58
295.39
330.26
322.64
2010
271.43
(110.42)
(7.18)

3Q 2011
772.38
494.17
302.35
298.70
291.47
3Q 2011
367.16
(329.33)
(96.87)

27.32
149.58
176.90

153.83
176.90
330.73

(59.04)
330.73
271.69

Stock data as of December 31, 2011
Source: Company data, Bloomberg, Eurasia Capital

www.eurasiac.com

Dec 11

CG reports gold production of 678,941 ounces in 2010. Total cash cost at Kumtor
US$411/oz and at Boroo US$611/oz

14.6

Oct 11

Update of reserves and resources in February 2011. Gold reserves increased by
1.7mn ounces to 8.2mn ounces

Aug 11

In July 2011, CG announces the discovery of a significant precious and base metal
deposit on its 100% owned Altan Tsagaan Ovoo property in northeast Mongolia

Jun 11

Centerra becomes a supporting company of the Extractive Industries Transparency
Initiative (‘EITI’)

Apr 11

Flagship Kumtor mine in Kyrgyzstan achieves a continuous mining rate of 500,000t
per day in 3Q 2011

Feb 11

3Q 2011 net earnings US$83.8mn or US$0.35 per share. Gold production totaled
154,936 ounces at a total cash cost of US$556 per ounce

Dec 10

Recent Developments

CG:CN
18.00
23.69
14.22
4,184.08
236.3
10.61
9.3%

51
Mongolia Outlook 2012
World’s Fastest Growing Economy

31 January 2012

MONGOLIAN MINING CORP

Eurasia Capital Call

Mongolian Mining Corporation (MMC) is a Hong Kong listed Mongolian owned mining
company that owns and operates the Ukhaa Khudag coking coal mine located in Tavan
Tolgoi coal formation in South Gobi province of Mongolia. The mine covers an area of
2,960 hectares and holds 499.9Mt of JORC compliant measured and indicated coal
resources and 286.0Mt of proven and probable reserves. The Ukhaa Khudag coking
coal mine is the closest to Baotou, China, a major railway hub connecting Mongolian
coal to the largest steel producing provinces in China. MMC has lower operational
costs than the majority of its world wide competitors due to favorable geological
conditions and proximity to China.

Key Stock Data
Ticker
975:HK
Price (HK$)
5.84
52 Wk high (HK$)
11.5
52 Wk low (HK$)
4.94
Market cap (US$mn)
2,785.96
Shares outstanding (mn)
3,705.04
Avg d'ly turn'r (US$mn)
2.85
Performance, y o y
35.6%
Valuation Ratios
P/E
46.4
Earnings Yield
2.2%
P/B
3.7
ROE
15.6%
ROA
10.3%
Share Price Performance, HK$

BUY

Ratios and Growth Rates
Net profit margin
EPS (pence)
Gross profit margin
Sales growth rate
Balance Sheet (US$mn)
Current asset
Fixed asset
Total asset
Total liabilities
Shareholders' equity
Total liabilities & equity

2009
15.4%
0.34
42.3%
2009
30.1
83.2
113.2
69.4
43.8
113.2

2010
21.7%
1.91
40.8%
314.3%
2010
715.1
338.1
1,053.3
325.9
727.3
1,053.3

2Q 2011
14.6%
0.54
35.1%
55.3%
2Q 2011
509.2
1,129.7
1,638.8
894.1
744.7
1,638.8

Dec 11

Nov 11

Oct 11

Sep 11

Jul 11

Aug 11

Jun 11

Shareholders' Structure

Growth Outlook
Mongolian Mining Corporation’s Ukhaa Khudag coking coal mine has 499.9Mt coal, of
which 57% is coking coal. In addition, company has acquired Baruun Naran coking coal
deposit in 2011 enlarging its resource base (67% increase in reserves). Close proximity
to China ensures increasing demand for the Company’s product. Low production costs,
large scale open pit mining operations have been boosted by the completion of first
module of the Coal Handling and Preparation Plant (for 5Mt of coal per year) as well as
completion of two lane road to Gashuun Sukhait border. After successfully achieving
production target of 7Mt in 2011, we expect the Company to reach its production
targets of 10.7Mt of coal in 2012.

Apr 11

MMC announced in June that the first module of the Coal Handling and
Preparation Plant (CHPP) had been successfully commissioned by the state
authorities. All inclusive capital expenditure for the first module of CHPP, with the
capacity to process around 5Mt of coal per year, totaled approximately
US$111.6mn.

May 11

In June 2011, the Company acquired 100% interests in QGX Coal Ltd and its
indirectly owned subsidiary Khangad Exploration LLC, the holder of mining license
for the Baruun Naran coking coal deposit for a total consideration of US$464.5mn.
The total consideration may be adjusted to US$950mn depending on the total
proved and probable reserves and production of Baruun Naran mine.

12
11
10
9
8
7
6
5
4
Mar 11

On October, MMC has completed paved road construction between the Company's
Ukhaa Khudag coking coal mine and Gashuun Sukhait border of Mongolia for its
coal transport operation. Two lane heavy haul coal transport road has annual
capacity of 18Mt of coal transportation.

Jan 11

MMC has achieved its 2011 annual production target of 7Mt of coal by 23
December 2011, up from 3.9Mt produced in 2010. During the 4Q 2011, average
monthly production reached approximately 900,000 tonnes of coal. The company
aims to produce 10.7Mt of coal in 2012 and 14.7Mt in 2013.

Feb 11

Recent Developments

11.80%
5.10%
3.20%
8.30%

45.30%

Profit & Loss (US$mn)
Revenue
Gross profit
Pretax profit
Net profit
Cash Flow (US$mn)
Operating Cash flow
Investing Cash flow
Financing Cash flow
Exchange gain
Cash at the beginning
Cash at the end

6.30%
20%

2009
66.98
28.3
14.4
10.3
2009
(4.0)
(62.1)
62.7
(0.02)
3.79
0.37

MCS Holdings
Petrovis
Shunkhlai Group
EBRD
Kerry Holdings
Ancora Capital
Free float

2010
277.5
113.1
82.9
60.1
2010
69.6
(564.4)
823.5
(0.86)
0.37
328.3

2Q 2011
136.2
47.8
27.9
19.8
2Q 2011
(57.9)
(184.3)
31.5
(0.5)
328.3
116.9

Stock data as of December 31, 2011
Source: Company data, Bloomberg, Eurasia Capital

www.eurasiac.com

52
Mongolia Outlook 2012
World’s Fastest Growing Economy

31 January 2012

WINSWAY COKING COAL HOLDINGS LTD

Eurasia Capital Call

Winsway Coking Coal Holdings Limited is a Hong Kong listed company with branches in
Hong Kong, Beijing, Singapore, Macau and Australia that is engaged in the importation
and procurement of coking coal for Chinese consumers, particularly serving as an
integrated platform that offers services in procurement, transportation, storage,
processing and sales of coking coal. Winsway has strategically located and efficient
infrastructure including cross border logistics facilities at the Sino Mongolian border
crossing and strategic land reserves. These facilities involve offices, loading complex,
custom supervised stockpile areas and coal testing centers, among others. Winsway
procured 6.5Mt of coking coal into China in 2010. The Company also procures
seaborne coal from Australia, Canada, Russia and Indonesia.

Key Stock Data
Ticker
1733:HK
Price (HK$)
2.29
52 Wk high (HK$)
4.91
52 Wk low (HK$)
1.47
Market cap (US$mn)
1,112.53
Shares outstanding (mn)
3,773.18
Avg d'ly turn'r (US$mn)
3.38
Performance, y o y
50.9%
Valuation Ratios
P/E
10.65
Earnings Yield
9.4%
P/B
n/a
ROE
11.3%
ROA
5.3%
Share Price Performance, HK$

Nov 11
Dec 11

Sep 11
Oct 11

Aug 11

Winsway reached a coal supply agreement with Mongolyn Alt (MAK) LLC to secure
high quality supply. According to the agreement, starting from 2012 MAK will
supply 3Mt per year high quality coal, and the price will be based on the market
prices prevalent at the time of purchase.

Jun 11
Jul 11

In October 2011, Winsway and Peabody Energy Corporation entered into MOU to
expand the existing business relationship between the two companies. Further, in
December Peabody purchased a 5% stake in Winsway through the Hong Kong
Stock Exchange. Peabody Winsway Resources LLC, a coal exploration joint venture
between the companies, was successfully sold to C @ Limited (currently Draig
Resources) for US$7.67mn.

5
4.5
4
3.5
3
2.5
2
1.5
1
Apr 11
May 11

In November 2011, Winsway and Japan’s Marubeni Corporation agreed to acquire
Canadian metallurgical coal producer Grande Cache Coal Corp for about US$1bn.
The deal is subject to approval from majority of Grand Cache shareholders by
February 2012.

Jan 11

The company has been the subject to allegations by an unknown research house
regarding the inventories, however, the management has made sufficient efforts to
respond to conference calls and has denied the allegations.

Feb 11
Mar 11

Recent Developments

UNDER REVIEW

Shareholders' Structure

The company issued US$500mn 5 year 8.5% notes with semi annual payments in
April, 2011.
Growth Outlook
Winsway procures over 50% of the Mongolian Coal exports into China, and is the
largest coking coal off taker in Mongolia. The sources for growth will come from the
significant increase in coal exports from Mongolia into China as the development of
Tavan Tolgoi progresses and Chinese demand for coking coal is expected to grow. The
major coal players Mongolia Mining Corp., SouthGobi Resources have agreements with
the company.

1%
5% 4%
6% 5%

36%
43%

Winsway Resources
Holding
Winsway Intl Petrole
Peabody Energy
Corp.
Winstar Capital
Group
Goldman Sachs
Group
Yong Cui
Other Shareholders

The company expressed its intention to proceed with the plans of Grande Cache
purchase. However, this may have contributed to the price volatility/decline in the
short run as Winsway may now be exposed to additional uncertainties.
Ratios and Growth Rates
Net profit margin
EPS(HK$)
EPS growth rate
Sales growth rate
Balance Sheet (HK$mn)
Current asset
Fixed asset
Total asset
Current liabilities
Long term liabilities
Shareholders' equity
Total liabilities & equity

2009
9.3%
0.250
92.3%
373%
2009
3,951
447
4,498
3,354
1,144
4,498

2010
10.0%
0.352
38.4%
75.5%
2010
7,662
474
9,123
2,418
160
6,545
9,123

2Q 2011
12.1%
0.215
n/a
n/a
2Q 2011
12,881
646
15,409
4,236
3,972
7,201
15,409

Profit & Loss (HK$mn)
Sales
Gross profit
Pretax profit
Net profit
Cash Flow (HK$mn)
Operating Cash flow
Investing Cash flow
Financing Cash flow
Exchange gain
Net cash flow
Cash at the beginning
Cash at the end

2009
5,283
961
561
491
2009
(353)
(647)
1,165
0
165
112
277

2010
9,272
2,118
1,180
929
2010
47
(1,056)
3,569
57
2,560
277
2,894

2Q 2011
6,705
1,418
1,057
811
2Q 2011
687
(681)
2,993
78
2,791
2,894
5,763

Stock data as of December 31, 2011
Source: Company data, Bloomberg, Eurasia Capital

www.eurasiac.com

53
Mongolia Outlook 2012
World’s Fastest Growing Economy

31 January 2012

SOUTHGOBI RESOURCES LTD

Eurasia Capital Call

SouthGobi Resources (SGQ) is a Hong Kong listed company engaged in coal mining in
Mongolia. The company owns three coal projects in Mongolia: company’s producing
flagship mine Ovoot Tolgoi, and two development projects, the Soumber Deposit and
Ovoot Tolgoi Underground Deposit. SGQ controls 12 exploration licenses in southern
Mongolia. Currently, SGQ produces three coal products: semi soft coking coal, medium
ash coal (screened) and a higher ash/sulphur coal (screened) at Ovoot Tolgoi mine and
plans to produce a hard coking coal at Soumber.

Key Stock Data
Ticker
Price (C$)
52 Wk high (C$)
52 Wk low (C$)
Market cap (US$mn)
Shares outstanding (mn)
Avg d'ly turn'r 6M (US$mn)
Performance, y o y
Valuation Ratios
P/E
Earnings Yield
P/B
ROE
ROA
Share Price Performance, C$

BUY

Ratios and Growth Rates
Net profit margin
EPS (pence)
Gross profit margin
Sales growth rate
Balance Sheet (US$mn)
Current asset
Fixed asset
Total asset
Total liabilities
Shareholders' equity
Total liabilities & equity

2009

2010

3Q 2011
92.4%

18.4%
1053%
2009
409.2
91.6
560.7
563.5
2.80
560.7

2.9%
121%
2010
575.9
293.1
961.9
282.9
678.89
961.9

34.0%
817.%
3Q 2011
394.4
500.9
954.9
213.6
741.30
954.9

Shareholders' Structure
IVANHOE MINES
LTD/CA
LAND BREEZE II
SARL
DWS
INVESTMENT SA

21.7%

4.9%

Profit & Loss (US$mn)
Revenue
Gross profit
Pretax profit
Net profit
Cash Flow (US$mn)
Operating Cash flow
Investing Cash flow
Financing Cash flow
Exchange gain
Cash at the beginning
Cash at the end

57.7%

13.8%

TD ASSET
MANAGEMENT
FIDELITY
MANAGEMENT
Others

2009
36.0
6.6
86.2
110.8
2009
35.2
105.1
487.3

2010
79.8
2.3
118.9
116.2
2010
57.8
217.7
410.2

3Q 2011
60.5
20.6
56.8
55.9
3Q 2011
18.8
45.7
12.4

10.3
357.3

357.3
492.0

492.0
205.8

Stock data as of December 31, 2011
Source: Company data, Bloomberg, Eurasia Capital

www.eurasiac.com

Dec 11

Oct 11

Nov 11

Sep 11

Jul 11

Aug 11

In 2011 Mongolia overtook Australia as the largest coking coal exporter to China. We
estimate that in 2011 Mongolia met approximately 38% of China’s coking coal imports
demand. SGQ will be one of the players in Mongolia who will benefit from growing
demand in China for high quality coking coal. In early 2012 the company is expected to
complete construction of wet washing plant which provides an annual wet washing
capacity of approximately 3.5Mt of input raw coal. Raw higher ash and medium ash
coals from the Ovoot Tolgoi mine will be washed at this facility and washed coal will
generally meet semi soft coking coal specifications. Moreover, to further add value to
the products, SGQ commenced construction of a basic coal handling facility including
dry air separation. The coal handling facility will remove ash (waste rock) and enable
the blending of coals from different seams to create higher value products. Initially
two dry air separation modules will be included in the facility with combined capacity
to process 6Mt a year. Capital expenditure for the coal handling facility is US$45mn
and completion is scheduled for early 2012. We believe that with strong demand from
China and SGQ’s plans to increase shareholders value by enhancing product value will
put the company into strong position to capitalize on China’s demand and realize
strong revenues in 2012.

Jun 11

Growth Outlook

29.1
3%
1.6

18
16
14
12
10
8
6
4
2
0
Apr 11

In March 2011, SGQ announced updated NI 43 101 compliant coal Resources and
Reserves for its Ovoot Tolgoi Complex prepared by Minarco MineConsult.
Measured and Indicated Resources increased approximately 7% to 266Mt while
Inferred Resources surged approximately 190% to 97.1Mt of coal.

May 11

On July 6, 2011 the company received mining license (MV 016869) for the Soumber
Deposit. The deposit is about 20km east of Ovoot Tolgoi mine and contains NI 43
101 compliant 61.4Mt of Measured and Indicated resources and 65.8Mt of inferred
resources.

Jan 11

SGQ announced on January 18, 2012 that in 2011 it has produced 4.57Mt (up +64%
y o y) of coal and sold 4.02Mt (up +58% y o y) to China. In 2012 the Company plans
to produce 6.5 7Mt of ROM coal with salable product reaching up to 5.5Mt.

Feb 11
Mar 11

Recent Developments

1878:HK
6.00
16.64
5.54
1,066.21
181.81
0.52
50.7%

54
Mongolia Outlook 2012
World’s Fastest Growing Economy

31 January 2012

MONGOLIA ENERGY CORP LTD

Eurasia Capital Call

Mongolia Energy Corporation (MEC) is a Hong Kong listed energy and resource
developer operating in Mongolia and China. Main assets including coal, ferrous and
non ferrous metals concessions are located in western Mongolia. The company is
focused on developing the 600ha Khushuut coal mine in Mongolia.

Key Stock Data
Ticker
Price (HK$)
52 Wk high (HK$)
52 Wk low (HK$)
Market cap (US$mn)
Shares outstanding (bn)
Avg d'ly turn'r (US$mn)
Performance, y o y
Valuation Ratios
P/E
Earnings Yield
P/B
ROE (2011)
ROA (2011)
Share Price Performance, HK$

BUY

Growth Outlook
MEC controls 336,506ha of concession areas in western Mongolia. It is focused on
600ha Khushuut mine. We expect commercial production at Khushuut to start in 2012.
The mine has about 141.5mn tonnes of JORC compliant coal resources. The company is
targeting fast growing Xinjiang region of China for its coking coal. Demand for coking
coal is expected to grow from 15.8Mt in 2010 to 25 30Mt in 2015. MEC is positioned
well to supply coking coal to Xinjiang market. It is planning to produce 8Mt/annum in
the next couple of years.

2
1.5
1
0.5
Dec 11

Oct 11

Nov 11

Sep 11

Jul 11

Aug 11

0
Jun 11

4Q 2010 MEC commenced trial production and has since continued to ship batches
of raw coking coal to Baosteel Bayi.

3

Apr 11

In May 2011, MEC issued HK$2bn 3% coupon convertible note due 2014. The
proceeds to be used to redeem the 2008 Note in full. Conversion price is set at
HK$2.00 per conversion share

0.3
2.0%
1.6%

2.5

May 11

The company disclosed that Mongolian Government temporary suspended two
mining licences of about 525ha situated 85km southeast of Khushuut mine due to
company not fully meeting the filing requirement of geological information. One
exploration licence for 1,415ha area located 4km south of Khushuut is expected to
expire in 2012. No substantial value has been assigned to the licences and there is
no material impact on company asset value and operation, according to MEC

Mar 11

Interim report for September, 2011 revealed net income HK$183.71mn for the
period. It was due to a HK$390 fair value gain on convertible notes caused by
decline in MEC’s share price and FX gain

Jan 11
Feb 11

MEC completed construction of the 311km paved Khushuut Road in November
2011. The road connects Khushuut mine to Yarant (Mongolia side) and
Takeshensken border (Xinjiang side). Mongolian Government approved the use of
the road for coal transportation. The paved road shortens travel time to the border
from 8 to 4 hours

Dec 10

Recent Developments

276:HK
0.70
2.54
0.46
595.45
6.61
4.23
69.8%

Shareholders' Structure
Mr. Lo
19.5%
46.8%

Recent Interim Report 2011 disclosed that run of mine Khushuut coal contains 40%
ash. Ash could be reduced to 27% with dry screening the company reported. The
company needs funds for coal processing facilities and further exploration activities.

Dr. Cheng

6.0%

Golden Infinity
Dato Dr. Cheng

18.1%

Dragon Noble
Public

4.8%

4.9%

In our view, the company equity was oversold in 2011. With the start of coal output in
2012, the upside may prove significant.

Ratios and Growth rates
Net profit margin
EPS (HK cents)
EPS growth rate
Sales growth rate
Balance Sheet (HK$mn)
Current assets
Fixed assets
Intangible assets
Total assets
Current liabilities
Long term liabilities
Shareholders' equity
Total liabilities & equity

2009
n/a
(5.22)
n/a
n/a
2009
334.25
14,835.70
0.88
15,169.95
311.18
1,709.80
13,148.97
15,169.95

2010
n/a
(5.02)
n/a
n/a
2010
111.04
15,796.22
1.11
15,907.26
2,131.21
701.90
13,074.16
15,907.26

2Q 2011
n/a
(2.70)
n/a
n/a
2Q 2011
76.46
16,050.09
0.74
16,126.55
463.18
2,403.77
13,259.60
16,126.55

Profit & Loss (HK$mn)
Sales
Gross profit
Operating profit
Pretax profit
Net profit
Cash Flow (HK$mn)
Operating Cash flow
Investing Cash flow
Financing Cash flow
Exchange Translation
Net cash flow
Cash at the beginning
Cash at the end

2009
n/a
n/a
(273.63)
(248.52)
(286.38)
2009
(162.13)
(383.90)
0.21
6.22
(545.81)
660.89
121.30

2010
n/a
n/a
(381.12)
(310.75)
(261.60)
2010
(193.54)
(606.42)
682.35
6.49
(117.61)
121.30
10.18

2Q 2011
n/a
n/a
(203.44)
178.35
183.71
2Q 2011
(63.98)
(248.5)
317.3
(5.20)
4.80
10.18
9.78

* Financial year ends March 31. Stock data as of December 31, 2011
Source: Company data, Bloomberg, Eurasia Capital

www.eurasiac.com

55
Mongolia Outlook 2012
World’s Fastest Growing Economy

31 January 2012

TAVAN TOLGOI JSC

Eurasia Capital Call

Tavan Tolgoi JSC (TTL) is one of the largest coal producers and exporters in Mongolia.
TTL’s mine is located 250km north of China. The local administration owns 51% of the
Company and around 4% of shares are on free float. TTL’s 270ha license area is located
within 6.4Bt Tavan Tolgoi coking coal deposit area. The Company started exporting
coking coal to China in 2004. In line with our expectations, TTL increased its coal
production to 6.1Mt in 2011 from 5.2Mt in 2010. TTL employs about 200 people.

Key Stock Data
Ticker
TTL:MO
Price (MNT)
11,000
52 Wk high (MNT)
14,390
52 Wk low (MNT)
5,760
Market cap (US$mn)
415.3
Shares outstanding
52,665,200
Avg d'ly turn'r (MNTmn)
18.2
Performance, y o y
91.0%
Valuation Ratios
P/E (2011e)
7.2
P/E (2012f)
6.4
P/B (3Q 2011)
5.8
ROE (3Q 2011)
69.9%
ROA (3Q 2011)
53.5%
Share Price Performance, MNT

BUY

The Company produces high quality coal with a calorific value of 6,500 7,500 kcal/kg,
with ash content of below 20% and sulfur content of 0.5%. Coking coal makes up to
60% of the deposit, according to the Company. Currently, there is no independent
verification of reserves.
Recent Developments
In 2011, the Company drilled 14 holes in its license area for detailed reserve
estimate and the laboratory data is expected to be received in a few months. TTL
expects the reserve will be about 90Mt.

15,000
12,000
9,000
6,000

Nov 11

Jul 11

Sep 11

May 11

Jan 11

Mar 11

Nov 10

Jul 10

TTL is considering to install a coal conveyer system as its open pit is reaching 60m
depth. The Company also had preliminary negotiations with Chinese and US investors
on the construction of a coal washing plant. TTL projects that the conveyer system and
washing plant will be built within the next five years.

Jan 10

The Company is preparing new feasibility study on increasing annual capacity to 8Mt.

Sep 10

3,000

May 10

TTL’s coal output increased at CAGR 50% during 2006 2011, reaching 6.1Mt. China is
the primary market, accounting for over 98% of TTL’s sales. During the past five years,
sales grew more than 20 times and net profit increased more than 15 times. Total
sales are estimated to reach MNT190bn and net income MNT80bn for 2011. We
expect coal exports to increase by another 1Mt to 7Mt in 2012.

Mar 10

Growth Outlook

Shareholders' Structure

Currently, TTL sells its coal at mine gate with a discount. We see considerable upside
potential in sales revenue and earnings as the Company realizes higher prices for its
product in the coming years.

4.0%
Provincial
Administration
21.0%

Ajnai Corporation
51.0%

Eermel JSC

24.0%
Other
Shareholders

Ratios and Growth rates
Net profit margin
EPS (MNT)
EPS growth rate
Sales growth rate
Balance Sheet (MNTmn)
Current asset
Fixed asset
Intangible asset
Total asset
Current liabilities
Long term liabilities
Shareholders' equity
Total liabilities & equity

2009
45%
81,178
165%
100%
2009
58,894
4,885
56
58,835
5,919

2010
45%
145,306
79%
77%
2010
111,825
6,669
68
118,562
18,900

3Q 2011
44%
1,323
nm
nm
3Q 2011
123,866
6,219
81
130,166
30,403

52,917
58,835

99,662
118,562

99,763
130,166

Profit & Loss (MNTmn)
Sales
Gross profit
Operating profit
Pretax profit
Net profit
Cash Flow (MNTmn)
Operating Cash flow
Investing Cash flow
Financing Cash flow
Exchange gain
Net cash flow
Cash at the beginning
Cash at the end

2009
95,436
55,497
55,030
56,495
42,753
2009
22,475
(21)
(6,433)
(347)
15,674
5,024
20,697

2010
170,469
107,504
106,850
102,510
76,526
2010
95,922
(85)
(19,933)
(4,347)
71,557
20,697
92,255

3Q 2011
157,823
93,323
92,643
92,472
69,701
3Q 2011
2,114
(47,886)
(935)
(46,706)
92,255
45,549

Stock data as of December 31, 2011
Source: MSE, Eurasia Capital

www.eurasiac.com

56
Mongolia Outlook 2012
World’s Fastest Growing Economy

31 January 2012

GUILDFORD COAL LTD

Eurasia Capital Call

Guildford Coal (GUF) is an ASX listed exploration company with coal assets in Mongolia
and Australia. The company was listed on ASX in July 2010 and at that time the
company held coal assets only in Australia. The company’s Australian coal assets
include Hughenden, Sierra, Kolan, Sunrise and Monto exploration projects located in
Queensland. In March 2011 the company announced the partial acquisition of Terra
Energy LLC, a Mongolian based company that holds coking and thermal coal
exploration licenses in the South Gobi and Middle Gobi provinces in Mongolia. The
company’s South Gobi Project is located approximately 50 km east of two operating
mines, Qin Hua MAK’s Nariin Sukhait mine and Southgobi Resources’ Ovoot Tolgoi
mine which are located approximately 40km from the Mongolian Chinese border. The
Middle Gobi project is located approximately 200km south of Ulaanbaatar and over
200km west from the Mongolian railway line.

Key Stock Data
Ticker
Price (A$)
52 Wk high (A$)
52 Wk low (A$)
Market cap (US$mn)
Shares outstanding (mn)
Avg d'ly turn'r (US$mn)
Performance, y o y
Valuation Ratios
P/E
P/E (2012f)
P/B
ROE
ROA
Share Price Performance, A$

HOLD

1.2
1.0
0.8
0.6

15.09%
5.87%
46.46%
9.29%
11.19%
12.10%

Ratios and Growth Rates
Net profit margin
EPS (A$cents)
EPS growth rate
Sales growth rate
Balance Sheet (A$’000)
Current asset
Fixed asset
Intangible asset
Total asset
Current liabilities
Long term liabilities
Shareholders' equity
Total liabilities & equity

2009
n/a
n/a
n/a
n/a
2009
n/a
n/a
n/a
n/a
n/a
n/a
n/a
n/a

2010
n/a
n/a
n/a
n/a
2010
n/a
n/a
n/a
n/a
n/a
n/a
n/a
n/a

2011
n/a
(1.23)
n/a
n/a
2011
34,889
89,145
124,034
12,057
111,977
124,034

Nov 11
Dec 11

Shareholders' Structure

Growth Outlook
The relentless economic growth in China and other emerging markets around the
world are creating increased demand for various commodities such as coal among
others and expected to continue to do so in coming decades. As global engine of
economic growth is shifting towards China and Asia resource companies such as
Guildford Coal are poised to take advantage of this growth.

Sep 11
Oct 11

Aug 11

Jun 11
Jul 11

0.4
Apr 11
May 11

In late December 2011, the company announced that it intersected significant coal
seams with an interpreted 13.4m of net coal from the Permian Betts Creek Beds
across 3 main seams between 242m and 281m depth, which forms part of the
company’s White Mountain Project in Australia.

n/a
n/a
2.6
4.3%
3.9%

1.4

Jan 11

In August 2011, the company’s subsidiary Terra Energy LLC completed acquisition
of 100% stake in Alag Tevsh LLC which holds coal exploration license in Gobi region
for US$3.5mn. According to the company’s statement the independent geologists
developed exploration target of up to 122Mt of coal on the area under the license.
In September 2011, the company increased its ownership stake in FTB Pty Ltd from
80% to 100%. FTB controls a 100% interest in a number of tenements which makes
up approximately 60% of the Hughenden coal project (in Australia) by area. In
October, the company announced maiden JORC resource of 925Mt Hughenden
project. Furthermore, the company announced maiden JORC resources of 63.1Mt
and 221Mt in South Gobi and Middle Gobi projects in Mongolia.

Feb 11
Mar 11

Recent Developments

GUF:AU
0.75
1.37
0.62
316.3
413.5
1.1
2.74%

Profit & Loss (A$’000)
Sales
Gross profit
Operating profit
Pretax profit
Net profit
Cash Flow (A$’000)
Operating Cash flow
Investing Cash flow
Financing Cash flow
Exchange gain
Net cash flow
Cash at the beginning
Cash at the end

2009
n/a
n/a
n/a
n/a
n/a
2009
n/a
n/a
n/a
n/a
n/a
n/a
n/a

Thechairmen1
Pty
Och Ziff Capital
Management
Regal Funds
Management
Springsure
Mining
Credit Suisse
Other
shareholders

2010
n/a
n/a
n/a
n/a
n/a
2010
n/a
n/a
n/a
n/a
n/a
n/a
n/a

2011

(5,924)
(3,794)
(4,837)
2011
(3,000)
(16,754)
53,524
(1.1)
33,769
33,768

* Financial year ends June 30. Stock data as of December 31, 2011
Source: Bloomberg, Eurasia Capital

www.eurasiac.com

57
Mongolia Outlook 2012
World’s Fastest Growing Economy

31 January 2012

ASPIRE MINING LTD

Eurasia Capital Call

Aspire Mining Limited (AKM) is an early exploration company with a primary focus on
Mongolia. Aspire owns 100% of the Ovoot Coking Coal project, the Nuramt project, the
Jilchigbulag Coal project, and 70% of the Zavkhan Iron Ore project. Aspire Mining also
holds a 49% stake in the Windy Knob gold and base metal project in Western Australia.

Key Stock Data
Ticker
Price (A$)
52 Wk high (A$)
52 Wk low (A$)
Market cap (US$mn)
Shares outs (mn)
Avg d'ly turn'r (US$mn)
Performance, y o y
Valuation Ratios
P/E
Earnings Yield
P/B
ROE
ROA
Share Price Performance, A$

BUY

Recent Developments
The Ovoot Coking Coal Project with 330Mt of JORC coal resources, 80% of
which is measured and indicated coal, has been the primary activity of Aspire
during 2011. The company completed the 2011 drilling program with additional
94 holes for 17,700 meters, and expects 16,500meters of drilling throughout
2012. The Ovoot Basin is about 550km east of Erdenet and the Nuramt Project
is located almost linearly from Ovoot to the Erdenet rail link, providing good
transportation potential.

0.8
0.6
0.4

Strong cash position (96% cash of current assets not including subsequent financing
and 2.7x of net losses in 2011), upside potential to increase the JORC compliant
resources of the Ovoot project (as only 20% of the license area drilled) will support
growth. AKM plans to announce upgraded resource and reserve estimate in March
2012. Coal analysis demonstrated high indicative yields from washing the coal, with
the washed product being a high vitrinite and low ash coking coal. The company also
plans to conduct additional work on the other projects.
AKM plans to develop the Ovoot Project in 2 Stages. In Stage 1, starting from 2013 we
expect that the company would truck annually 0.5Mt to 1Mt of coking coal from the
Ovoot Project to the Erdenet rail station in Mongolia from where it plans to ship via
railway to customers in Russia and in Asia Pacific region. In Stage 2, we expect that the
company completes railway construction by 2018 and reach full production capacity of
12Mt of high quality washed premium coking coal by 2020. We estimate that the total
capital expenditure including railway infrastructure (US$1.1bn) and washing plant
(US$336mn) will be about US$1.5bn.

Ratios and Growth Rates
Net profit margin
Loss per share (AUS¢)
Loss per share growth rate
Sales growth rate
Balance Sheet (A$'000)
Current asset
Long term asset
Total asset
Current liabilities
Long term liabilities
Shareholders' equity
Total liabilities & equity

2009
n/a
(0.51)
n/a
n/a
2009
1,043.2
1,149.1
2,192.4
48.4

2010
n/a
(0.40)
(21.6%)
n/a
2010
5,765.3
11,521.7
17,286.9
3,679.7

2011
n/a
(0.93)
132.5%
n/a
2011
12,520.8
16,685.9
29,206.8
891.9

2,143.9
2,192.4

13,607.3
17,286.9

28,314.9
29,206.8

Profit & Loss (A$'000)
Sales
Gross profit
Pretax profit
Net profit
Cash Flow (A$'000)
Operating Cash flow
Investing Cash flow
Financing Cash flow
Exchange gain
Net cash flow
Cash at the beginning
Cash at the end

Nov 11
Dec 11

Sep 11
Oct 11

Aug 11

Growth Outlook

Jun 11
Jul 11

0.2
Apr 11
May 11

In April 2011, Aspire confirms high quality of raw coking coal from its 2010
drilling program with 19.5% ash, 1.2% sulfur, 26.5% volatile matter, and 6,668
kcal/kg. Later in June, following wash yield analysis AKM raises its coking coal
production target from 10.5Mtpa to 12Mtpa.

1

Jan 11

AKM raised AUS$32.5mn via institutional placement, and the proceeds to be
used for exploration at Ovoot, completion of feasibility studies, and working
capital.

n/a
n/a
6.8
(15.9%)
(15.4%)

1.2

Feb 11
Mar 11

AKM and Noble Group, one of the world’s largest commodity trader and
logistics companies, have entered into an Alliance Agreement on marketing and
logistics on Ovoot. Noble has acquired just over 8% stake in AKM in several
transactions in 2011.

AKM:AU
0.34
1.14
0.275
235.48
620.59
0.64
22.9%

Shareholders' Structure
AKM Directors
30%

20%

SouthGobi
Resources Ltd.
5%

Noble Group
Mongolian
Vendors

17%
28%

Others

2009

2010

2011

(358.5)
(5,263.2)
2009
(554.1)
(1,966.6)
1,231.5

(879.4)
(879.4)
2010
(251.9)
(2,043.9)
6,953.2

(1,289.2)
2,297.3
1,008.1

4,657.3
1,008.1
5,665.4

(4,490.1)
(4,490.1)
2011
(2,517.0)
(10,851.7)
19,881.2
(156.5)
6,512.5
5,665.4
12,021.3

* Financial year ends June 30. Stock data as of December 31, 2011
Source: Company data, Bloomberg, Eurasia Capital

www.eurasiac.com

58
Mongolia Outlook 2012
World’s Fastest Growing Economy

31 January 2012

APU JSC

Eurasia Capital Call

APU (APU) is the largest alcoholic beverage company in Mongolia. Established in 1924,
APU was one of the first companies privatized in the 1990s. The Company produces
spirits, vodka, beer, pure water, soft drinks and milk and holds over 50% of the market
share for beer and vodka. APU’s current beer factory capacity is 50mn liters per year,
with utilization close to 100%. The Company supplies drinking water (approx. 7 8
tonnes per day) to Oyu Tolgoi, the world’s largest untapped copper gold mine
currently being developed by Ivanhoe Mines.

Key Stock Data
Ticker
APU:MO
Price (MNT)
4,200
52 Wk high (MNT)
4,200
52 Wk low (MNT)
1,990
Market cap (US$mn)
223.7
Shares outstanding
74,287,700
Avg d'ly turn'r (MNTmn)
28.0
Performance, y o y
111.1%
Valuation Ratios
P/E (2011e)
12.8
P/E (2012f)
11.1
P/B (3Q 2011)
4.7
ROE (3Q 2011)
28.8%
ROA (3Q 2011)
16.4%
Share Price Performance, MNT

BUY

4,000
3,000
2,000

Nov 11

Jul 11

Sep 11

May 11

Jan 11

Mar 11

Nov 10

1,000

Jul 10

We believe the outlook for APU in 2012 is positive. The main drivers of growth are
internal factors of its expertise it holds in the beverages market, modern production
facilities, investments made to expand capacity, growing profits and efficient
distribution network with over 6000 outlets, and the market (external) factor of strong
demand.

5,000

Sep 10

As of 3Q 2011, the Company generated MNT19.7bn profit, and we estimate the total
2011 profit meets our estimate of MNT24.4bn. The increased profit will provide the
Company with much flexibility to expand its activities further in beverage production
and to other fields.

May 10

There is high demand for beverages and branded alcoholic drinks in Mongolia.
Domestic demand is expected to increase further thanks to rapid growth in income.

Jan 10

Growth Outlook

Mar 10

APU currently exports its products to South Korea, Japan, Germany and plans to export
its products to the U.S.A., Europe and Asia. The Company has already registered the
"Chinggis Khan" vodka trademark in the U.S.A. and Europe.

Shareholders' Structure
8%
Management
Other
Shareholders

92%

Ratios and Growth Rates
Net profit margin
EPS (MNT)
EPS growth rate
Sales growth rate
Balance Sheet (MNTmn)
Current asset
Fixed asset
Intangible asset
Total asset
Current liabilities
Long term liabilities
Shareholders' equity
Total liabilities & equity

2009
9%
109
209%
162%
2009
36,159
35,683
17
71,858
29,040
10,742
32,077
71,858

2010
16%
265
144%
41%
2010
37,564
58,963
4
96,531
19,454
27,093
49,985
96,531

3Q’11e
16%
256
nm
nm
3Q 2011
60,266
55,714
3
115,983
28,894
21,033
66,056
115,983

Profit & Loss (MNTmn)
Sales
Gross profit
Operating profit
Pretax profit
Net profit
Cash Flow (MNTmn)
Operating Cash flow
Investing Cash flow
Financing Cash flow
Exchange gain
Net cash flow
Cash at the beginning
Cash at the end

2009
86,867
19,806
13,341
10,818
8,070
2009
7,018
(81)
6,875
(298)
(237)
n/a
1,663

2010
122,132
36,406
24,191
25,816
19,717
2010
7,889
21 396
17,177
(257)
3,412
1,663
5,075

3Q’11e
117,976
35,167
23,368
24,938
19,046
3Q 2011
n/a
n/a
n/a
n/a
n/a
n/a
n/a

Stock data as of December 31, 2011
Source: MSE, Eurasia Capital

www.eurasiac.com

59
Mongolia Outlook 2012
World’s Fastest Growing Economy

31 January 2012

BAGANUUR JSC

Eurasia Capital Call

Baganuur (BAN) is the largest supplier of coal to the Mongolian domestic market,
supplying approximately 50% of total demand. BAN supplies 100% of demand to
Mongolia’s Thermal Power Plant (TPP) 2 and TPP 3 and 50% of demand to TPP 4,
Erdenet TPP and Darkhan TPP. The total initial estimated resources are 600Mt of coal
with a calorific value of 3,000 3,600kcal/kg. So far, the Company exploited over 80Mt
from the deposit.

Key Stock Data
Ticker
BAN:MO
Price (MNT)
13,100
52 Wk high (MNT)
41,780
52 Wk low (MNT)
9,000
Market cap (US$mn)
197.0
Shares outstanding
20,974,360
Avg d'ly turn'r (MNTmn)
39.7
Performance, y o y
24.8%
Valuation Ratios
P/E (3Q11)
nm
P/E (2011e)
nm
P/B (3Q 2011)
nm
ROE (3Q 2011)
nm
ROA (3Q 2011)
6.1%
Share Price Performance, MNT

UNDER REVIEW

In 1996 2004, the Mongolian Government implemented a project to modernize and
expand production of the mine using long term loans of US$31.1mn and US$19.8mn
from the World Bank and the Japanese Government, respectively. As a result of the
project, exploitation capacity reached 4Mt per year. Since, the Company has been
extracted about 3Mt of coal per year depending on demand and operational
constraints. It is estimated that BAN produced 3.4Mt in 2011.
75% of the Company is owned by the Government and less than 10% is on free float.
As the Company sells the coal at state controlled price, it wasn’t able to generate profit
from its operations in the past.
However, lately the fact that the Company has disputes with other legal entities in the
Baganuur deposit license areas has been revealed. No detailed information from the
Company creates much uncertainty on the BAN’s future, and we view that the fact had
an influence on BAN share performance in the past few months.
Recent Developments

50,000
40,000
30,000
20,000

Nov 11

Jul 11

Sep 11

May 11

Jan 11

Mar 11

Nov 10

Jul 10

Sep 10

May 10

Jan 10

Mar 10

10,000

BAN was included in the 2012 Privatization Plan approved by the Mongolian
Parliament in 2010. The Government plans to further privatize 24% of the
Company by offering additional shares while retaining a 51% controlling stake.
Accordingly, in October 2011, BAN announced the tender offer to choose technical
and financial advisors for the assessment of other project developments including
coal to liquid, power plant and for the additional share offering.

Shareholders' Structure

Growth Outlook
According to the last information, BAN will supply 30% of the coal consumption of the
planned TPP 5. We estimate that BAN’s production volume will increase gradually until
the TPP is built, and as the TPP became fully operational by 2016 additional 1Mt coal
will be required from BAN. We view that BAN will remain as the most important player
in the domestic thermal coal market for a long.

10.7%
State
14.3%
Firebird
Management
Other
Shareholders

75.0%

The vitally important factor for BAN’s future is coal price. Though, in 2010, the
Parliament ordered the Government to implement a policy to shift energy sector
companies to a market economy principal by 2014, it remained unclear that whether
coal price will be liberalized from the state control.
If the additional offering will succeed, the private ownership percentage of the
Company will increase up to 49%, which we believe that give power to the private
owners to have influential voice regarding coal price deregulation to the state.
Ratios and Growth Rates
Net profit margin
EPS (MNT)
EPS growth rate
Sales growth rate
Balance Sheet (MNTmn)
Current asset
Fixed asset
Intangible asset
Total asset
Current liabilities
Long term liabilities
Shareholders' equity
Total liabilities & equity

2009
18%
(435)
nm
15%
2009
31,272
43,584
617
75,472
13,346
78,778
(16,652)
75,472

2010
13%
386
nm
26%
2010
32,886
48,478

2011e
nm
(241)
nm
10%
3Q 2011
35,740
47,531

81,364
10,261
67,402
3,701
81,364

83,272
20,680
76,196
(13,604)
83,272

Profit & Loss (MNTmn)
Sales
Gross profit
Operating profit
Pretax profit
Net profit
Cash Flow (MNTmn)
Operating Cash flow
Investing Cash flow
Financing Cash flow
Exchange gain
Net cash flow
Cash at the beginning
Cash at the end

2009
49,483
5,256
701
(9,121)
(9,121)
2009
(3,468)

2010
62,546
7,242
(1,121)
8,112
8,093
2010
1,892

3,220
35
(213)
2,303
2,090

(2,350)
(730)
2,090
1,359

2011e
68,801
7,966
(1,233)
(8,000)
(8,000)
2011e
n/a
n/a
n/a
n/a
n/a
n/a
n/a

Stock data as of December 31, 2011
Source: MSE, Eurasia Capital

www.eurasiac.com

60
Mongolia Outlook 2012
World’s Fastest Growing Economy

31 January 2012

ORIGO PARTNERS PLC

Eurasia Capital Call

Origo Partners Plc. is a private equity investment company listed on the London Stock
Exchange. The primary focus of the company is China linked core economic growth
opportunities. In December 2009, the company formerly known as Origo Sino India
Plc. was reorganized and became Origo Partners Plc. after combining its asset manager
and its managed fund, Origo Resource Partners. Unaudited net asset value (NAV) of
the Company’s portfolio was US$215.4mn as of 30 September 2011, with the majority
of assets being in resources or resource development.

Key Stock Data
Ticker
OPP:LN
Price (GBp)
35
52 Wk high (GBp)
54.125
52 Wk low (GBp)
25.75
Market cap (US$mn)
195.5
Shares outstanding (mn)
360.17
Avg d'ly turn'r (US$’000)
334
Performance, y o y
14.6%
Valuation Ratios
P/E
10.1
Earnings Yield
9.9%
P/B
0.9
ROE
10.1%
ROA
8.6%
Share Price Performance, GBp

BUY

Shareholders' Structure
Lansdowne Partners
17%

Ecofin

12%

Growth Outlook

GLG Partners

As of September 30, 2011 Origo’s net asset value stood at US$215.4 compared with
US$165.4mn a year earlier. The Company has successfully raised US$60mn and
US$32.5mn through issue of preferred and common shares during 2011. Although
Origo’s Mongolian investments in Kincorra Copper and Gobi Coal were successful,
investments in some Chinese companies underperformed. We expect that growth in
NAV of Origo’s portfolio will originate from Mongolian investments. Completion of
exploration work in prospects owned by Origo’s portfolio companies as Huremtiin
Hyar, Moly World and Kincora Copper has potential to significantly increase the NAV.

Ratios and Growth Rates
Net profit margin
EPS (cents)
Gross profit margin
Revenue growth rate
Balance Sheet (US$mn)
Current asset
Fixed asset
Total asset
Total liabilities
Shareholders' equity
Total liabilities & equity

2009
n/a
37.93
46%
(23%)
2009
28.7
105.8
134.5
2.5
132.0
134.5

2Q 2010
n/a
0.9
50%
65%
2Q 2010
51.1
114.6
165.7
3.2
162.5
165.7

2Q 2011
n/a
5.9
51%
11%
2Q 2011
55.7
228.2
283.9
58.8
225.1
283.9

Profit & Loss (US$mn)
Revenue
Gross profit
Pretax profit
Net profit
Cash Flow (US$mn)
Operating Cash flow
Investing Cash flow
Financing Cash flow
Exchange gain
Cash at the beginning
Cash at the end

10%

F&C Asset Mgt.
F&C Fund Mgt.

8%

26%
7%
3% 4% 4% 5%

5%

Morgan Stanley
Soros LLC
Credit Suisse
TT International Inv
JP Morgan Asset Mgt.
Others

2009
3.7
1.7
39.5
38.9
2009
(0.4)
6.3
(1.2)
1.4
19.0
25.0

2Q 2010
1.4
0.7
2.0
2.0
2Q 2010
(1.9)
(5.4)
29.5
0.2
25.0
47.4

2Q 2011
1.3
0.6
19.4*
19.3*
2Q 2011
(0.6)
(39.1)
57.3
0.9
33.4
51.9

*After revaluation of investments. Stock data as of December 31, 2011
Source: Company data, Bloomberg, Eurasia Capital

www.eurasiac.com

Dec 11

Fair value, $mn
$67,0
$12,6
$10,0

Nov 11

Cost, $mn
$15,0
$4,6
$10,0

Oct 11

Ownership
17,9%
33,2%
20,0%

Sep 11

#
Company
Sector
1
Gobi Coal & Energy
Mining
2
Kincora Copper
Mining
3
Moly World
Mining
Source: Company announcements

Jan 11

Largest holdings in Mongolia, November 2011

Jul 11

In March 2011, the Company completed capital raise of US$60mn, by placing new
convertible preference shares at a price of $1.00 each. Earlier, Origo informed that
it had commitment from Spearpoint Limited to subscribe for US$60mn.

55
50
45
40
35
30
25
20
Aug 11

In July, Origo completed listing of Kincora Copper through reverse take over of
Toronto listed Brazilian Diamonds. Following the transaction, Origo held
approximately 34.8% of the Kincora Copper.

Jun 11

In September, Origo launched MSE Liquidity Fund and announced the formation of
China Cleantech Partners, L.P., a US$200mn private equity fund which will invest in
China's cleantech sectors.

Apr 11

In November, Origo Partners and Trafigura announced formation of a 50/50 joint
venture, Trafigura Origo MGL to invest in coal and iron ore opportunities.

May 11

In December 2011, Origo Partners has raised approximately US$32.5mn, through
placing of 57,758,333 new ordinary shares at a price of 36 pence per Placing Share.

Feb 11
Mar 11

Recent Developments

61
Mongolia Outlook 2012
World’s Fastest Growing Economy

31 January 2012

ENTRÉE GOLD INC

Eurasia Capital Call

Entrée Gold is a Toronto listed Canadian mineral exploration company with gold,
copper, molybdenum and coal properties in Mongolia, the USA, China, Canada and
Australia. Entrée has three major projects in Mongolia, all located near the Oyu Tolgoi
project. The Shivee West copper gold project is 100% owned by the company, while
the Heruga project and the Hugo North Extension project are jointly owned by Entrée
(20%) and Ivanhoe Mines (80%) through Entrée OT LLC joint venture.

Key Stock Data
Ticker
Price (C$)
52 Wk high (C$)
52 Wk low (C$)
Market cap (US$mn)
Shares outstanding (mn)
Avg d'ly turn'r (US$mn)
Performance, y o y
Valuation Ratios
P/E
Earnings Yield
P/B
ROE
ROA
Share Price Performance, C$

BUY

Another mostly developed and promising Entrée project is the Ann Mason copper
molybdenum deposit with inferred copper resources of 7.1bn lbs in Nevada. In the
USA, Entrée has several copper projects in Nevada, Arizona and New Mexico, and a
uranium project in North Dakota.
Recent Developments
The initial results of the 2011 exploration program from the Shivee West project
were very encouraging returning up to 1.82g/t over 14 meters and demonstrated
significant gold extensions for over 300 meters.
In November 2011, Entrée made an additional offering of 10mn shares at C$1.25
per share and in December offered an over allotment option for additional
1.125mn shares at the same price. Entrée was able to raise C$16mn from the
public offering, the exercise of the over allotment option, and the exercise of the
pre emptive rights of Rio Tinto. The net proceeds are expected to be used for
ongoing exploration at Ann Mason in the US and Shivee West in Mongolia.

n/a
n/a
3.5
(25.3%)
(19.3%)

3.5

As part of the sale of its non core assets, Entrée sold the Togoot mining license
covering 14,031ha for a gross consideration of C$1.6mn as the company had
identified limited upside potential from the coal targets located in the area. The
company also sold the Rainbow Canyon property to lower the relative acquisition
cost and to strengthen the cash position for exploration in Nevada. The Rainbow
property was a part of PacMag Metals acquisition in June 2010, giving Entrée title
over the Ann Mason deposit in Nevada.

ETG:CN
1.24
3.40
1.01
154.93
127.02
0.13
57.8%

1

3
2.5
2

Nov 11

Oct 11

Sep 11

Jul 11

Aug 11

Jun 11

Apr 11

Shareholders' Structure

Entrée has an agreement, subject to regulatory approval and TSX acceptance, to
acquire the remaining 49% stake in the Blackjack copper property from Honey
Badger. The company had previously acquired 51% in Blackjack, located next to the
Ann Mason deposit.

Rio Tinto, Ivanhoe Mines
The Caisse, Atlas Iron
24%
Directors and Management

10%
7%

Growth Outlook

TD Asset Management

5%

The company has a strong cash position (estimated 87% not including 4Q 2011
financing), and has a good control over acquisition and exploration costs (sale of non
core assets and cut back in 3Q 2011 losses over Mongolian exploration). Entrée will
explore southern part of the Heruga (copper gold molybdenum), the Blackjack, the
Roulette projects, and continue drilling in the Shivee West in 2012, we believe, to
discover more assets. And the strategic location (next to world class Oyu Tolgoi) and
partnership with Ivanhoe will significantly contribute to the growth potential with the
spillover effects from the development of Oyu Tolgoi project.
Ratios and Growth Rates
Net profit margin
Loss per share (US$)
Loss per share growth rate
Sales growth rate
Balance Sheet (US$mn)
Current asset
Long term asset
Total asset
Current liabilities
Long term liabilities
Shareholders' equity
Total liabilities & equity

May 11

Mar 11

Jan 11
Feb 11

1.5

2009
n/a
0.18
n/a
n/a
2009
42.0
3.8
45.8
1.2
0.7
43.9
45.8

2010
n/a
0.19
5.6%
n/a
2010
22.7
58.7
81.4
1.5
16.2
63.7
81.4

3Q 2011
n/a
0.12
(37%)
n/a
3Q 2011
12.1
52.8
64.9
1.8
13.7
49.4
64.9

Profit & Loss (US$mn)
Sales
Gross profit
Operating profit
Pretax profit
Net profit
Cash Flow (US$mn)
Operating Cash flow
Financing Cash flow
Investing Cash Flow
Net cash flow
Cash at the beginning
Cash at the end

42%

4%
4%
4%

Front Street Capital
Royal Bank of Canada, RBC
Dominion Securities
U.S. Global Investors, Royce
and Associates
Other Shareholders

2009

2010

3Q 2011

(17.3)
(17.1)
(17.1)
2009
(13.3)
2.3
(0.3)
(4.9)
45.2
40.4

(19.9)
(20.6)
(20.1)
2010
(15.9)
2.5
(6.9)
(19.1)
40.4
21.3

(18.1)
(16.5)
(12.5)
3Q 2011
(16.6)
0.6
5.7
(10.8)
21.3
10.5

Stock data as of December 31, 2011
Source: Toronto Stock Exchange, Eurasia Capital

www.eurasiac.com

62
Mongolia Outlook 2012
World’s Fastest Growing Economy

31 January 2012

SHIVEE OVOO JSC

Eurasia Capital Call

Shivee Ovoo (SHV) is the third largest coal producer listed on the MSE. The Company
began operations in 1990 and was listed on the exchange in February 1995. The
Mongolian Government owns 90% of the Company through state owned Erdenes MGL
LLC, which currently holds coal licenses pertaining to SHV, and Firebird Management
holds 8.1%. SHV coal mine, a Mongolian strategic deposit, is located 260km southeast
of Ulaanbaatar and 20km from the Choir railway station. SHV’s total license area
covers 4,293ha. According to the European and Russian reserves and resources
classification standards, the initial estimated reserves of the SHV deposit is 646Mt of
which 564Mt of coal is on balance (reserves) and 82Mt is off balance (resources) with
calorific value of 2,963 4,407Kcal/kg.

Key Stock Data
Ticker
SHV:MO
Price (MNT)
15,300
52 Wk high (MNT)
62,300
52 Wk low (MNT)
12,500
Market cap (US$mn)
147.2
Shares outstanding
13,419,101
Avg d'ly turn'r (MNTmn)
12.8
Performance, y o y
17.2%
Valuation Ratios
P/E (2Q 2011)
nm
P/E (2011e)
nm
P/B (2Q 2011)
nm
ROE (2Q 2011)
41.5%
ROA (2Q 2011)
1.6%
Share Price Performance, MNT

UNDER REVIEW

SHV got US$67.6mn loan from the Japanese Government in 1998 2004 for expansion
and the annual capacity increased to 2Mt. In 2010, it sold 1.7Mt supplying 28% of the
total Mongolian consumption, according to the Company. We estimate that SHV
produced about 1.8Mt in 2011. So far, SHV produced over 9Mt from the deposit. But,
the state regulated coal price has been again major problem for the Company.

70,000
60,000
50,000
40,000
30,000
20,000

The installed 2km long coal conveyer system replaced truck transportation, hence
it is expected to be cost efficient and improve profitability.

Nov 11

Jul 11

Sep 11

May 11

Jan 11

Mar 11

Nov 10

Jul 10

Jan 10

Sep 10

10,000

The Company expects that as the coal drying facility makes the moisture to the
minimum of 15% from the previous over 43%, the marketability of its coal will
significantly improve.

May 10

The Company invested MNT7.4bn (~US$5mn) for the construction of a coal
handling facility, a coal drying facility and a conveyer system in the last two years.
And, the annual capacity of the facilities and conveyer system is 2Mt, and they
became operational from September 2011. The investment was financed by the
Company’s own retained earnings of previous years.

Mar 10

Recent Developments

Shareholders' Structure
1.9%

Growth Outlook
According to the last information, 70% of coal consumption of the planned TPP 5 will
be supplied from SHV. We estimate that SHV’s capacity should be doubled to 4Mt in
order to supply the required additional 2Mt coal by 2016. As the case with other
thermal coal producers, the coal price will be the most important factor for its future.
In 2010, the Parliament ordered the Government to implement a policy to shift energy
sector companies to a market economy principal by 2014. However, it remained
unclear that whether coal price will be liberalized from the state control.

8.1%

State
Firebird
Management
Other
Shareholders

90.0%

To double the capacity SHV will need significant amount of financing. We view that, as
is the case with BAN, the state will approve the Company to issue additional shares to
finance the expansion in the coming years. However, the state ownership has to be at
least more than 50% according to Mongolian law.

Ratios and Growth Rates
Net profit margin
EPS (MNT)
EPS growth rate
Sales growth rate
Balance Sheet (MNTmn)
Current asset
Fixed asset
Intangible asset
Total asset
Current liabilities
Long term liabilities
Shareholders' equity
Total liabilities & equity

2009
68%
(823)
nm
10%
2009
28,559
62,829
856
92,244
7,455
92,371
(7,583)
92,244

2010
55%
937
nm
42%
2010
31,644
60,611
787
93,042
9,904
78,240
4,898
93,042

2Q 2011
13%
(107)
nm
nm
2Q 2011
30,087
59,203
752
90,042
8,342
78,240
3,460
90,042

Profit & Loss (MNTmn)
Sales
Gross profit
Operating profit
Pretax profit
Net profit
Cash Flow (MNTmn)
Operating Cash flow
Investing Cash flow
Financing Cash flow
Exchange gain
Net cash flow
Cash at the beginning
Cash at the end

2009
16,202
1,587
1,054
(11,048)
(11,048)
2009
3,552
(1,907)
(27)
(59)
1,558
2,131
3,689

2010
23,053
1,254
522
12,568
12,568
2010
1,172
7
59
(407)
831
3,689
4,519

2Q 2011
11,276
(808)
(1,254)
(1,438)
(1,438)
2Q 2011
(797)
(382)
(1,952)
(11)
(3,142)
4,519
1,377

Stock data as of December 31, 2011.
Source: MSE, Eurasia Capital

www.eurasiac.com

63
Mongolia Outlook 2012
World’s Fastest Growing Economy

31 January 2012

MONGOLIA GROWTH GROUP LTD

Eurasia Capital Call

Mongolia Growth Group (MGG) is a real estate, financial services and insurance
conglomerate, focusing its operations in the emerging economy of Mongolia. In
February 2011, present management of MGG purchased common shares of Canada
listed Summus Capital Corp., and renamed the company to Mongolia Growth Group
Ltd. MGG is listed on the Canadian National Stock Exchange (CNSX), having the symbol
YAK.

Key Stock Data
Ticker
Price (C$)
52 Wk high (C$)
52 Wk low (C$)
Market cap (C$mn)
Shares outstanding (mn)
Avg d'ly turn'r (C$’000)
Since February 4, 2011*
Valuation Ratios
P/E
Earnings Yield
P/B
ROE
ROA
Share Price Performance, C$

HOLD

Recent Developments
On December 23, 2011 MGG announced that it closed C$15mn private placement
after issuing 3,846,154 common shares at a price of C$3.90 per share.
On June 23, 2011, the Company closed another private placement at C$ $3.51 per
share for aggregate gross proceeds of C$17.1mn.
In June MGG received an insurance license from the Financial Regulatory
Commission to underwrite property and casualty insurance in Mongolia. The newly
formed insurance company was named “Mandal General”.

Ratios and Growth Rates
Net profit margin
EPS (cents)
Gross profit margin
Sales growth rate
Balance Sheet (C$mn)
Current asset
Fixed asset
Total asset
Total liabilities
Shareholders' equity
Total liabilities & equity

2009

2010

3Q 2011

(0.01)

(0.10)

(0.07)

2009
0.39
0.02
0.41
0.01
0.39
0.41

2010
0.16
0.001
0.16
0.01
0.15
0.16

3Q 2011
19.5
16.9
36.4
0.28
36.2
36.4

Profit & Loss (C$000)
Revenue
Gross profit
Pretax profit
Net profit
Cash Flow (C$000)
Operating Cash flow
Investing Cash flow
Financing Cash flow
Exchange gain
Cash at the beginning
Cash at the end

Dec 11

Nov 11

Oct 11

Sep 11

Aug 11

Jul 11

Jun 11

Apr 11

Mongolia Growth Group raised over US$45mn through private placements during
2011 and has already invested close to US$25mn in property assets comprising of
retail space, office space, residential units and land. Although property rental
operations generate good level of income, losses incurred by insurer Mandal General
Daatgal and other corporate expenses hinder the cashflow. According to the company
management, with initial capital of US$5m, Mandal General Daatgal is the best
capitalized insurer in Mongolia. However, the company which received insurance
license in June this year will incur further losses in the short term before it turns into
profits. We believe that the property portfolio of MGG has significantly appreciated in
value since it was acquired, which is in line with the management statements. With
healthy cash position which was enhanced after C$15mn raise in December, the
Company is expected to continue to grow its property portfolio. We are cautious about
the prospects of insurance business of the Company. Possible appreciation of NAV
through professional valuation of property portfolio may not be able to justify current
premium at P/B ratio of 3.5.

May 11

Growth Outlook

Feb 11

In March, MGG has decided to enter the Mongolian Property and Casualty
Insurance Market. A partnership has been struck with various members of UMC
Group to provide consulting services during the business formation process.

3.5

7
6
5
4
3
2
1
0
Mar 11

In April, the Company closed C$14.9 private placement after issuing 11,257,923
common shares at C$1.32 per share.

YAK:CN
3.9
6.04
0.6
126
30.3
27.3
457.1%

Shareholders' Structure
9%

6%

17%

5%

3%

Kupperman
Harris
Fleckenstein
William
Calonego Jordan
TD Asset Mgt.
Green Apple
Hlds.
Others

60%

2009
2.5

2010
1.4

3Q 2011
404.2

(49.4)
2009
(53.6)
0
(15.4)

(247.8)
2010
(244.6)

(1,445)
3Q 2011
158.1
36,224
(22,710)

451.7
382.8

382.8
138.2

138.2
13,810

*IPO Date. Stock data as of December 31, 2011
Source: Company data, Bloomberg, Eurasia Capital

www.eurasiac.com

64
Mongolia Outlook 2012
World’s Fastest Growing Economy

31 January 2012

VOYAGER RESOURCES LTD

Eurasia Capital Call

Voyager Resources Limited (VOR) is an Australian listed company (quote: VOR). The
company’s goal is to create sustainable exploration and development business of
copper gold and gold projects in Mongolia. It has Tsagaan Chuluut gold, Tsagaan gold,
Daltiin Ovoo gold and Khongor copper. Chief among of the acquisitions of several
mineral deposits, the Khongor copper gold porphyry project and KM Project have
potential for the company’s growth.

Key Stock Data
Ticker
Price (A$)
52 Wk high (A$)
52 Wk low (A$)
Market cap (US$mn)
Shares outstanding
Avg d'ly turn'r (A$mn)
Performance, y o y
Valuation Ratios
P/E
P/E (2011f)
P/B
ROE
ROA
Share Price Performance, A$

BUY

Recent Developments
In 2011, VOR started aggressive exploration at its gold and copper projects. With
Reverse Circulation drilling at KM project located in the World Class Copper Belt of
the South Gobi Province of Mongolia, the initial results were promising with 1.48
4.06% of copper from 10 66 meters and 5.4 16.2g/t silver from 14 70 meters. The
Company completed the geophysics and geochemistry, and based on the results
coming those survey company expanded the drilling program with two more
diamond drilling.
VOR also implemented extensive exploration at Khongor project throughout 24
diamond core drill holes. In addition, the recent 3D modeling of the IP survey has
revealed potential for depth extension and it has expanded the mineralized zone
by 150 metres in area.
Updates:

n/a
n/a
2.67
19.9%
19.4%

0.16
0.12
0.08

Received secure commitments from subscribers on the placement of
US$4.1mn

0.04

Provided prospectus, stating one share for every eight shares held by
shareholders at an issue of 6 cents per share for the capital raise and it
completed
Agreed to acquire up to 80% of the KM Copper project

3 Jan
3 Feb
3 Mar
3 Apr
3 May
3 Jun
3 Jul
3 Aug
3 Sep
3 Oct
3 Nov
3 Dec

0

Shareholders' Structure

Growth Outlook
The company is planning to complete the JORC resource estimate at the second
quarter of 2012 and its 50,000 meters of drilling. In reflection to its new deposits and
drilling results the year to date share price increased by 25.9%. Khongor has a
mineralised strike length of +1km from geological mapping and sampling that is
broadly coincidental with a large Induced Polarisation chargeability anomaly that
extends for +1,600 by 380 metres with average 0.93% Cu and 0.24 gt of Au based on
its drilling results. It is high risk, high reward scenario.

Ratios and Growth Rates
Net profit margin
EPS (A$ ‘000)
EPS growth rate
Sales growth rate
Balance Sheet (A$‘000)
Current asset
Fixed asset
Intangible asset
Total asset
Current liabilities
Long term liabilities
Shareholders' equity
Total liabilities & equity

VOR:AU
0.068
0.1341
0.034
71.51
1.03B
8.03
25.9%

2009
n/a
n/a
n/a
n/a
2009
139.8

2010
n/a
n/a
n/a
n/a
2010
2,395.2
1,244.6

2011
n/a
n/a
n/a
n/a
2011
9,752.7
6,636.2

139.8
31,912.4

3,639.9
77.9

16,388.9
435.1

(31,632)
139.8

3,562
3,639.9

15,953.7
16,386.8

Profit & Loss (A$‘000)
Sales
Gross profit
Operating profit
Pretax profit
Net profit
Cash Flow (A$‘000)
Operating Cash flow
Investing Cash flow
Financing Cash flow
Exchange gain
Net cash flow
Cash at the beginning
Cash at the end

3.0%
2.6%

Peterson jason

1.4%
Wood Matthew
Sacha
Investments
93.0%

others

2009

2010

2011

(1,063.7)
(1,063.7)
(1,063.7)
2009

10,060.6
10,060.6
10,077.3
2010
(1,779)
1,410
5,588
0.476
2,399
4.0
2,137

(1,983)
(1,983)
(2,227.1)
2011
(823)

4.0
4.0

(2,350)
108.29
7,368
2,401
9,877

* Financial year ends June 30. Stock data as of December 31, 2011
Source: Bloomberg, Eurasia Capital

www.eurasiac.com

65
Mongolia Outlook 2012
World’s Fastest Growing Economy

31 January 2012

SHARYN GOL JSC

Eurasia Capital Call

Sharyn Gol JSC (SHG) is a MSE listed thermal coal mining company. In 1995, the mine
was partially privatized and listed on the MSE, and by 2003 it became a fully private
company. Connected by railroad, SHG’s mine is located 215km north of Ulaanbaatar
and 65km south of Darkhan city. SHG’s JORC compliant coal resource is 373.8Mt (of
which 279.4Mt is Measured & Indicated) with a calorific value of 4,128 5,083 kcal/kg.
Historically, SHG was producing over 2Mt a year in the mid 1980s. From 2000 to 2005,
it produced 0.7Mt a year. Since then it has been producing around 0.5Mt of coal of
which 80% has been going to the Darkhan and Erdenet thermal power plants (TPP).
SHG exploited 55Mt of the coal reserve so far.

Key Stock Data
Ticker
SHG:MO
Price (MNT)
11,350
52 Wk high (MNT)
35,099
52 Wk low (MNT)
10,500
Market cap (US$mn)
82.7
Shares outstanding
10,231,389
Avg d'ly turn'r (MNTmn)
200.3
Performance, y o y
8.1%
Valuation Ratios
P/E (2011e)
nm
P/E (2012f)
nm
P/B (3Q 2011)
8.4
ROE (3Q 2011)
4.4%
ROA (3Q 2011)
3.0%
Share Price Performance, MNT

BUY

30,000
20,000

SHG has intention to ramp up its production to 2.5Mt as it develops the new mine at
the new discovery area and sees opportunities to reach Russian, Chinese, and the East
Asian markets as it has ready railroad infrastructure connected with the Trans
Mongolian railroad.

Ratios and Growth Rates
Net profit margin
EPS (MNT)
EPS growth rate
Sales growth rate
Balance Sheet (MNTmn)
Current asset
Fixed asset
Intangible asset
Total asset
Current liabilities
Long term liabilities
Shareholders' equity
Total liabilities & equity

2009
2%
30
260%
16%
2009
6,577
2,920
38
9,535
5,592
2,508
1,434
9,535

2010
2%
25
16%
15%
2010
8,422
14,079
38
22,539
12,197
2,508
7,834
22,539

3Q 2011
8%
59
nm
nm
3Q 2011
5,100
8,576
6,803
20,478
4,075
2,508
13,894
20,478

Shareholders' Structure
Firebird
Management

2.1%

Nihan Holdings

9.7%
8.7%

Mogul Resources

9.8%

54.4%

Batbold
Jigjidsuren

15.2%

Profit & Loss (MNTmn)
Sales
Gross profit
Operating profit
Pretax profit
Net profit
Cash Flow (MNTmn)
Operating Cash flow
Investing Cash flow
Financing Cash flow
Exchange gain
Net cash flow
Cash at the beginning
Cash at the end

Sharyn Gol Energo

Other

2009
8,812
964
510
244
220
2009
(308)
(31)
(339)
623
284

2010
10,169
2,710
1,860
390
215
2010
2,642
(758)
(72)
(279)
1,533
284
1,818

3Q 2011
7,114
1,241
159
645
605
3Q 2011
(236)
(29)
39
(11)
(237)
1,818
1,581

Stock data as of December 31, 2011
Source: MSE, Eurasia Capital

www.eurasiac.com

Nov 11

Jul 11

Sep 11

May 11

Jan 11

Mar 11

Nov 10

The Company plans to increase its production from current less than 0.5Mt to 1Mt by
2013 and to 1.5Mt by 2015. The recently raised fund will mainly be used to renew and
expand mining equipments and technology in regard to the production expansion, for
working capital needs and additional exploration. The Company projects per tonne
coal price at which SHG sells to increase more than 30% this year, and further steadily
grew per year. According to the Company estimates, its profit will significantly increase
and ROE will reach 20% in 2013. At this stage, we believe that SHG can sell the coal to
the Thermal Power Plants and other consumers in the domestic market.

Jan 10

Growth Outlook

Jul 10

10,000

Sep 10

In January 2011, SHG converted MNT5.5bn (~US$4mn) debt from its controlling
shareholder, Firebird Management, into new 1.3 shares. In October, SHG issued
1.7mn news shares at a price of MNT11,117/share in the market and successfully
raised MNT18bn (~US$14mn).

40,000

May 10

On January 24, 2012, SHG announced that the Mineral Authority of Mongolia
(MRAM) has approved revised mineral reserve of 146.3Mt thermal at its flagship
Sharyn Gol thermal coal project in northern Mongolia. The Company conducted
extensive drilling programme on the project in 2010 and earlier in 2011 announced
374Mt of JORC compliant resources. This revised reserve includes the former
reserve and the reserve discovered by the above JORC compliant exploration. SHG
said this more than doubles its previous reserve estimate (under Mongolian
standard).

Mar 10

Recent Developments

66
Mongolia Outlook 2012
World’s Fastest Growing Economy

31 January 2012

PROPHECY COAL CORP

Eurasia Capital Call

Prophecy Coal Corp. (PCY) is a Toronto listed Canadian mining development and
exploration company. PCY has coal properties in Mongolia and copper, molybdenum,
vanadium and titanium properties in Canada. The flagship and most developed of the
Company’s assets is Ulaan Ovoo coal property in Mongolia, in which it holds a 100%
interest. Prophecy also owns 100% of the Chandgana coal property, another major
asset in Mongolia. In Canada, Prophecy has a 100% interest in Lynn Lake, 60% interest
in Okeover and 80% interest in Titan.

Key Stock Data
Ticker
Price (C$)
52 Wk high (C$)
52 Wk low (C$)
Market cap (US$mn)
Shares outstanding (mn)
Avg d'ly turn'r 6M (US$mn)
Performance, y o y
Valuation Ratios
P/E
Earnings Yield
P/B
ROE
ROA
Share Price Performance, C$

BUY

On May 4, 2011 PCY announced that it has entered into an Option Agreement with
a private Mongolian company holding an exploration license near PCY’s Ulaan Ovoo
mine, pursuant to which PCY has been granted the right to acquire 100%
ownership for US$2mn within the first year, or US$4mn in the second year of the
execution of the Agreement.

Management and
Directors

20%

institutional
Investors

50%

2010

3Q 2011

2009
0.1
15.2
15.3
0.04
15.3
15.3

2010
43.3
75.0
118.3
16.1
102.2
118.3

3Q 2011
14.1
106.5
120.2
1.4
118.8
120.2

Profit & Loss (US$mn)
Revenue
Gross profit
Pretax profit
Net profit
Cash Flow (US$mn)
Operating Cash flow
Investing Cash flow
Financing Cash flow
Exchange gain
Cash at the beginning
Cash at the end

Retail

30%

We believe that the company starts generating cash flow in coming years as it has
signed several agreements to supply with coal. Construction of 600MW Chandgana
TPP will serve as a catalyst in share price increase, in our view.

2009

Nov 11
Dec 11

Shareholders' Structure

Growth Outlook

Ratios and Growth Rates
Net profit margin
EPS (pence)
Gross profit margin
Sales growth rate
Balance Sheet (US$mn)
Current asset
Fixed asset
Total asset
Total liabilities
Shareholders' equity
Total liabilities & equity

Sep 11
Oct 11

In late June, 2011 the company made landmark shipment of 650 tonnes of coal to
Energy LLC, a company registered in the Buryatia Republic of Russia, which was
then consumed in local Buryat power stations and boilers.

Aug 11

On August 17, 2011 PCY discovered 19 meter thickness coal seam at the 4,733
hectare IIch property located 17km from its Ulaan Ovoo Coal mine in Mongolia.

Jun 11
Jul 11

PCY announced on October 18, 2011 that the common shares of the company have
been approved for listing on the Toronto Stock Exchange Starting October 19,
2011. PCY’s shares were delisted from TSX Venture Exchange as a result.

0.95

1
0.9
0.8
0.7
0.6
0.5
0.4
0.3
Apr 11
May 11

In November, 2011 the company announced that its wholly owned subsidiary East
Energy Development LLC, has received the license certificate from the Mongolian
Energy Regulatory Authority to construct the 600MW Chandgana power plant.

Jan 11

PCY reported on December 30, 2011 that it has executed a term loan of up to
C$5mn from a bank and a C$2mn inter company loan facility agreement with an
affiliate company, Prophecy Platinum Corp. The loan facility which is subject to
completion of the lender’s due diligence, TSX approval and completion of
customary credit documentation will operate for a period of 14 months from the
date of its first drawdown and bears interest at 10% per annum, compounded
quarterly.

Feb 11
Mar 11

Recent Developments

PCY:CN
0.41
0.96
0.4
79.87
198.06
0.68
52.6%

2009
0.0
0.0
1.6
1.6
2009
1.1
0.6
0.5

2010
0.
0.0
5.6
5.6
2010
4.8
12.3
55.1

3Q 2011
0.0
0.0
13.8
6.9
3Q 2011
5.2
5.1
4.9

1.4
0.1

0.1
39.3

39.3
4.2

Stock data as of December 31, 2011
Source: Company data, Bloomberg, Eurasia Capital

www.eurasiac.com

67
Mongolia Outlook 2012
World’s Fastest Growing Economy

31 January 2012

CENTRAL ASIA METALS PLC

Eurasia Capital Call

Central Asia Metals Plc. (CAML) is a London listed mining, exploration and
development company whose principal business activities are on base and precious
metals in Central Asia. Currently, CAML has majority interests in 5 projects: the Alag
Bayan (copper gold, 70%), Ereen (gold, 85%) and Handgait (molybdenium, 80%)
projects in Mongolia and the major Kounrad (copper, 60%) project in Kazakhstan.

Key Stock Data
Ticker
CAML:LN
Price (GBp)
56.88
52 Wk high (GBp)
101.50
52 Wk low (GBp)
54.00
Market cap (US$mn)
76.00
Shares outstanding (mn)
86.17
Avg d'ly turn'r (US$mn)
0.14
Performance, y o y
36.9%
Valuation Ratios
P/E
n/a
Earnings Yield
n/a
P/B
1.2x
ROE
(2.5%)
ROA
(2.4%)
Share Price Performance, C$

BUY

Recent Developments
Kounrad was planned to be commissioned during 4Q 2011, and CAML has done
significant development work to remain on course. In March, the company
provided an update on the project with estimated capex of US$46.9mn, completed
engineering design, first deliveries of equipment to the site expected in April. CAML
also completed and commissioned rail system providing access to Kounrad. In
December, CAML announced the official opening of the project, included in the
national initiative of State Programme of Innovation and Accelerated Industrial
Development of Kazakhstan for 2010 2014. Full commissioning has been planned
for February 2012.
CAML reached an agreement to sell the Tochtar project in line with the corporate
strategy outlined in 2010 to Wildford Holding Limited for a total of US$2.5mn. The
total consideration consists of US$0.825mn in cash payment and US$1.675mn to
cover historical liabilities. According to the management, the sale will remove the
historical cost liabilities and enable to focus 100% on delivery of Kounrad SXEW
Copper project.
CAML will also continue to negotiate the disposal of Ereen (Mongolia) project.
Successful completion will be contingent upon the negotiations of CAML with the
Mongolian Government as 3 out of 5 mining licenses are included in the revocation
list of ‘placer’ gold occurrences. Since Ereen comprises of JORC compliant 19.9Mt
at grade 1.2g/t ‘hardrock’, and not considered ‘placer’ gold, CAML will continue
discussions with authorities, and allocate only US$0.2 0.8mn for exploration and
evaluation at Ereen.

110
100
90
80
70
60
50
Jan 11
Feb 11
Mar 11
Apr 11
May 11
Jun 11
Jul 11
Aug 11
Sep 11
Oct 11
Nov 11
Dec 11

Among the company’s major activities is the construction and operation of a 10,000tpa
copper cathode Solvent Extraction Electro Winning (SXEW) plant in Kounrad.

Shareholders' Structure
Comonwealth America
Blackrock Inc.

11%
18%

Growth Outlook
In our view, the planned start of production in early 2012 in Kounrad with ready
infrastructure and expected rise copper prices will bring CAML to positive net profit by
the year end. Currently, the company has a cash position (82% cash of current assets in
2Q2011) that can support minor capex before production in Kourad and further
exploration in other licence areas. We believe, CAML’s decision not to proceed with
larger capex at Ereen until clarification over some of the licenses is right and the
company may focus on extending the licence in Alan Buyag (copper gold) and
exploring in Hangait (molybdenum).

Ratios and Growth Rates
Net profit margin
Loss per share (US¢)
Loss per share growth rate
Sales growth rate
Balance Sheet (US$'000)
Current asset
Non current asset
Total asset
Current liabilities
Long term liabilities
Shareholders' equity
Total liabilities & equity

Lansdowne Partners

2009
(1315%)
46
n/a
n/a
2009
5,990
14,235
20,225
3,539
441
16,244
20,225

2010
(404%)
11
(76%)
27%
2010
54,057
22,505
76,562
1,147
684
74,730
76,562

2Q 2011
(159%)
2
(82%)
(22%)
2Q 2011
40,424
35,281
75,706
1,787
799
73,120
75,706

Profit & Loss (US$'000)
Sales
Gross profit
Pretax profit
Net profit
Cash Flow (US$'000)
Operating Cash flow
Investing Cash flow
Financing Cash flow
Exchange gain
Net cash flow
Cash at the beginning
Cash at the end

7%
7%
5%

35%
5%
2%

5%
5%

Henderson Global
Investors
Legal & General Group
Mr. Robert Maitland
Cathery
Mr. Edward Bloomstein
Capital Research Global
Investors
Fidelity Management
Other Shareholders

2009
1,141
25
(15,002)
(15,002)
2009
(3,625)
(4,564)
4,890
(6,207)
(3,299)
4,630
1,330

2010
1,446
48
(5,844)
(5,844)
2010
(7,681)
(5,176)
58,952
60
46,035
1,330
47,365

2Q 2011
1,129
149
(1,797)
(1,797)
2Q 2011
(4,311)
(9,614)
(241)
(14,165)
47,375
33,211

Stock data as of December 31, 2011
Source: Company data, Bloomberg, Eurasia Capital

www.eurasiac.com

68
Mongolia Outlook 2012
World’s Fastest Growing Economy

31 January 2012

PETRO MATAD LTD

Eurasia Capital Call

Petro Matad Ltd. is an AIM listed parent of a group focused on oil exploration, as well
as future development and production in Mongolia. The principal asset is the PSC over
Matad Block XX, a petroleum block with an area of 14,250 sq. km in the far eastern
part of the country.

Key Stock Data
Ticker
MATD:LN
Price (GBp)
24.75
52 Wk high (GBp)
211.00
52 Wk low (GBp)
13.50
Market cap (US$mn)
70.80
Shares outstanding (mn)
184.57
Avg d'ly turn'r (US$mn)
0.36
Performance, y o y
79.7%
Valuation Ratios
P/E
Earnings Yield
P/B
ROE 2Q 2011
28.0%
ROA 2Q 2011
25.9%
Share Price Performance, C$

BUY

Recent Developments
In November the company completed 2011 exploration programme in Blocks IV
and V consisting of stratigraphic core drilling, 2D seismic acquisitions and field
geology operations. The exploration programme aimed to identify drillable
prospects and will help 2012 exploration programme. The programme confirmed
the presence of a working petroleum system in the Tugrug basin in Block V
In September 2010 the company raised through a placing and subscriptions approx.
US$54mn
Petrovis LLC and Westhouse Securities Ltd. exercised their options on 2mn and
966,800 Petro Matad shares respectively in July 2010
Jul 15, 2010 Petro Matad announced that the Davsan Tolgoi 1 well (DT 1) on Block
XX had been completed, and found significant indications of hydrocarbons in the
target Tsagaansav formation. The well is the first to be drilled as part of the 2010
drilling programme on Block XX

250

A US$6mn investment in Petro Matad by the European Bank for Reconstruction
and Development (EBRD) announced on Dec 18, 2009. First tranche of 13,730,103
shares issued to EBRD in Feb 2010 and the second tranche of 14,644,004 shares
issued in Jun 2010.

100

200
150

50

Dec 11

Oct 11

Aug 11

Jun 11

Apr 11

Company’s Matad Block XX is located near China and to the south of the largest
producing oilfield in Mongolia. There is a ready market, at close to world prices, in
nearby China for any oil discovered in Block XX, and there are established export
routes. The two other Blocks, IV and V are located in central Mongolia and jointly
cover 71,000 km2.

Feb 11

Dec 10

0

Growth Outlook

Shareholders' Structure
Petrovis LLC
6%
20%
4%
47%

17%
6%

Janchiv
Oyungerel
EBRD
Forestberries
LLC
Others
GLG Partners LP

Ratios and Growth rates
Net profit margin
EPS (US$)
EPS growth rate
Sales growth rate
Balance Sheet (US$‘000)
Current assets
Fixed assets
Intangible assets
Total assets
Current liabilities
Long term liabilities
Shareholders' equity
Total liabilities & equity

2009
n/a
(4.70)
n/a
n/a
2009
5,352
199
15,275
20,826
796

2010
n/a
(10.50)
n/a
n/a
2010
52,132
450
15,275
67,857
1,421

2Q 2011
n/a
(8.27)
n/a
n/a
2Q 2011
42,306
912
15,275
58,493
4,179

20,030
20,826

66,436
67,857

54,314
58,493

Profit & Loss (US$‘000)
Sales
Gross profit
Operating profit
Pretax profit
Net profit
Cash Flow (US$‘000)
Operating Cash flow
Investing Cash flow
Financing Cash flow
Exchange Translation
Net cash flow
Cash at the beginning
Cash at the end

2009
n/a
n/a
(5,080)
(5,080)
(5,080)
2009
(4,006)
(124)
6,173
(76)
2,043
3,248
5,215

2010
n/a
n/a
(16,079)
(16,079)
(16,079)
2010
(13,342)
(307)
60,442
(318)
46,793
5,215
51,690

2Q 2011
n/a
n/a
(16,029)
(15,185)
(15,185)
2Q 2011
(10,030)
(522)
161
(10,391)
41
51,690
41,340

Stock data as of December 31, 2011
Source: Company data, Bloomberg, Eurasia Capital

www.eurasiac.com

69
Mongolia Outlook 2012
World’s Fastest Growing Economy

31 January 2012

XANADU MINES LTD

Eurasia Capital Call

Xanadu Mines (XAM) is a Mongolia focused coal, gold and copper exploration company
listed on ASX. The company was founded in 2005 and listed on the ASX in December
2010. The Company has two coking coal assets, the Nuurstei and Javkhlant Joint
Ventures with Noble Group, as well as two thermal coal assets the Khar Tarvaga coal
project, located 200kms south east of Ulaanbaatar in Central Mongolia with a JORC
compliant coal resource of 327Mt and the Galshar coal project located in the south
east Gobi with a JORC compliant coal resource of 170Mt. Other assets include copper
and gold exploration licenses in northern and south eastern Mongolia.

Key Stock Data
Ticker
Price (A$)
52 Wk high (A$)
52 Wk low (A$)
Market cap (US$mn)
Shares outstanding (mn)
Avg d'ly turn'r (US$)
Performance, y o y
Valuation Ratios
P/E
P/E (2012f)
P/B
ROE
ROA
Share Price Performance, A$

HOLD

Recent Developments
On November 22, 2011 the company announced that it had acquired 100% interest
in Khavtsgait coking coal project located in Khuvsgul province of northern
Mongolia. In early December 2011 the company received mining license from
Mineral Authority of Mongolia for the Khar Tarvaga thermal coal project which is
located 36km from the trans Mongolian railway in Tuv province. The mining license
covers an area of 83.5 sq km and has been granted for an initial term of 30 years. In
late November, 2011 the company announced that it would start drilling work
shortly following the announcement at its Javkhlant metallurgical coal project
located 22km from Chinese border in Gobi Altai province of Mongolia.

XAM:AU
0.345
0.80
0.31
65.8
186.9
222,700
(38.9%)
n/a
n/a
1.53
(9.8%)
(9.3%)

0.8
0.7
0.6

Growth Outlook

0.5
0.4
0.3

3 Dec

3 Oct

3 Nov

3 Sep

3 Jul

3 Aug

3 Jun

3 Apr

3 May

3 Jan

0.2
3 Feb
3 Mar

Strong economic growth in China has resulted in increased demand for resources such
as coal, and coupled with continuing demand from other Asian markets, has driven
and will continue to drive the global resource sector. Xanadu Mines with its coal and
other assets in Mongolia, next door to China, is well positioned to take advantage of
this growth.

Shareholders' Structure
Straits Energy
Trading

11.4%

Noble Group
LTD

9.6%
7.5%
6.0%

65.6%

Eagle Securities
Limited
Bikini Atoll
Investments
Other
shareholders

Ratios and Growth Rates
Net profit margin
EPS (A$cents)
EPS growth rate
Sales growth rate
Balance Sheet (A$’000)
Current asset
Fixed asset
Intangible asset
Total asset
Current liabilities
Long term liabilities
Shareholders' equity
Total liabilities & equity

2009
n/a
(7.1)
n/a
n/a
2009
709
6,366
11
7,087
484
508
6,094
7,087

2010
n/a
(1.85)
n/a
n/a
2010
949
9,441
8
10,399
3,118

2011
n/a
(2.75)
n/a
n/a
2011
24,938
19,577
5
44,520
2,441

7,281
10,399

42,079
44,520

Profit & Loss (A$’000)
Sales
Gross profit
Operating profit
Pretax profit
Net profit
Cash Flow (A$’000)
Operating Cash flow
Investing Cash flow
Financing Cash flow
Exchange gain
Net cash flow
Cash at the beginning
Cash at the end

2009

2010

2011

(4,000)
(3,229)
(3,229)
2009
(1,285)
(2,222)
739
288
(2,756)
3,058
590

(2,083)
(2,058)
(2,058)
2010
(1,725)
(329)
2,096
43
42
590
677

(4,162)
(3,463)
(4,155)
2011
(3,957)
(9,867)
(37,442)
(709)
23,618
677
23,586

* Financial year ends June 30. Stock data as of December 31, 2011
Source: Bloomberg, Eurasia Capital

www.eurasiac.com

70
Mongolia Outlook 2012
World’s Fastest Growing Economy

31 January 2012

HARANGA RESOURCES LTD

Eurasia Capital Call

Haranga Resource (HAR) is an Australian listed iron ore exploration and mining
company with investment of CIC holding a third of the company’s stake. The company
operates in two strategy line: exploration and development of iron ore, and acquisition
and upgrade of its portfolio. HAR wholly owns Khundlun project and holds majority
stakes in 4 deposits in Mongolia: Shavdal (75%), Selenge (60%), and Tumurtei Khudag
(51%), and Sumber (75%). The current projects in Mongolia have the cost
advantageous location close to transportation facilities.

Key Stock Data
Ticker
HAR:AU
Price (A$)
0.285
52 Wk high (A$)
0.74
52 Wk low (A$)
0.16
Market cap (US$mn)
57.24
Shares outstanding
196.75mn
Avg d'ly turn'r (US$)
253466.4
Performance, y o y
55.5%
Valuation Ratios
P/E
39.23
P/E (2011f)
50.4
P/B
2.21
ROE
n/a
ROA
n/a
Share Price Performance, A$

HOLD

Recent developments
In November 2011, HAR announced that it acquired a further 20% interest in a joint
venture company that holds the five exploration licences comprising the Selenge
Iron Ore Project. 29 of the 33 drill holes at the Bayantsogt Prospect within the
Selenge Iron Ore Project area have intersected significant widths of iron
mineralization as well as Huiten Gol and Dund Bulag prospects at Selenge project.
Five major iron lodes identified within the large Bayantsogt hill with the result of
26 47% Fe.
In 2011, with having completed full magnetic survey the company drilled first pass
drill holes and 10 out of 20 holes encountered significant iron mineralization at
Shavdal project. It has also started the metallurgical test and is targeting the
release of maiden JORC estimates by the first quarter of 2012.
Growth Outlook

0.8
0.6
0.4
0.2

In 2011 Mongolian iron ore export has grown rapidly and the market outlook remains
strong due to the demand of the world’s biggest importer of iron ore, China. The JORC
estimate coming in the first quarter of 2012 will be vital to company’s growth and
future stage of operation.

31 Dec

31 Oct

31 Aug

30 Jun

28 Feb

30 Apr

0
31 Dec

The company is planning to explore the current projects and to acquire additional top
quality projects. At Selenge A$1.8m was allocated to carry out a geophysical survey
and a 15,000m drilling campaign aimed at defining a maiden JORC compliant resource.
Rock chip sampling has already returned positive results at the project.

Shareholders' Structure
7%
5%
4%

Golden Rain
Holding Ltd
Sukhbaatar Bat
Ochir
Wood Matthew

84%

Ratios and Growth Rates
Net profit margin
EPS
EPS growth rate
Sales growth rate
Balance Sheet (A$ ‘000)
Current asset
Fixed asset
Intangible asset
Total asset
Current liabilities
Long term liabilities
Shareholders' equity
Total liabilities & equity

2009
n/a
n/a
n/a
n/a
2009
n/a
n/a
n/a
n/a
n/a
n/a
n/a
n/a

2010
n/a
n/a
n/a
n/a
2010
23,219.5
3,157.9
26,377.5
503.9
25,873.6
26,377.5

2011
n/a
n/a
n/a
n/a
2011
n/a
n/a
n/a
n/a
n/a
n/a
n/a
n/a

Profit & Loss (A$ ‘000)
Sales
Gross profit
Operating profit
Pretax profit
Net profit
Cash Flow (A$ ‘000)
Operating Cash flow
Investing Cash flow
Financing Cash flow
Exchange gain
Net cash flow
Cash at the beginning
Cash at the end

Other

2009
n/a
n/a
n/a

2009
n/a
n/a
n/a
n/a
n/a
n/a
n/a

2010
n/a
n/a
n/a
(2,310.8)
(2,310.8)
2010
(272.5)
(2,397.9)
25,814.6
(116.5)
23,028
23,028

2011
n/a
n/a
n/a

2011
n/a
n/a
n/a
n/a
n/a
n/a
n/a

Stock data as of December 31, 2011
Source: Bloomberg, Eurasia Capital

www.eurasiac.com

71
Mongolia Outlook 2012
World’s Fastest Growing Economy

31 January 2012

MONGOLIA INVESTMENT GROUP

Eurasia Capital Call

Mongolia Investment Group (402) is a Hong Kong listed company formerly known as
Ming Hing Waterworks Holdings Limited. The company changed its name in September
2010 following a substantial acquisition of a Mongolia focused company. In Hong Kong
the group is engaged in waterworks engineering, road works and drainage and slope
upgrading services. In 2010, the group transformed into a Mongolian resources related
group through the acquisition of Tugrugnuuriin Energy LLC, which holds four mining
licenses for a coal mine in Tugrug Valley, located approximately 170 km southeast of
Ulaanbaatar. Additionally, the company holds several gold, copper and coal
exploration licenses in Gobi Altai, Dundgobi and Zavkhan provinces. The coal deposit in
Turgug valley has 64Mt measured and indicated resource, and 27.9Mt inferred
resource of coal. Another three coal exploration licenses are located in DundGobi
province, 198km southeast of Ulaanbaatar. The company’s gold and copper license
areas are located in Gobi Altai and Zavkhan provinces covering 44,019 hectares and
15,517 hectares respectively.

Key Stock Data
Ticker
Price (HK$)
52 Wk high (HK$)
52 Wk low (HK$)
Market cap (US$mn)
Shares outstanding (bn)
Avg d'ly turn'r (US$)
Performance, y o y
Valuation Ratios
P/E
P/E (2012f)
P/B
ROE
ROA
Share Price Performance, HK$

UNDER REVIEW

0.14
0.12
0.10
0.08
0.06
0.04

Moving forward, the group will continue to develop the operations at its mine
gradually, and work towards securing off take agreements with customers. With the
Hong Kong Government’s commitment towards implementing more infrastructural
development projects mentioned in its 2011 Policy Address, it is believed the group’s
waterworks business will benefit from such significantly. The Group will duly seek to
secure new public sector contracts, thereby drawing additional sources of income.

Ratios and Growth Rates
Net profit margin
EPS (HK$cents)
EPS growth rate
Sales growth rate
Balance Sheet (HK’000)
Current asset
Fixed asset
Intangible asset
Total asset
Current liabilities
Long term liabilities
Shareholders' equity
Total liabilities & equity

2009
1%
0.71
n/a
n/a
2009
550,945
61,670

2010
(2.6%)
(2.13)
n/a
2.3%
2010
507,304
60,912

2011
(42%)
(6.76)
n/a
29.4%
2011
720,733
2,603,222

612,615
210,548
18,885
383,182
612,615

568,216
197,892
6,056
364,268
568,216

3,323,955
213,650
1,419,321
1,690,380
3,323,955

3 Dec

3 Oct

3 Nov

3 Sep

3 Jul

3 Aug

3 Jun

3 Jan

3 Apr

0.02

Growth Outlook
The Company plans to continually develop and expand the potential business by
acquiring valuable and quality assets in the region. Chinese economic growth results in
increased demand in China for resources such as coal, coupled with continuing
demand from other Asian markets, have driven and will likely continue to drive the
global resource sector. Resource companies with assets in Mongolia and elsewhere in
proximity with China are expected to show significant growth depending on its quality
of mineral assets.

NA
NA
0.25
(21.9%)
(11.1%)

0.16

3 May

In December 2011, the company signed a MOU with Yun Tu and other parties to
acquire Sinbu Investment Limited, a company engaged in aerial photography,
aviation and aerospace remote sensing image data processing, provision of
geographic information system (“GIS”) software and solutions. For the six months
ended on 30 September, 2011 the company reported revenue of HK$425mn (or
US$54.7mn) and net loss of HK$74.8mn (or US$9.6mn). The group achieved stable
revenue from its waterworks business while dedicating efforts to facilitate
profitable output at its Mongolia mine sites. The output of coal from the mine
during the period was about 748 tonnes, which was below the company forecast.

3 Feb
3 Mar

Recent Developments

402:HK
0.046
0.149
0.039
54.5
9.19
533,000
(67.6%)

Shareholders' Structure
Diamond
Wealth
Holding
Tan Kah Hock
20.14%
7.60%
6.43%

60.90%

Profit & Loss (HK$’000)
Sales
Gross profit
Operating profit
Pretax profit
Net profit
Cash Flow (HK$’000)
Operating Cash flow
Investing Cash flow
Financing Cash flow
Exchange gain
Net cash flow
Cash at the beginning
Cash at the end

4.93%

2009
660,870
49,950
14,763
8,197
6,391
2009
(23,466)
(17,622)
(67,821)
(218)
(108,909)
172,884
63,757

2010
675,959
31,393
(13,742)
(15,234)
(17,281)
2010
111,540
(30,009)
(57,757)
21
23,774
63,757
87,552

Mashbat
Bukhbat
Robinhoods
Development
Other
shareholders

2011
874,961
46,538
(382,399)
(458,385)
(370,586)
2011
(28,370)
(247,824)
478,717
591
202,523
87,552
290,666

* Financial year ends March 31, Stock data as of December 31, 2011
Source: Bloomberg, Eurasia Capital

www.eurasiac.com

72
Mongolia Outlook 2012
World’s Fastest Growing Economy

31 January 2012

MONGOLIAN TELECOM JSC

Eurasia Capital Call

Mongolian Telecom (MCH) is a telecommunications services provider. It provides
traditional fixed line telephone services throughout the country using the nationwide
fixed line network; however, the network is under state ownership. The Company also
offers internet, facsimile, TV broadcasting and mobile phone services in the capital
city. A 54.7% stake of the Company is held by the Government, 40% by Korea Telecom
and the rest is on free float. MCH employs over 1,000 people.

Key Stock Data
Ticker
MCH:MO
Price (MNT)
2,700
52 Wk high (MNT)
4,501
52 Wk low (MNT)
2,500
Market cap (US$mn)
50.1
Shares outstanding
25,870,276
Avg d'ly turn'r (MNTmn)
1.2
Performance, y o y
22.9%
Valuation Ratios
P/E (3Q 2011)
507.2
P/E (2011e)
380.4
P/B (3Q 2011)
2.1
ROE (3Q 2011)
0.4%
ROA (3Q 2011)
0.3%
Share Price Performance, MNT

SELL

3,000
2,000

Nov 11

Jul 11

Sep 11

May 11

Jan 11

Mar 11

Jul 10

1,000

Nov 10

The Company’s future development will significantly depend on its privatization and
business strategy. In case Korea Telecom will not buy the state owned stake, there is
an opportunity for players such as MobiCom to acquire the Company.

4,000

Sep 10

The company’s profitability has been decreasing every year from MNT5.3bn in 2008 to
MNT2.8bn in 2009 to MNT1.8bn in 2010. During the first three quarters of 2011, the
Company operated with only MNT138mn net earnings. Recently, MCH laid off 200
workers, 140 in local settlement offices and 60 in the capital city due to the
deteriorating financial results.

5,000

May 10

MCH was the only company to provide telecommunication services in Mongolia before
the establishment of MobiCom, the first mobile phone service provider in Mongolia, in
1996. Since that time, three more mobile service providers entered the market. As
mobile service providers expanded their networks throughout the country, MCH’s
market share in the telecom sector has been decreasing.

Jan 10

Growth Outlook

Mar 10

MCH is included in the 2012 Privatization Plan approved by Parliament in early 2010.
The Government plans to completely privatize its holdings in the Company. Due to the
agreement with Korea Telecom, the Government stake will be offered to Korea
Telecom first. If Korea Telecom is not interested, the stake will be offered to the public
in an open tender. During 2011, however, no important news was realised on the
matter.

Shareholders' Structure
5.3%

State
Korea Telecom

40.0%
54.7%

Other
Shareholders

Ratios and Growth Rates
Net profit margin
EPS (MNT)
EPS growth rate
Sales growth rate
Balance Sheet (MNTmn)
Current asset
Fixed asset
Intangible asset
Total asset
Current liabilities
Long term liabilities
Shareholders' equity
Total liabilities & equity

2009
10%
107
48%
15%
2009
20,087
16,316
3,332
39,735
7,369

2010
7%
71
34%
5%
2010
21,411
16,333
4,016
41,760
8,383

3Q 2011
1%
5
nm
nm
3Q 2011
22,535
14,709
4,138
41,381
8,695

32,367
39,736

33,376
41,760

32,686
41,381

Profit & Loss (MNTmn)
Sales
Gross profit
Operating profit
Pretax profit
Net profit
Cash Flow (MNTmn)
Operating Cash flow
Investing Cash flow
Financing Cash flow
Exchange gain
Net cash flow
Cash at the beginning
Cash at the end

2009
26,655
4,193
2,703
3,089
2,776
2009
5,234
(2,328)
(1,119)
(20)
1,768
9,106
10,874

2010
25,290
3,158
1,550
2,100
1,838
2010
3,661
(3,767)
(112)
(12)
(230)
10,874
10,644

3Q 2011
17,322
928
(262)
201
138
3Q 2011
3,337
(3,757)
(213)
8
(626)
10,644
10,018

Stock data as of December 31, 2011
Source: MSE, Eurasia Capital

www.eurasiac.com

73
Mongolia Outlook 2012
World’s Fastest Growing Economy

31 January 2012

EAST ASIA MINERALS CORP

Eurasia Capital Call

East Asia Minerals Corporation (the “Company”) is listed for trading on the TSX
Venture Exchange (EAS) and operates in the mineral exploration and development
industry, specifically on properties within East Asia. In Indonesia the Company has 6
gold & copper properties, and in Mongolia it has 9 uranium properties and two
phosphate properties. The gold & copper properties form the Company’s core
Indonesia growth assets, and the uranium properties; Enger, Ingiin Nars and Ulaan
Nuur uranium properties in Mongolia.

Key Stock Data
Ticker
EAS:CN
Price (C$)
0.47
52 Wk high (C$)
8.55
52 Wk low (C$)
0.41
Market cap (US$mn)
50.7
Shares outstanding
110.22mn
Avg d'ly turn'r (US$)
223109.6
Performance, y o y
94.2%
Valuation Ratios
P/E
n/a
P/E (2011f)
n/a
P/B
2.14
ROE
24.15%
ROA
22.86%
Share Price Performance, C$

HOLD

Recent Developments
The Company has been doing the initial drilling at several sites. It is ready to
commence initial drillings at Salurgan, Sede, Kupa and Taware and its Phase 2
drilling at Binebase and Bawone, in Indonesia. In 2011, the company established
wholly owned subsidiary companies and transferred the non Miwah assets to
them. Hence wholly owned East Asia Minerals Exploratioin and EAM Teshig LLC are
becoming holding companies of the uranium and phosphate exploration prospects
in Mongolia. The company also completed 53 drill holes for a total of 2624 meters
in Mongolia in October 2011.

10

It also filed NI43 101 Resource estimate technical report on Miwah Gold project in
Indonesia. According to the company, its Inferred Resources at a 0.20 g/t gold cut
off, is estimated at 103.9 million tonnes averaging 0.94 g/t gold and 2.68 g/t silver
for 3.14 million ounces gold and 8.95 million ounces silver in near and at surface
mineralization.

8

In October 2011, the company announced the completion of US$8mn brokered
private placement and US$5mn non brokered private placement for the use of
general working capital. Also, the Company announced changes to its management
structure as well as the board of directors. Dr. Darryl Clark has resigned as CEO
Director of East Asia, and is replaced by Mr. Edward Rochette.

0

6
4

Nov 11
Dec 11

Sep 11
Oct 11

Aug 11

Jun 11
Jul 11

Apr 11
May 11

Jan 11

Feb 11
Mar 11

2

Shareholders' Structure

Growth Outlook
The Company holds 85% of Miwah project which was planned the exploration in 2012.
Miwah project lies within three contiguous Izin Usaha Pertambangan ("IUP"), also
referred to as mining business licenses which does not grant complete set of permits
mining activity including forestry access permits. To this extent, the company should
clear out the legal and regulatory situation regarding to the mining area which
overlaps with a protected forest area. This will affect the company’s plan of 2012 and
its future growth.

Sprott Asset
Management

12%
5%

4%

Franklin
Resources
incorporated

79%

Other

In terms of the uranium deposits in Mongolia, the uranium sector has not been
developed. The Parliament has announced a new law which dictates the Government
will own +34% and +51% of the license holding company’s shares for free depending
on whether the company or the Government financed the exploration.

Ratios and Growth Rates
Net profit margin
EPS
EPS growth rate
Sales growth rate
Balance Sheet (C$‘000)
Current asset
Fixed asset
Intangible asset
Total asset
Current liabilities
Long term liabilities
Shareholders' equity
Total liabilities & equity

2009
n/a
n/a
n/a

2010
n/a
n/a
n/a

2011
n/a
n/a
n/a

2009
7,476.0
16,397.1

2010
21,791.7
26,947.0

2011
10,945
33642

23,873.1
700.6

48,738.7
1,963.3
125.5
46,649.9
48,738.7

44,588
2,871.7
44.9
41671
44,588

23,172.5
24,173.1

Profit & Loss (C$‘000)
Sales
Gross profit
Operating profit
Pretax profit(loss)
Net profit
Cash Flow (C$‘000)
Operating Cash flow
Investing Cash flow
Financing Cash flow
Exchange gain
Net cash flow
Cash at the beginning
Cash at the end

Tocqueville
Asset
Management

2009

2010

2011

(9,932.2)
(9,932.2)
2009
(13,411.5)
(5,668.9)
5,390.9

(16,883.8)
(17,209.7)
(15,508.8)
2010
(2,179.9)
(8,289.8)
24,461.6

(11,781.5)
(11,762.2)
(10,666.5)
2011
(5,926.6)
(17,542.9)
12,343.6

(13,689.5)
19,084.6
5,395.1

13,991.6
5,395.1
19,386.7

(11,125.9)
19,386.7
8,260.8

* Financial year ends August 31. Stock data as of December 31, 2011
Source: Bloomberg, Eurasia Capital

www.eurasiac.com

74
Mongolia Outlook 2012
World’s Fastest Growing Economy

31 January 2012

KINCORA COPPER

Eurasia Capital Call

Kincora Copper is a mining exploration and development company focused on copper
and gold deposits in Mongolia. The company is listed on the TSX Venture Exchange as
KCC and holds 100% ownership of the Bronze Fox Copper Gold Project (Buyant
License) located 200 kilometers from the Chinese border in the southeast of Mongolia.

Key Stock Data
Ticker
KCC:CN
Price (C$)
0.31
52 Wk high (C$)
0.65
52 Wk low (C$)
0.105
Market cap (C$mn)
42.88
Shares outstanding
138.332mn
Avg d'ly turn'r (US$)
16,508.8
Performance, y o y
12.9%
Valuation Ratios
P/E
n/a
P/E (2011f)
n/a
P/B
n/a
ROE
n/a
ROA
120.47%
Share Price Performance, C$

UNDER REVIEW

0.6
0.5
0.4
0.3
0.2
0.1

Stock options to its directors, officers, employees and consultants

The geological team is working throughout the winter to review all of the historic and
recent geological information in order to optimize the exploration efforts for the next
drilling season in March 2012. Kincora plans to carry out a high resolution ground
magnetic survey program. The objective of this survey is to map structure and
alterations associated with magnetite destruction, and also to highlight any magnetic
intrusions, especially for the covered terrain which composes significant parts of the
license area. Additionally the company is looking for acquisition of additional top
quality copper and gold projects in Mongolia and moving to pre feasibility work and
development. At present, the Company’s operations do not generate cash inflows and
its financial success is dependent on management’s ability to discover economically
viable mineral deposits and an equity sale is the way to fuel its exploration
expenditures.
2009
n/a
n/a
n/a
n/a
2009
1,570.0
1,150.0

2010
n/a
n/a
n/a
n/a
2010
200.0

2,720.0
1,760.0
130.0
830.0
2,720.0

200.0
990.0

3Q 2011
n/a
n/a
n/a
n/a
3Q 2011
6,407.0
37,419.0
N/A
43,826.0
1,034.0

(790.0)
200.0

42,792.0
43,826.0

3 Dec

3 Oct

Shareholders' Structure

Growth Outlook

Ratios and Growth Rates
Net profit margin
EPS
EPS growth rate
Sales growth rate
Balance Sheet (C$ ‘000)
Current asset
Fixed asset
Intangible asset
Total asset
Current liabilities
Long term liabilities
Shareholders' equity
Total liabilities & equity

3 Nov

3 Jul

3 Jan

3 Sep

0

In July, the Company announced that it had retained First Canadian Capital
Corp. ("First Canadian) to provide strategic marketing and investor relations
service.

3 Aug

In July, the Company announced the completion of its acquistition of a 75% in
Kincora Group Ltd by issuing 49mn common shares to Origo and paid US$6mn
to Mr. Khojgor and invested US$4.5mn.

0.7

3 Jun

On April 11, 2011, the Company issued 2.4mn common shares at C$0.09 per
share to settle outstanding debt in the amount of C$217,400 and also the
company completed a private placement with total proceeds of C$1.6mn in
tranches.

3 Apr

Highlights:

3 May

Former Brazilian Diamonds, Kincora Copper acquired the full ownership of Kincora
Group. The company commenced 10,000m drilling campaign in 2011. It has
focused on 13% of the license area and drilled 23 holes in 2011 to a total depth of
over 12,000m. The Company has also completed a soil sampling exercise over the
area at a grid of 200m and a rock chip sampling exercise at 2m intervals. There are
currently a large number of assays still outstanding and these results are being
received on a daily basis. Rock chip sampling with 1716 samples in the existing
Russian trenches was conducted and 8 out of which has been returned with 0.5
3.05g/t Au and 3 samples with +19g/t Au.

3 Feb
3 Mar

Recent developments

Profit & Loss (C$ ‘000)
Sales
Gross profit
Operating profit
Pretax profit
Net profit
Cash Flow (C$ ‘000)
Operating Cash flow
Investing Cash flow
Financing Cash flow
Exchange gain
Net cash flow
Cash at the beginning
Cash at the end

Origo Partners
Plc

33%

Khojgor
Duchintav
20%

Massif Ltd

45%
Others
2%

2009
n/a
n/a
(1,320.0)
(1,320.0)
(1,320.0)
2009
(560.0)
570.0
(10.0)

2010
n/a
n/a
(1,090.0)
(1,710.0)
(1,710.0)
2010
(780.0)
850.0

10.0
77.0
87.0

80.0
87.0
167.0

3Q 2011
n/a
n/a
n/a
n/a
n/a
3Q 2011
(732.0)
(6,724.0)
13,536.0
(279)
6,080
167.0
6,247

Stock data as of December 31, 2011
Source: Bloomberg, Eurasia Capital

www.eurasiac.com

75
Mongolia Outlook 2012
World’s Fastest Growing Economy

31 January 2012

SOLARTECH INTERNATIONAL HOLDINGS LTD

Eurasia Capital Call

Solartech International Holdings Ltd., incorporated in Bermuda and listed on the Hong
Kong Stock Exchange, is principally engaged in the business of manufacturing and
trading of cables and wires, copper rods and connectors and terminals. By the end of
its 2010 financial year (June 30), Solartech disposed of its manufacturing and trading of
connector and terminals business. Most of Solartech’s turnover is generated in
American market (55.0%) and Mainland China and Hong Kong markets (36.7%).
However, the company is working to focus and deploy its resources on the businesses
of manufacturing and trading of copper products and cable and wires based in
Mainland China and has begun to shift more heavily into resource exploration and
extraction.

Key Stock Data
Ticker
1166:HK
Price (HK$)
0.177
52 Wk high (HK$)
1.1
52 Wk low (HK$)
0.145
Market cap (US$mn)
40.24
Shares outstanding (mn)
1765.8
Avg d'ly turn'r (US$mn)
0.227
Performance, y o y
81.6%
Valuation Ratios
P/E
n/a
Earnings Yield
n/a
P/B
0.12
ROE
19.3%
ROA
17.2%
Share Price Performance, HK$
0.9
0.7
0.5
0.3
Nov 11
Dec 11

Sep 11
Oct 11

Aug 11

0.1
Jun 11
Jul 11

In May 2010, Solartech acquired Ikh Shijir Erdene LLC, a company incorporated in
Mongolia with exploration and mining licenses covering 3,112.5ha and 351.26ha,
respectively, including total resources of 1.44Mt of copper, for the Bor Teeg
Copper Gold Project. The acquisition was valued at HK$1.5bn with HK$1,432.0mn
worth of convertible bonds issued by Solartech to the vendor and HK$68.0mn in
cash.

1.1

Apr 11
May 11

Solartech entered into a placing agreement with Kingston Securities Ltd. in
September 2010 to place up to 7.2bn shares on a fully underwritten basis for
aggregate net proceeds of HK$140mn.

Jan 11

Solartech announced in January 2011 that it entered into an MOU in relation to
acquisition of a company holding a mining license and two exploration licenses of
rare earth located in Tuv province of Mongolia. The target company is called
Vangyunshing LLC incorporated in Mongolia.

Feb 11
Mar 11

Recent Developments

UNDER REVIEW

Growth Outlook
Solartech is very sensitive to global commodity prices, particularly copper prices as the
company’s major business is manufacturing and trading of copper rods, cables and
wires. Further, as the company explains the competition is putting downward pressure
on prices of the products. This may explain the significant decline is share prices in the
market. Therefore, we believe that upside potential is limited from the main
operations. In 2011, the company finished the financial year with a positive net profit;
however, this is due to large change in fair value of convertible bonds that have put
option properties and change in fair value of derivative instruments.

Shareholders' Structure
Top Esteem
Holdings Ltd.

10%
10%
14%

Luckyman
Assets
Management

66%

On the mining front, the company has not completed the acquisition of rare earth
assets in Mongolia, and it is still uncertain if it advances any plans in this regard.

Ratios and Growth Rates
Net profit margin
EPS (HK¢)
EPS growth rate
Sales growth rate
Balance Sheet (HK$'000)
Current asset
Non current asset
Total asset
Current liabilities
Long term liabilities
Shareholders' equity
Total liabilities & equity

2009
(46.6%)
n/a
n/a
(67.0%)
2009
557.2
553.1
1,110.3
444.2
40.1
626.0
1,110.3

2010
(9.6%)
(8.32)
n/a
23.5%
2010
618.4
1,704.9
2,323.3
368.3
1,052.9
902.1
2,323.3

2011
50.0%
33.12
n/a
(49.6%)
2011
558.7
1,497.2
2,055.9
201.5
22.6
1,831.9
2,055.9

Profit & Loss (HK$mn)
Sales
Gross profit
Pretax profit
Net profit
Cash Flow (HK$'000)
Operating Cash flow
Investing Cash flow
Financing Cash flow
Exchange gain
Net cash flow
Cash at the beginning
Cash at the end

Mr. Soyol
Samdam

Others

2009
1136.9
69.9
(450.6)
(529.5)
2009
87.3
46.7
(99.1)
(16.7)
34.9
80.2
98.4

2010
1,404.3
194.7
(106.3)
(134.6)
2010
(74.5)
(103.8)
293.5
3.5
115.3
98.4
217.2

2011
707.5
30.9
356.7
353.9
2011
(46.2)
0.656
5.8
3.9
(39.8)
217.2
181.4

* Financial year ends June 30. Stock data as of December 31, 2011
Source: Company data, Bloomberg, Eurasia Capital

www.eurasiac.com

76
Mongolia Outlook 2012
World’s Fastest Growing Economy

31 January 2012

MODUN RESOURCES

Eurasia Capital Call

Modun Resources (MOU) is a Mongolia focused coal exploration company listed on
ASX. Previously the company engaged in web based direct marketing and sales
business under the name of TVN Corporation. The company’s name was changed to
Modun Resources in November 2011 reflecting the company’s focus on Mongolia. In
June 2011 the company entered into option agreement to acquire Nuurst coal project.
The Nuurst Project has JORC compliant 489Mt of thermal coal resources under a 3,451
hectare exploration license located 120kms south of Ulaanbaatar and 6km from
existing rail infrastructure.

Key Stock Data
Ticker
Price (A$)
52 Wk high (A$)
52 Wk low (A$)
Market cap (US$mn)
Shares outstanding (mn)
Avg d'ly turn'r (US$)
Performance, y o y
Valuation Ratios
P/E
P/E (2012f)
P/B
ROE
ROA
Share Price Performance, A$

SELL

Dec 11

Oct 11

Nov 11

Sep 11

Jul 11

Aug 11

Jun 11

Apr 11

We believe that the strong economic growth in China and other emerging markets
around the world which are creating increased demand for various commodities such
as coal among others is expected to continue to do so in coming decades. As global
engine of economic growth is shifting towards China and Asia resource companies
such as Modun Resources are poised to take advantage of this growth given the
positive exploration results and mineral reserves.

n/a
n/a
78.5
(249%)
(217%)

0.08
0.07
0.06
0.05
0.04
0.03
0.02
0.01
0.00
May 11

Growth Outlook

Jan 11

In July 2011, the company has placed 76 million shares at A$0.02 to raise
A$1.52mn to fund the 100% acquisition of the Nuurst coal project. In the same
month the company started its drilling program on Nuurst. Furthermore in August
2011, the company has also placed 90 million shares at A$0.04 to raise A$3.6mn
for exploration activities. The drilling program on Nuurst project has been
completed and JORC compliant 489mt of coal resource was announced in early
December 2011.

Feb 11
Mar 11

Recent Developments

TVN:AU
0.045
0.071
0.009
34.5
767.9
399,000
350%

Shareholders' Structure
4.97%
9.97%

3.74%
3.60%

Warner Hugh
RZJ Capital
Management
Gribble Anne
Batavia
Capital

77.72%

Other
shareholders

Ratios and Growth Rates
Net profit margin
EPS (A$ cents)
EPS growth rate
Sales growth rate
Balance Sheet (A$’000)
Current asset
Fixed asset
Intangible asset
Total asset
Current liabilities
Long term liabilities
Shareholders' equity
Total liabilities & equity

2009
n/a
(0.19)
n/a
n/a
2009
631.2
2.9

2010
n/a
(0.14)
n/a
n/a
2010
420.4
1.5

2011
n/a
(0.22)
n/a
n/a
2011
449.1
7.1

634.1
33.3

421.9
39.4

456.2
59.2

600.8
634.1

382.5
421.9

397
456.2

Profit & Loss (A$’000)
Sales
Gross profit
Operating profit
Pretax profit
Net profit
Cash Flow (A$’000)
Operating Cash flow
Investing Cash flow
Financing Cash flow
Exchange gain
Net cash flow
Cash at the beginning
Cash at the end

2009
n/a
n/a
(603.3)
(603.3)
(603.3)
2009
(529.8)
(22.1)
6.7

2010
n/a
n/a
(501.5)
(501.5)
(501.5)
2010
(521.9)

(545.2)
1,153
607.8

(240.9)
607.9
367

281

2011
n/a
n/a
(992.3)
(992.3)
(992.3)
2011
(928.5)
(2.9)
960.1
(0.7)
28.6
367
394.9

* Financial year ends June 30. Stock data as of December 31, 2011
Source: Bloomberg, Eurasia Capital

www.eurasiac.com

77
Mongolia Outlook 2012
World’s Fastest Growing Economy

31 January 2012

ERDENE RESOURCE DEVELOPMENT

Eurasia Capital Call

Formerly listed on the RSX Venture exchange under the symbol of ERD, Erdene
Resource Development (The company) is a resource exploration and development
company listed on the Toronto Stock Exchange with two core projects: the Donkin Coal
Project (25%) in Nova Scotia with Xstrata Coal and the Zuun Mod Molybdenum Copper
Project in Mongolia. Erdene also has numerous non core projects including kaolin and
aggregate interests. The Company’s long term focus remains the discovery and
development of large tonnage, low cost, gold, copper, molybdenum, and coal deposits
in Mongolia; and the development of its coal and industrial mineral interests in North
America.

Key Stock Data
Ticker
Price (C$)
52 Wk high (C$)
52 Wk low (C$)
Market cap (US$mn)
Shares outstanding
Avg d'ly turn'r (C$)
Performance, y o y
Valuation Ratios
P/E
P/E (2011f)
P/B
ROE
ROA
Share Price Performance, C$

BUY

1.5
1
0.5

The company operates a kaolin processing plant in Dearing, Georgia, USA through
its subsidiary APM. In October 2011, APM announced the denial of its application
to mine kaolin from its Cofer and surrounding properties.

2009
n/a
n/a
n/a
n/a
2009
14,480.3
46,744.7

2010
n/a
n/a
n/a
240%
2010
9,249.2
46,744.7

3Q 2011
n/a
n/a
n/a
32.2%
3Q 2011
4,323.8
46,693.5

58,646.6
489.9
5,895.0
52,261.6
58,646.6

55,994.0
922.8
5,236.1
49,835.9
55,994.0

51,017.4
760.7
5,259.3
44,997.3
51,017.4

3 Dec

3 Oct

3 Nov

3 Sep

3 Jul

3 Jan

Shareholders' Structure

Growth Outlook
Even though the JORC estimate carried out, the current market price of molybdenum
is making the project not feasible. The share price has fallen down since its IPO in
Canada due to the recent European debt crisis and slower growth of China’s economy.
However on the upside the company owns 25% of Donkin Coal project which has a
US$1.06bn NPV at 8% discount rate. The Company will continue its mineral exploration
and development projects in Mongolia.

Ratios and Growth Rates
Net profit margin
EPS (MNT)
EPS growth rate
Sales growth rate
Balance Sheet (C$ ‘000)
Current asset
Fixed asset
Intangible asset
Total asset
Current liabilities
Long term liabilities
Shareholders' equity
Total liabilities & equity

3 Aug

0

Exploration work continued on the Tsenher Nomin property. Exploration work has
identified unknown gold and base metal mineral occurrences and two drilling at
Nomin Tal and Altan Nar, reporting the very encouraging initial results.

3 Jun

Minarco MineConsult updated resource estimate of Zuun Mod project,
representing a Measured and Indicated resource of 218Mt at an average grade of
0.057% Mo, and 0.069% Cu at a cut off grade of 0.04% Mo. This equates to 273.5
M lbs of contained Mo metal and 330.7 M lbs of contained Cu metal.

n/a
n/a
2.23
6.99%
6.22%

2

3 Apr

In June, the Company announced the receipt of a National Instrument 43 101
complaint Technical Report for the Donkin Coal Project, showing the Pre Feasibility
study. The resource and inferred resource is 227mn tonne and 254 mn tonne,
respectively.

3 May

The company completed the private placement financing announced on 16th
November with the total proceeds of US$2.0mn to fund the exploration projects in
Mongolia and for working capital.

3 Feb
3 Mar

Recent Developments

ERD:CN
0.375
1.84
0.31
33.15
90.32mn
108,844
69.7%

Profit & Loss (C$ ‘000)
Sales
Gross profit
Operating profit
Pretax profit
Net profit
Cash Flow (C$ ‘000)
Operating Cash flow
Investing Cash flow
Financing Cash flow
Exchange gain
Net cash flow
Cash at the beginning
Cash at the end

9%

2%
2%

AGF
Investments Inc
Byrne John P
Global Strategy
Financial inc

88%

other

2009
167.9
(3,569.6)

2010
526.5
(2,786.8)

3Q 2011
696.2
(254.0)

(3,146.3)
(2,177.0
2009
(3,651.7)
1,220.7

(4,509.7)
(3,567.5)
2010
(3,360.0)
(2,020.0)
150.0

(2,430.9)
16,195.1
13,764.1

(5,230.0)
13,764.1
8,379.2

(7,943.8)
(7,951.3)
3Q 2011
(3,545.6)
(1,522.1)
440.2
43.8
(4,583.7)
8,379.2
3,795.5

Stock data as of December 31, 2011
Source: Bloomberg, Eurasia Capital

www.eurasiac.com

78
Mongolia Outlook 2012
World’s Fastest Growing Economy

31 January 2012

NORTH ASIA RESOURCES HOLDINGS

Eurasia Capital Call

North Asia Resources (NAR), previously known as Green Global Resource Ltd., is a
Hong Kong listed mineral exploration and development company with main operations
in Mongolia. NAR owns a 99.99% interest in Golden Pogada LLC, which holds a
mining right license for a 12.01 square km iron ore mine (Oyut Ovoo Mine) located
in south central Mongolia. Dadizi Yuan LLC, a wholly owned subsidiary of the Group,
holds mining and exploration licenses in respect of two alluvial gold mines, located in
Khar Yamaat Khongor and Sharin Gol Soum of Darkhan Uul aimag, Mongolia.

Key Stock Data
Ticker
61:HK
Price (HK$)
0.22
52 Wk high (HK$)
1.36
52 Wk low (HK$)
0.2
Market cap (US$mn)
32.52
Shares outstanding (mn)
1,138.01
Avg d'ly turn'r 6M (US$mn)
0.05
Performance, y o y
75.6%
Valuation Ratios
P/E
Earnings Yield
P/B
0.2
ROE
ROA
Share Price Performance, HK$

UNDER REVIEW

Dec 11

Oct 11

Nov 11

Sep 11

Jul 11

Aug 11

Jun 11

We are cautious about NAR’s ability to ramp up production significantly in near term.

Apr 11

Growth Outlook

May 11

On May 25, 2011 the company terminated a framework agreement for the
acquisition of two additional iron mines in Mongolia. NAR did not complete any
acquisitions of mining and resources businesses during 2Q 2011.

1.6
1.4
1.2
1
0.8
0.6
0.4
0.2
0
Mar 11

The company produced approximately 13,000 tonnes of iron ore products during
the trial production phase up to 30 June 2011, however, didn’t sale any iron ore
products. The raw alluvial gold previously recovered from the Gold Mines
during the trial production in 2010 was successfully sold during the period. The
gold was weighed and made into 5kg gold bars which were sold to the Trade and
Development Bank of Mongolia.

Jan 11

In June 2011, NAR’s non wholly owned Mongolian subsidiary, Global Link
Logistics LLC, entered into a coal transportation agreement with a Mongolian
coal mining company, whereby Global Link has agreed to transport coal
products from one of its coal mines to the unloading station near the Gants
Mod border using heavy duty trucks.

Feb 11

Recent Developments

Shareholders' Structure
ULTRA ASSET INTL
LTD
MOUNTAIN SKY RES
MON
KONG XIANGHU

16%

GREAT METAL
GROUP CO
TAK CHEUNG YAM

14%
52%

CHEN YUN

8%

DIMENSIONAL FUND
ADV
TSE MICHAEL NAM

4%
1%

Ratios and Growth Rates
Net profit margin
EPS (pence)
Gross profit margin
Sales growth rate
Balance Sheet (US$mn)
Current asset
Fixed asset
Total asset
Total liabilities
Shareholders' equity
Total liabilities & equity

2009

2010

17.9%
2009
34.3
2.8
572.9
85.5
487.4
572.9

38.4%
2010
40.7
13.3
220.8
62.9
157.9
220.8

3Q 2011

3Q 2011

Profit & Loss (US$mn)
Revenue
Gross profit
Pretax profit
Net profit
Cash Flow (US$mn)
Operating Cash flow
Investing Cash flow
Financing Cash flow
Exchange gain
Cash at the beginning
Cash at the end

2%

2%

Others

1%

2009
6.6
1.6
4.1
24.0
2009
1.1
0.6
0.5

2010
4.1
1.3
391.2
387.4
2010
4.8
12.3
55.1

3Q 2011

1.4
0.1

0.1
39.3

39.3
4.2

3Q 2011
5.2
5.1
4.9

Stock data as of December 31, 2011
Source: Company data, Bloomberg, Eurasia Capital

www.eurasiac.com

79
Mongolia Outlook 2012
World’s Fastest Growing Economy

31 January 2012

CONTACTS
Research
Sardor Koshnazarov
Dosbergen Musaev
Akmal Aminov
Rentsendorj Yondon

Head of Research, Oil & Gas
Chief economist
Associate, Metals & Mining
Associate, Mongolia Equities

sardor.koshnazarov@eurasiac.com
dosbergen.musaev@eurasiac.com
akmal.aminov@eurasiac.com
rentsendorj.yondon@eurasiac.com

Sales and Trading
Zhyldyz Sadyralieva
Hoosniddin Hakimov
Bolor Ulziisaikhan
Narantsatsral Batgerel

Associate
Associate
Associate
Broker

zhyldyz.sadyralieva@eurasiac.com
hoosniddin.hakimov@eurasiac.com
bolor.ulziisaikhan@eurasiac.com
narantsatsral.batgerel@eurasiac.com

Addresses:
MONGOLIA
th
Suite 65, 6 Floor, Grand Office Center
st
Jamiyangun Street 12, 1 Khoroo,
Ulaanbaatar
Tel: +976 7013 0078
Fax: +976 7013 0078

Eurasia Capital is the leading investment bank, focused on Mongolia and other resource rich Asian countries. The Firm
provides capital raising, cross border M&A advisory, sales & trading and research services. Eurasia Capital offers its services
to its international and regional clients including government organizations, sovereign wealth funds, resource companies,
private equity groups and global portfolio investors. The Firm has major emphasis on resources sector, including key
commodities such as gold, copper, coal, iron ore and oil & gas. For more info, please visit our website: www.eurasiac.com

DISCLAIMER
This report is made for information purposes only, and does not constitute an offer, solicitation of an offer to purchase, hold, sell, invest or make any other
financial decision. In making decisions, investors may rely on their own examinations of the parties and risks involved. Information contained in this report is
obtained from the sources believed to be accurate and reliable. Because of the possibility of human or mechanical error as well as other factors such
information provided 'as is" without warranty of any kind and Eurasia Capital Ltd., in particular, make no representation or warranty, express or implied, as to
accuracy, timeliness, completeness, merchantability or fitness for any particular purpose of any such information. Under no circumstances, Eurasia Capital Ltd.
have any liability to any person or entity ( ies) for (a) any loss or damage in whole or in part caused by, resulting from, or relating to, any error (negligible or
otherwise) or other circumstances or contingency within or outside the control of any of their directors, managements, officers, employees, or agents in
connection with compilation, analysis, interpretation, communication, publication or delivery of any such information, or (b) any direct, indirect, special,
consequential, compensatory or incidental damages whatsoever (including without limitation, loss profits) even if Eurasia Capital Ltd. is advised in advance of
the possibility of such damages, resulting from the use of or inability to use, any such information.

©2012 Eurasia Capital Ltd. All rights reserved.

www.eurasiac.com

80

Eurasiamongoliaoutlook2012

  • 2.
    Mongolia Outlook 2012 World’sFastest Growing Economy 31 January 2012 Copyright © 2012 Eurasia Capital Ltd. All rights reserved. This report or any portion thereof may not be reproduced or used in any manner whatsoever without the express written permission of Eurasia Capital except for the use of brief quotations. Eurasia Capital Ltd. th Suite 65, 6 Floor, Grand Office Center st Jamiyangun Street 12, 1 Khoroo Ulaanbaatar, Mongolia www.eurasiac.com www.eurasiac.com 1
  • 3.
    Mongolia Outlook 2012 World’sFastest Growing Economy 31 January 2012 CONTENTS Summary...................................................................................................................................................3 2011 At a Glance.......................................................................................................................................4 Economy ...................................................................................................................................................7 The Year of Records......................................................................................... 7 Trade Exceeds US$11bn .................................................................................. 8 Robust FDI Inflows and M&A Activity .............................................................9 Expansive Fiscal Policy..................................................................................... 9 Inflation Contained by Tight Monetary Policy.................................................11 Politics.......................................................................................................................................................13 Parliamentary Elections................................................................................... 13 Global Economy........................................................................................................................................15 Commodities: Bullish Amid Modest Global Growth.................................................................................16 Mining.......................................................................................................................................................17 Banking .....................................................................................................................................................20 Asset Classes.............................................................................................................................................26 Local Equities: Second Best Performing Market Globally ...............................26 International Equities ...................................................................................... 33 Mongolian Tugrik ............................................................................................ 34 Fixed Income ................................................................................................... 36 Property........................................................................................................... 38 Private Equity .................................................................................................. 40 Infrastructure .................................................................................................. 42 Annex 1: 2011 M&A League table ............................................................................................................45 Annex 2: Silk Road Composite Index Companies......................................................................................46 Annex 3: Silk Road Hong Kong Index Companies .....................................................................................48 Annex 4: Silk Road Australia Index Companies.........................................................................................48 Annex 5: Silk Road Mongolia Index Companies........................................................................................49 Contacts....................................................................................................................................................80 www.eurasiac.com 2
  • 4.
    Mongolia Outlook 2012 World’sFastest Growing Economy 31 January 2012 SUMMARY Mongolia continued its strong performance in 2011 in terms of the pace of economic growth, equity market, exports and foreign direct investment inflows. The country’s performance in 2011 has exceeded nearly all our projections we made in our Mongolia Outlook 2011 report published in January 2011. We estimate Mongolia overtook Qatar and has become the world’s fastest growing economy in 20111. Investor sentiment and attractive valuations have supported the stock market and ranked this frontier market as the second best equity market globally last year. Robust international commodity prices and firm demand in China, the key market for Mongolian commodities, have boosted exports to an all time high. Accelerated development of the Oyu Tolgoi project and investor appetite for quality resource assets have attracted a record level of foreign direct investments. We believe that Mongolia that is emerging as a key commodity supplier in Asia will continue its stellar performance through 2012 and beyond. We project Mongolia to experience astonishing 20% GDP growth this year, further solidifying its undisputable position as the world’s fastest growing economy in 2012. Substantial increase in exports (in particular, coal and iron ore), government spending, investments in major mining projects, primarily in Oyu Tolgoi and rapid surge in consumer spending will be the key drivers of the growth this year. We remain bullish on MSE listed equities in 2012. We expect the Mongolian equities to benefit from increased capital inflows and estimate the MSE TOP 20 Index to reach 28,000 by the end of this year, or +30% gain for 2012. We favor small caps that will outperform the index due to high growth of their businesses buoyed from low base effect and attractive valuations. We anticipate more IPOs and secondary offerings of Mongolian companies, both domestically and internationally, especially much anticipated jumbo IPO of Erdenes Tavan Tolgoi. Therefore, we strongly recommend our clients to invest in the Mongolian local equities as the most effective way to gain exposure to the Mongolian growth story. We target the Silk Road Mongolia Index (SILKMN) that includes Mongolia focused internationally and selected locally listed companies to reach 1,330 (+20% growth) in 2012, to be somewhat weighed down by expected subdue share performance of Ivanhoe Mines, the largest component of SILKMN index. SILKMN index finished 2011 poorly, down 27% due to negative investor sentiments toward emerging/frontier markets, triggered by the EU debt crisis and risk aversion. As a result, Mongolia related stocks have been unjustifiably oversold last year. We advise investors to snap up the most beaten up stocks as the companies’ strong fundamentals and value of their resource assets become more apparent. Our key investment themes in 2012 are opportunities across asset classes local and international equities, fixed income, private equity and real estate. Our top picks for the next 12 months among local stocks are Tavan Tolgoi (coking coal), APU (beverages), Remicon (construction materials) and Mongolia Development Resources (property). Mongolian Mining Corp. (coking coal), Prophecy Coal (thermal coal, power), Entrée Gold (gold) and Erdene Resource Development (molybdenum, coal) are our top picks among the SILMN index companies. 1 We assume that the economy of Qatar is estimated to have grown 15% in 2011, according to “Qatar Economic Outlook 2011 2012” report published by the General Secretariat of Development Planning of Qatar on October 1, 2011. www.eurasiac.com 3
  • 5.
    Mongolia Outlook 2012 World’sFastest Growing Economy 31 January 2012 2011 AT A GLANCE World’s fastest growing economy Our call made in our “Mongolia Outlook 2011” published on January 11, 2011, for the growth of the Mongolian economy played out as the Mongolian GDP grew 17.3% in real terms last year (vs our 10% growth target) and is likely to have become the world’s fastest growing economy outperforming Qatar (The General Secretariat for Development Planning of Qatar projected a 15% growth rate in 2011). Record high exports, investments, government spending and consumption have transformed the domestic economy and driven the growth. Second best equity market globally As we estimated in January last year the Mongolian stock exchange has maintained the top two best equity market globally in 2011 with an impressive growth of 32.6% in US$ terms (compared to Iraq Stock Exchange +35%). After being the best in 2010, MSE benefitted from improved investor sentiment and attractive valuations last year. Beating record FDI Foreign direct investments (FDI) hit a record level of US$3.8bn last year as we estimated. The ongoing Oyu Tolgoi, operating key coal and other mineral projects and exploration stage mines have attracted substantial capital amid robust demand in China and untapped potential in the resource rich country. Mongolia also saw robust M&A activity with most of the deals being struck in the mining sector. We estimate that M&A deal values amounted to over US$2bn. Foreign trade all time high In 2011, the Mongolian foreign trade surpassed its historical high set a year earlier, in line with our projections. Total trade turnover surged 85.1% y o y to US$11.3bn. Exports registered back to back record years growing 64.4% y o y to US$4.8bn in 2011 thanks to high international prices for key export commodities and physical volume expansion. China remained the biggest trading partner of Mongolia accounting for 56.7% of total trade, including 92.1% of exports and 30.8% of imports. Coal production exceeded 30Mt and exports 21Mt in 2011 that enabled Mongolia to overtake Australia as the biggest coking coal supplier to China. Moreover, China surpassed Russia in terms of selling more goods and services to Mongolia and became largest importer to the country. Government spending feeding expansion The economy experienced record fiscal expansion in 2011. General government expenditure surged 55.6% y o y to US$3.8bn. The budget performed extremely well for most of 2011 registering around 3% surplus at the end of 3Q2011. State budget flipped into US$310mn or 3.6% of GDP deficit at the end of the year with increased government expenditure, particularly capital spending and government consumption. Capital spending jumped 80.6% y o y to US$843.3mn. A 23.6% increase in public sector salaries and wages and 59.3% rise in subsidies and transfers, including almost 150% jump in social cash transfers supported strong private sector consumption. www.eurasiac.com 4
  • 6.
    Mongolia Outlook 2012 World’sFastest Growing Economy 31 January 2012 Long term bullish on MNT Our call made on January 31, 2011 that the MNT may repeat global outperformance and continue appreciating another 10% in 2011 played out well in 1H2011. However, in 2H2011, MNT weakened on the back of the heightened global market volatility. The currency strengthened 5% to MNT1,195 per US$ through April 1 after which it has weakened 16.8% by end 2011 to MNT1,396 amid expanding current account deficit to US$2.4bn (end 2011) fuelled primarily by more than expected increase in imports of capital goods for mining projects. Booming banking sector Mongolian banking sector expanded a record rate of 50.1% y o y in assets to MNT9,372bn (US$6.7bn), compared with 41.2% in 2010 (assets to GDP ratio reached to the new high of 86.5%). Deposits surged 40% y o y last year as individuals and business entities as well as international institutions, which benefitted from significant increase in disposable income and sought portfolio diversification viewed the strength of the local currency MNT and high interest rates as a good investment. A year active with RTOs In 2011 mining IPOs were not as dynamic as in 2010. There was only one full fledged IPO on ASX by FeOre Ltd (FEO:AU), a Mongolia focused iron ore explorer, who raised A$35mn. In 2011 several companies came to the market through reverse takeover (RTO) of Mongolian assets (exploration licences). These companies, Draig Resources Ltd. (former C@ Ltd), Modun Resources Ltd. (former TVN Corp. Ltd), UTMI (former Wedge Energy International Inc.), Mongolian Resources Corp. Ltd (former Alamar Resources Ltd) and Kincora Copper Ltd. (former Brazilian Diamonds Ltd.), are currently trading on stock exchanges in Australia and Canada. Erdenes Tavan Tolgoi IPO delayed Much anticipated IPO of Erdenes Tavan Tolgoi, the state owned enterprise that holds the mining licence for the world’s largest untapped coking coal mine, didn’t take place in 2011 as it was expected. Early in July, the Government announced that it has selected China’s Shenhua Energy Company, U.S. Peabody Energy Corp. and Russian Mongolian consortium to develop the Western Tsankhi area of the Tavan Tolgoi mine. However, due to the public pressure and dissatisfaction among the bidders over the selection process as well as refusal by the National Security Council the Government had to backtrack on the deal. Later the Government resumed negotiations with all bidders and announced that Erdenes Tavan Tolgoi may raise more than US$3bn in IPO on the Mongolian and London Stock Exchanges by July 2012. Strengthening political ties 2011 was a successful year in the political life of Mongolia. The resource rich country signed a Strategic Partnership Agreement with China in June 2011. We expect the agreement to expand cooperation and bolster economic ties, and add further impetus to Chinese investments into and exports from Mongolia. As a result of bilateral visits of the state leaders, Mongolia and South Korea agreed to elevate relations to a “Comprehensive Partnership” status that seeks to expand cooperation in resource and infrastructure www.eurasiac.com 5
  • 7.
    Mongolia Outlook 2012 World’sFastest Growing Economy 31 January 2012 development. As a landlocked country, Mongolia puts emphasis on developing balanced relations with its two large neighbours and countries beyond or “third neighbours” through high level official visits by President and Prime Minister of Mongolia to USA, Australia, Italy and the Middle East countries. www.eurasiac.com 6
  • 8.
    Mongolia Outlook 2012 World’sFastest Growing Economy 31 January 2012 ECONOMY The Year of Records We estimate Mongolia was the world’s fastest growing economy in 2011. It registered record real GDP growth of 17.3% y o y and hit our 10% projection made in January last year. Growth was supported by record investments, exports and government spending. GDP Performance 14 25 12 20 10 15 8 10 6 Foreign direct investments (FDI), exports and 5 industrial output were driven by insatiable 4 Chinese demand for commodities. FDI reached 0 2 historical high US$3.8bn in 2011, a huge boon to 0 5 US$6.2bn (Y2010) Mongolian economy. In our 2007 2008 2009 2010 2011 2012F estimate, over 80% of FDI went into mining. GDP, US$bn (LHS) Real GDP growth, % (RHS) Mongolian exports registered back to back record years with exports reaching US$4.8bn in 2011. Source: National Statistics Office of Mongolia (NSOM), IMF, Eurasia Exports grew 64.4% y o y thanks to high Capital international prices for key export commodities and physical volume expansion. Industrial output increased 9.7% y o y, including 9.5% in mining and 11.6% in manufacturing. Coal production exceeded 30Mt rising 22.6% y o y in 2011. Iron ore output nearly doubled reaching 5.7Mt from 3.20Mt in 2010. Crude oil output rose 16.8% to 2.55MMbbl. Manufacturing expanded 11.6% y o y in 2011 with major industries such as food and beverages growing 10.5%, production of non metallic mineral products 40.5% and small 1.7% y o y advance in textiles. Expansive fiscal policy supported impressive GDP growth in 2011. Total government expenditure increased 55.6% y o y to record US$3.79bn. Capital spending surged 80.6% to US$843.3mn. Increases in public sector salaries led to 23.6% growth in government spending on salaries and wages. Private consumption was supported by 59.3% y o y increase in social cash transfers and subsidies. Albeit significant increase in government spending, state budget deficit remained small at about US$310mn or 3.6% of GDP. The deficit is much smaller than initially budgeted 9.9% of GDP. The state coffers were boosted by high price of mineral exports with mining sector accounting for about one third of government revenue. Tight monetary policy kept inflation in check at 10.2%. Significant depreciation of the national currency in the second half of 2011 alleviated risks of mining crowding out other industries in the economy. Cheaper currency is allowing time to other industries to adapt to rapid structural changes in the economy. Meanwhile, the Bank of Mongolia maintains record US$2.5bn hard currency reserves to fight any sudden swing in exchange rate in either direction. Overall, macroeconomic fundamentals of Mongolia have probably never been better. We project Mongolia to experience astonishing 20% GDP growth this year, further solidifying its undisputable position as the world’s fastest growing economy in 2012. www.eurasiac.com 7
  • 9.
    Mongolia Outlook 2012 World’sFastest Growing Economy 31 January 2012 Substantial increase in exports (in particular, coal and iron ore), government spending, investments in major mining projects, primarily in Oyu Tolgoi and rapid surge in consumer spending will be the key drivers of the growth this year. Trade Exceeds US$11bn In 2011, Mongolian foreign trade surpassed its historical highs set in the previous year, in line with our projections. Robust international commodity prices and firm demand in China, the key market for Mongolian commodities, have boosted exports to an all time high. Total trade turnover surged 85.1% y o y to US$11.3bn. China remained the biggest trading partner of Mongolia accounting for 56.7% of its total trade, including 92.1% of exports and 30.8% of imports. Last year China overtook Russia as Mongolia’s largest imports market. China remains vastly the largest export market for Mongolian goods. It primarily buys natural resources from Mongolia. Its demand for commodities fuelled 64.4% y o y growth in Mongolian exports to record US$4.8bn. The country purchases almost 100% of Mongolia’s coal, copper, iron ore, crude oil and zinc exports. In 2011, coal exports to China exceeded 21Mt generating US$2.2bn in export revenue. Mongolian exports such as coal and iron ore, are usually sold at a discount at Chinese border. Mongolian producers lack scale and off take agreements to sell to end users directly and middlemen catch high margins from commodity trade. Mongolian exporters realized average price of US$110/t for their high quality hard coal in 2011. With the ramp up of production, Mongolian producers will be able to realize higher prices. Exports by Resources (US$mn) Exports by Markets (% of total, 2011) 5000 4000 3000 2000 Others US$0.38bn 7.9% 1000 0 2004 2006 2009 2010 Coal Copper Gold Zinc Fluorspar Molybdenium 2011 Iron ore Crude oil China US$4.4bn 92.1% Others Source: NSOM Source: NSOM Mongolian imports grew over 200% to US$6.5bn in 2011 from US$3.2bn in the previous year. Imports are driven by large scale construction in mining sector and growing consumption of population. Petroleum products, mining equipment and machinery, and food products are the major imports to Mongolia. We expect Mongolian foreign trade to register another record year in 2012. Mongolian trade is primarily driven by demand for commodities in China and mining related development inside the country. We do not expect slowdown in demand for Mongolian www.eurasiac.com 8
  • 10.
    Mongolia Outlook 2012 World’sFastest Growing Economy 31 January 2012 commodities. Mongolian exports are set to benefit from regional development focus in China. Mongolia borders some of the fastest growing regions of China. Infrastructure bottlenecks inside China and cheaper prices make Mongolian exports highly competitive. Mongolian exports may realize higher prices in 2012 due to diminishing role of middlemen and traders. China is to remain the largest trading partner of Mongolia. Mongolian exports are set to increase in volume with growth in coal and iron ore output, as well as in value due to higher realized prices. Robust FDI Inflows and M&A Activity In line with our expectations, Mongolia experienced another year of record foreign direct investments in 2011. Accelerated development of the Oyu Tolgoi project and investor appetite for quality resource assets have attracted US$3.8bn in FDI to Mongolia. We estimate that over 80% of FDI went to mining sector. Ivanhoe Mines’ construction budget for Oyu Tolgoi project alone was in excess of US$2.4bn. Foreign Direct Investments (US$mn) 4,000 3,000 2,000 1,000 0 2006 2007 2008 2009 2010 2011 Source: Bank of Mongolia Mongolia also saw robust M&A activity with most of the deals being struck in the mining sector. We estimate that M&A deals value doubled reaching over US$2bn. Most notable deals were Mongolian Mining Corporation (HKSE: 975) acquisition of QGX Holdings for US$464.5mn, to increase to US$950mn on reserve and output results, and Banpu Minerals purchase of Hunnu Coal (ASX: HUN) for US$537mn. We expect continued strong FDI inflows to Mongolia in 2012. Mining related projects drive investments again. We expect Ivanhoe Mines to invest in the region of US$2bn into construction of the Oyu Tolgoi project. Expansion of production at the East Tsankhi Tavan Tolgoi coalfield and tendering out of West Tsankhi will attract investments into Mongolian mining. Public private partnerships in infrastructure, including construction of power plants, railroads and roads under BOT model may attract further foreign investments into Mongolia. Expansive Fiscal Policy Mongolia experienced record fiscal expansion in 2011. General government expenditure increased 55.6% while revenue went up 40.9% y o y. General government budget performed extremely well for most of 2011 registering around 3% surplus at the end of 3Q2011. State budget flipped into US$310mn or 3.6% of GDP deficit at the end of the year with increased government expenditure, particularly capital spending and government consumption. Equilibrated general government budget (that is excl. approx. US$190mn in Stabilization Fund) deficit stood at 5.8% of GDP. The deficit is much smaller than initially www.eurasiac.com 9
  • 11.
    Mongolia Outlook 2012 World’sFastest Growing Economy 31 January 2012 planned 9.9% of GDP, primarily due to high price of commodities. Total general government budget revenue, including revenue allocated to Stabilization Fund was MNT4.4tn (US$3.5bn). Mining sector accounts for about one third of government revenue. Price assumptions for core mineral revenue generating commodities in state budget 2011 were copper US$5,983/t, coal US$98.8/t and gold US$1,350/oz. Total government expenditure and net lending reached MNT4.8tn (US$3.8bn) in 2011. Capital spending increased by 80.6% to US$843.3mn. 23.6% increase in public sector salaries and wages and 59.3% increase in subsidies and transfers, including almost 150% increase in social cash transfers supported private sector consumption. Subsidies and transfers accounted for 34.8% of total government expenditure and net lending, reaching 15.4% of GDP. Government Budget Performance (MNTbn) 6000 5000 4000 3000 2000 1000 0 2006 2007 2008 Revenue 2009 2010 2011 2012F Expenditure Source: NSOM, Eurasia Capital estimates The Government plans further increase in expenditure in 2012. Approved state budget envisages record MNT6.31tn (US$4.7bn) spending and MNT6.15tn (US$4.6bn) revenue. The Government seeks to increase expenditure by 31.7% y o y, whilst revenue side of the state budget is expected to increase by 39.7% y o y. GDP assumed to reach MNT16.13tn (US$11.9bn). Budget deficit will be 1.0% of GDP. Equilibrated general government budget (excl. Stabilization Fund) deficit will reach 3.0% of GDP. The Government expects to accumulate MNT322.45bn (US$240mn) or 2% of GDP in the Stabilization Fund. Underlying assumptions for mineral commodities in budget 2012 were copper US$6,663.5/t, gold US$1,723.75/oz, processed coal US$166.58/t, coking coal US$102.60, bituminous coal US$72.4/t and thermal coal US$57.2/t. We hold a cautious view on budget performance in 2012. Increased spending comes at a time of elevated risks to global growth. Cumulative spending on wages & salaries and subsidies & transfers is expected to grow 34% y o y to reach 20.5% of GDP. That includes social transfers exceeding 13% of GDP. Furthermore, capital expenditure is planned to almost double to MNT2.0tn (US$1.5bn) reaching 12.4% of GDP. The Government expects MNT522bn (US$400mn) from major mining project advance payments to finance budget deficit. In our view revenue side and GDP assumptions could be slightly optimistic considering risks to global economy and concerns about growth in China. Revenue side may not expand at a rate expected by the government. Advance payments from major mining projects may not materialize yet, putting government fiscal standing under pressure. Actual budget deficit may be higher than planned. On the other hand, strong commodity prices, diffusion of www.eurasiac.com 10
  • 12.
    Mongolia Outlook 2012 World’sFastest Growing Economy 31 January 2012 global economy concerns and continued strong growth in China may dramatically improve budget performance. Inflation Contained by Tight Monetary Policy Rapid growth and expansive fiscal policy kept inflationary pressure on Mongolian economy throughout 2011. Government expenditure on wages and salaries increased 23.6% y o y. Subsidies and transfers to population grew 59.3% to about US$1.3bn accounting for 38.8% of total government expenditure. Consumer Price Index (%, YoY) 15 12 9 6 3 Dec 11 Oct 11 Aug 11 Jun 11 Apr 11 Feb 11 Dec 10 Oct 10 Aug 10 Jun 10 Apr 10 Feb 10 Dec 09 0 To contain inflation the Bank of Mongolia tightened monetary policy in 2011. Inflation Source: NSOM threatened to get out of control in 1H2011 with core inflation hitting 11.4% y o y, whilst headline CPI number of 6.2% y o y remained low. Government coordinated sales of meat helped to bring down food prices. Meat and meat products remain a staple food in Mongolia and account for 16.5% of total CPI. In the same period, loans outstanding grew 57.9% y o y. Loans grew incredible 7.2% m o m in June 2011. Money supply (M2) jumped 63.8% y o y. Double digit inflation, incredible loan growth rates and strong economic growth indicated at overheating economy in 1H2011. The Bank raised its policy rate by 75 basis points to 11.75% in August and by 50 additional basis points to 12.25% in October. Furthermore, the Bank of Mongolia raised the banking sector reserve requirement twice in the year, by a total of 900 basis points to 11%. Tight monetary policy kept core inflation at 10% y o y and headline national inflation at 10.2% y o y in 2011. Money supply (M2) growth rate declined to 37.3% by the end of 2011. However, lending continued rising and registered 72.8% y o y growth in 2011. The Bank of Mongolia policy moderated inflationary pressure; however risks of high inflation becoming entrenched in the economy still remain. Strong growth and record government spending in 2012, including social transfers exceeding MNT2.1tn (US$1.6bn) will put considerable inflationary pressure on the economy. The central bank announced its intention to keep inflation below 10%. However, increased consumption will drive up prices, especially, food and fuel prices, in our view. We expect aggressive monetary tightening late 2Q2012. To contain inflation, the central bank may need to increase its policy rate as well as banking sector reserve requirement. We believe monetary policy may not be enough to keep inflation below 10% and it may hit 15% y o y during the year 2012. www.eurasiac.com 11
  • 13.
    Mongolia Outlook 2012 World’sFastest Growing Economy 31 January 2012 Key Economic Indicators for Mongolia Indicator Population and income Population, mn GDP per capita, US$ 2004 2005 2006 2007 2008 2009 2010 2011e 2012f 2.53 720 2.56 905 2.59 1327 2.63 1620 2.68 2108 2.74 1688 2.76 2267 2.81 3045 2.86 4056 National accounts Nominal GDP, MNTbn Nominal GDP, US$bn Real GDP growth, y o y, % 2,152 1.8 10.6 2,780 2.3 7.2 3,715 3.2 8.6 4,599.5 3.9 10.2 6,555 5.1 8.9 6,591 4.6 1.3 8,415 6.6 6.4 10,830 8.6 17.3 16,134 12.0 20.0 Monetary indicators and inflation M2 growth, y o y, % CPI, y o y, % Exchange rate, MNT/US$, end year International reserves, US$mn 20.4 11.0 1,209 208 34.6 9.2 1,221 333 34.8 4.8 1,165 718 56.3 14.1 1,170 1,001 5.5 22.1 1,267 657 26.9 4.2 1,443 822 62.5 13.0 1,257 2,000 37.3 10.2 1,396 2,500 50.0 15.0 1,300 2,500 33.1 35.0 2.1 30.1 27.5 3.2 36.6 28.5 3.9 40.9 38.0 2.2 35.4 40.2 5.0 32.9 38.3 5.4 37.1 36.6 0.5 40.6 44.3 3.7 38.1 39.1 1.0 4,780 6,527 64.4 104.1 1,747 3,818 5,740 7,500 20.0 15.0 1,760 3,000 Government finance Revenue, % of GDP Expenditure, % of GDP Budget balance, % of GDP Balance of payments Exports, US$mn 872 1,069 1,545 1,952 2,539 1,885 2,909 Imports, US$mn 1,021 1,224 1,516 2,170 3,616 2,909 3,200 Exports, y o y, % 41.2 22.4 44.9 22.5 30.3 24.9 54.3 Imports, y o y, % 27.5 16.0 25.4 36.1 66.6 34.3 49.7 Trade balance, US$mn 149 155 30 218 1,077 252.3 291.6 FDI, US$mn 92.9 182.3 367 500 709 801 1,400 Source: National Statistics Office of Mongolia, the Bank of Mongolia, IMF, Parliament resolutions, Eurasia Capital estimates e = estimate, f = forecast www.eurasiac.com 12
  • 14.
    Mongolia Outlook 2012 World’sFastest Growing Economy 31 January 2012 POLITICS We view 2011 as a successful year for Mongolian foreign policy. The country is playing an active and growing role in North Asia. The number of high level visits to and from Mongolia reflects increasing significance of the country in the region. The country signed a number of important bilateral agreements on cooperation and investments. As a landlocked country sandwiched between Russia and China, Mongolia puts emphasis on developing balanced relations with its two large neighbours and countries beyond or “third neighbours”. Among many dignitaries, Mongolia hosted US Vice President J. Biden, German Chancellor A. Merkel and South Korean President Lee Myung Bak. Mongolian President and Prime Minister paid visits to China, Russia, USA, Australia, Italy and the Middle East countries. Mongolia signed a Strategic Partnership Agreement with China in June 2011. We expect the agreement to expand cooperation and bolster economic ties, and add further impetus to Chinese investments into the Mongolian economy. Mongolia also enjoys strategic partnership status with Russia. During the visit of Korean President to Mongolia, the countries agreed to elevate bilateral relations to a “Comprehensive Partnership” status. The parties agreed to expand cooperation in resource and infrastructure development. Mongolian astute and pragmatic foreign policy places the country at the heart of political and economic developments in North Asia, while the country enjoys very good “neighbourly” relations with many countries in the region and beyond. Mongolian lively domestic policy demonstrated stability and continuity. The ruling coalition government focused on development and poverty reduction. Consecutive years of record FDIs indicate at the government’s aptitude to attract investments. The government provided strong and unequivocal support to the Oyu Tolgoi Investment Agreement, albeit calls from some Members of Parliament for re negotiation. Mongolian political process is consensus driven and major decisions are hotly deliberated and contested. The decision process is time consuming, but the decisions enjoy wide support afterwards. The abortive Tavan Tolgoi tender reflects the nature of multi dimensional political process and difficulties of driving major decision in pre election year by a coalition government. Parliamentary Elections The country will hold parliamentary elections in June 2012. Gearing towards elections the Democratic Party, a junior partner in the government, has left the ruling coalition with the Mongolian People’s Party (MPP). We expect lively political discourse on equitable economic development, poverty reduction and welfare, society and environment in the run up to the elections. A number of parties will participate in the elections, but we expect the Mongolian People’s Party and the Democratic Party to dominate the elections and political agenda. The elections will be held under the new Elections Law adopted in December 2011. The law introduced proportional system into the election process. Previously, all 76 MPs were elected by direct vote from single mandate districts. Under the new law, 48 MPs will be elected by direct vote and 28 MPs will be elected on party list voting. The number of MPs www.eurasiac.com 13
  • 15.
    Mongolia Outlook 2012 World’sFastest Growing Economy 31 January 2012 remains unchanged at 76. The Mongolian nationals living abroad will be able to vote only on party lists. Everyone will be wary of a repeat of the post 2008 elections crisis. The elections in 2008 saw a brief period of turmoil and civil unrest before the forming of a coalition government between MPP and DP. The coalition government succeeded in stabilizing the country and focused on attracting investments, diversifying economy and fighting corruption. Overall, we do not expect repeat of 2008. The country is developing at furious pace and there is an intuitive consensus among major political parties on economic development. Regardless of the election outcome, we do not expect reversal of recent achievements and major changes to the economic governance. www.eurasiac.com 14
  • 16.
    Mongolia Outlook 2012 World’sFastest Growing Economy 31 January 2012 GLOBAL ECONOMY With an economy dependent on exports and foreign capital, Mongolia is not immune from the trends in the global economy, in our view. Significant decline in international prices for commodities may pose a risk to the Mongolian export revenues. The moderately growing U.S. economy, sovereign debt crisis in Europe and slowdown in developing countries may affect the demand for commodities, therefore putting downside pressure on prices. The World Bank estimates the world economy to grow at a moderate rate of 3% in 2012 according to its Global Economic Prospects report released in January 2012. In particular, growth in high income economies is projected to slow to 1.4% GDP growth rate this year and the developing economies to 5.4%. The economy of China, the largest export market for Mongolia, may slow to 8.4% amid expected weakening demand in the US and European markets. Global Economic Growth (2010 2012f) 18 16 15.1 14 12 10 8.4 8 5.4 6 4 3 1.4 2 0 0.3 2 World High income Euro area Developing economies 2010 2011e China Mongolia 2012f Source: The World Bank (GEP, January 2012), NSOM, National Statistics Bureau of China Despite all these, we believe that the current demand level in China should still be considered strong for the Mongolian commodities exports. In our view, Mongolia may strengthen its market position further in China this year by winning more market share from its competitors such as Australia and Indonesia through supplying commodities at relatively cheaper price and due to infrastructure bottlenecks in the respective provinces of China. Even if a moderate decline in the commodities prices is expected to persist, Mongolia should benefit from the increase in physical volume of its exports, primarily coal and iron ore. www.eurasiac.com 15
  • 17.
    Mongolia Outlook 2012 World’sFastest Growing Economy 31 January 2012 COMMODITIES: BULLISH AMID MODEST GLOBAL GROWTH Prospects of commodities whether it will be attractive or daunting largely depend on the performance of the global economy in particular on the ability of the U.S. and China to successfully support their economies and on the ability of European leaders to come up with a constructive solution to the Eurozone crisis. However, the uncertainty is that the outlook for the global economy in 2012 is not strong which if realized might put downward pressure on commodity prices. According to the IMF, the World Bank and to the median of 70 economist estimates compiled by Bloomberg, the worldwide economy is likely to slowdown in 2012. Although this is the case, the pessimistic global outlook is not fully reflected in the forecasted positive commodity prices according to the analysts’ estimates compiled by Bloomberg. The bullish forecast by the analysts about commodity prices shows the anticipation that the world in particular the U.S., China and Europe will be able to positively resolve the economic challenges ahead of them supporting demand for commodities. It is worth noting that although the analysts in Bloomberg Survey were able to predict correctly a downturn in commodity prices for 2011 they were off the target for 2010 predictions. Putting Mongolia into perspective, we think Mongolia as a heavily mineral dependent economy will remain vulnerable to commodity price fluctuations since mineral exports of Mongolia constitute the lion’s share, approximately 88%, of total exports. Moreover, Mongolia’s prospect partially depends on the reasonable budget assumptions about the price of the key commodities (coal and copper) and China’s ability to engineer soft landing for the economy. Commodity Price Forecasts 2010 2011 Actual Difference +21.7% 98.83 +13.5% Forecasted (median) 100 +48.8% 8,859 7,600 14.2% 8,625 147 +37.4% 135.63 168 +23.8 150 18,375 2,062 24,750 2,454 +34.7% +19% 23,937 2,375 18,710 1,875 21.8% 21.1% 20,812 2,140 Lead, US$/t 1,874 2,550 +36.1% 2,450 2,035 16.9% 2,250 Gold, US$/t 1,099 1,420 +29.2% 1,426 1,563 9.6% 1,572 Copper, US$/t Iron Ore Fines 62% FE spot, US$/t Nickel, US$/t Zinc, US$/t Actual Difference 94.31 6,450 9,600 107 2012 Forecasted (median) 87 Crude oil (WTI), US$ Forecasted (median) 77.5 Hard quality Coking Coal, *191 *289 US$/t Thermal Coal Australian 106.03 129.58 Newcastle, US$/t, average annual Source: Bloomberg Survey, Steel Index, globalCoal, *BREE, ABARES Australia Japan average contract price *226 www.eurasiac.com 16 120
  • 18.
    Mongolia Outlook 2012 World’sFastest Growing Economy 31 January 2012 MINING Importance of mining industry for the Mongolian economy has been increasing over the last years. Contribution of mining and quarrying industry to GDP increased 8.7% in 2011 compared to 3.6% in 2010. Even though production of copper, molybdenum, fluor spar, zinc concentrates and gold declined compared to the last year, the production of commodities which are the key contributors to GDP increased significantly. Coal, crude oil and iron ore output rose substantially by 22.6%, 16.8% and 77.3%, respectively, in 2011, according to the preliminary data provided by the Mongolia National Statistical Office data. It should be noted that our projection regarding coal output is in line with actual statistics. As we have forecasted coal production hit all time high of 30Mt in 2011 on the back of strong demand from China. In 2012 we forecast that Mongolia would produce 38Mt of coal. For the long term we stick to our view that Mongolian annual coal production will surge to 100Mt by 2020 in a pattern similar to what Indonesia experienced during 1997 2004. Exports of Key Commodities 2009 Volume Gold, tonne Copper concentrate, 000 tonnes Molybdenium ores and concentrate, 000 tonnes 10.9 587 6.7 Fluor spar ores and concentrate, 314 000 tonnes Iron ore, 000 tonnes 1,598.1 Iron ore scrap, tonnes 656 Zinc concentrate, 000 tonnes 150.7 Coal, 000 tonnes 7,113.2 Crude oil, 000 barrel 1,938.5 Source: National Statistics Office of Mongolia 2010 Value, US$’000 308,473.2 501,923.7 50,308.8 Volume 2011 2010 vs 2011 Volume, Value, % % 47 36 0.72 25 12.5 9.8 Volume 5.1 568.7 4.8 Value, US$’000 178,339.0 770,594.2 51,989.1 2.7 572.8 4.2 Value, US$’000 113,046.6 963,596.0 46,393.6 48,223.9 405.6 68,824.5 404 94,876.7 0.39 37.9 88,769.5 139.9 122,494.3 306,300.6 115,632.5 3,563.7 1,010.2 119.8 16,726.2 2,070.8 253,825.1 313.9 134,135.3 881,998.3 154,386.1 5,753.1 1,261.9 120.7 21,105.6 2,540.5 437,328.3 512.0 142,678.4 2,250,046.4 252,191.8 61.4 24.9 0.8 26.2 22.7 72.3 63.1 6.4 155.1 63.4 Mongolia Dwarfs Australia in Coking Coal Exports to China As we have identified in our Mongolia Outlook 2011, coal exports surpassed copper exports in monetary value by US$111.4mn in 2010 for the first time in Mongolian export history. In 2011 value of coal exports exceeded that of copper 11.5 times or by US$1.28bn. Moreover, in 2011 another important milestone was achieved as Mongolia overtook Australia as the largest exporter of coking coal to China. In just three years Mongolia emerged from being a minor to a major coking coal exporter to China. We estimate that in 2011 Mongolia met approximately 38% of China’s coking coal imports demand. The main reasons for China increasing its coking coal imports from Mongolia are big price difference (more than 2 times) between seaborne market supplied coking coal and Mongolian coking coal, transportation bottleneck in China to bring coal from coastal areas to developing regions in the north and extreme flooding in Australia that decreased coking coal supply from Australia. Looking forward we anticipate that Mongolia will likely strengthen its position in China’s coal imports. www.eurasiac.com 17
  • 19.
    Mongolia Outlook 2012 World’sFastest Growing Economy 31 January 2012 China’s Coking Coal Imports by Source 2009 Others 13% 2010 2011E Mongolia 12% Canada 9% Mongolia 32% Others 24% Mongolia 38% Others 31% Canada 7% Australia 66% Australia 37% 34.5Mt 47.3Mt Canada 6% Australia 23% 55.19Mt* Source: China Customs data, Statistics Offices of Australia, Canada and Mongolia, *Eurasia Capital estimates Mining IPOs Not As Dynamic As in 2010 In 2011 mining IPOs were not as dynamic as in 2010. There was only one full fledged IPO on ASX made by FeOre Ltd (FEO:AU), a Mongolia focused iron ore explorer, that has started trading on December 15, 2011 after raising A$35mn. Another Mongolia focused exploration company, Kara Minerals, was planning to raise A$20mn through IPO on ASX and start trading in early December 2011. However, the company has withdrawn its application from ASX without being able to generate enough interests in the offering, in our view. Kara Minerals Ltd. was incorporated in Australia to acquire and develop Nasryn Hundlun Tin Project in north east of Mongolia. Guildford Coal was also considering listing its unit, Terra Energy, on ASX. A float is still under consideration in 2Q2012. In 2011 several companies came to the market through a reverse takeover of Mongolian assets (exploration licences). These companies, Draig Resources Ltd. (former C@ Ltd), Modun Resources Ltd. (former TVN Corp. Ltd), UTMI (former Wedge Energy International Inc.), Mongolian Resources Corp. Ltd (former Alamar Resources Ltd) and Kincora Copper Ltd. (former Brazilian Diamonds Ltd.), are currently trading on stock exchanges in Australia and Canada. Much anticipated IPO of Erdenes Tavan Tolgoi, the state owned enterprise that holds the mining licence for the world’s largest untapped coking coal mine, didn’t take place in 2011 as it was expected. Early in July, the Government announced that it has selected China’s Shenhua Energy Company, U.S. Peabody Energy Corp. and Russian Mongolian consortium to develop the Western Tsankhi area of the Tavan Tolgoi deposit. However, due to the public pressure and dissatisfaction among the bidders over the selection process as well as refusal by the National Security Council, the Government had to backtrack on the deal. Complex and opaque process caused considerable concerns among investors over the Government’s ability to successfully finalize the deal. Later the Government resumed negotiations with all bidders and announced that Erdenes Tavan Tolgoi may raise more than US$3bn in IPO on the Mongolian and London Stock Exchanges by July 2012. In our view, the government www.eurasiac.com 18
  • 20.
    Mongolia Outlook 2012 World’sFastest Growing Economy 31 January 2012 anticipates that it will be able to do the IPO of Erdenes Tavan Tolgoi in 2012 since it has already included the prepayments from the deal in the 2012 budget. We are slightly cautious about the government’s ability to successfully launch the IPO this year taking into account upcoming parliamentary elections and uncertainties in global markets. Political Maneuvering Triggered by Elections In September 2011 twenty MPs and several lawmakers demanded the coalition government to reconsider existing agreement on the Oyu Tolgoi mine by requesting to increase Mongolia’s stake in the project to 50% from 34%. However, Rio Tinto and Ivanhoe Mines refused to accept proposed amendment to the agreement. This situation gave a warning signal to international investors indicating that Mongolia could be an unstable country to invest. As a result the share prices of international mining companies with operations in Mongolia tumbled significantly on the back of this news. Fortunately, for the benefit of investor community and Mongolia as whole, the coalition government issued a joint statement with the two mining companies in which it reaffirmed its commitment to the existing investment agreement. We view that request for renegotiation of investment agreement was politically driven amid the forthcoming parliamentary elections in June 2012. Looking forward we see the risk that ahead of upcoming elections similar unusual requests might make the country go through turbulent times. Nevertheless, even though Mongolia, similar to other countries, is sensitive to such kind of events, we think that the government is acting in the public interest and taking pragmatic approach to manage the challenges. New Exploration Licences Still Not Granted Temporary suspension of granting new exploration licenses set in 2010 was not lifted in 2011. Instead government agencies were cleaning holders of exploration and mining licences from companies that were violating the laws. The State Specialized Inspecting Agency (SSIA) has shut 73 mining companies down that were operating illegally near the river and forest basins. Majority of closed companies were small illegal gold mining companies. The ban on granting new exploration licences is expected to be effective until the government passes a new law on mineral resources. Moreover, the government intends to reduce total area of Mongolia covered by exploration licences from today’s 17% to 10%. As of November 25, 2011 there were 3,763 active exploration and mining licences in Mongolia. www.eurasiac.com 19
  • 21.
    Mongolia Outlook 2012 World’sFastest Growing Economy 31 January 2012 BANKING Representing the Booming Economy Mongolian banking sector expanded a record pace of 50.1%, compared with 41.2% in 2010, along with the rapid expansion in the economy. Large FDIs particularly in the mining sector and the consequent increase in commodity export income had significant positive impact on the whole economy. Goods and services industries benefited from increased demand from households, growth in state and corporate investments, and strong corporate and individual income boosted tax revenue to the budget. The banking sector assets surged to MNT9,372bn (US$6.7bn) and bank assets to GDP ratio reached to the new height of 86.5%, clearly representing the booming economy. Bank Assets and Growth Assets/GDP Ratio, % 10,000 60% 100% 8,000 50% 80% 40% 6,000 30% 4,000 20% 2,000 10% 0% 0 2007 2008 2009 Assets, MNTbn 2010 2011 Growth, % Source: The Bank of Mongolia, Eurasia Capital 87% 74% 67% 74% 56% 60% 40% 20% 0% 2007 2008 2009 2010 2011 Source: The Bank of Mongolia, Eurasia Capital Current accounts (CAs) and deposits grew 30.2% and 40.0% in 2011 compared with 109.5% and 49.5%, respectively, in 2010. Combined growth of 36.5% to MNT5,739bn in CAs and deposits created half of the sector growth. Other capital sources grew more than CAs and deposits in 2011. Loan from the banking sector increased 61% (77% of this growth came from the central bank) to MNT672bn supporting sector wide growth by 4.1%. Foreign liabilities grew 54.4% to MNT688bn and government deposits surged 120.6% to MNT932mn, each supporting sector growth by 3.9% and 8.2%, respectively. Together with shareholders’ equity growth of 77% to MNT677bn and other liabilities growth of 78.3% to MNT662bn, all the “non CAs and deposits” capital sources contributed to the other half of growth in 2011. It should be noted that there was an extraordinary increase in each of loans from the Bank of Mongolia, foreign liabilities, and government deposits in December because of the competition among the banks to show higher year end asset numbers in their balance sheets. XacBank announced its plan to sell US$300mn bonds on Euro Medium Term Note programme in international markets. The bank plans to raise up to US$150mn within the programme in 2012. This has been in line with our general expectation that the banks will www.eurasiac.com 20
  • 22.
    Mongolia Outlook 2012 World’sFastest Growing Economy 31 January 2012 seek access to foreign capital markets primarily through bond deals and private equity to increase capacity to provide long term loans. The banks were also able to add MNT86.5bn into their equity last year. The large state budget had its place in the banking sector balance sheet having 120% higher figure compared with the previous year. In monetary terms, the government deposit increased by MNT509bn to MNT932bn representing almost 10% of the sector asset sources. CAs and Deposits, Growth and Share in Assets 8,000 Banks Financing Sources 2011 80% Current Accounts 60% 6,000 7% 7% 40% 21% 4,000 20% 0 8% 20% 2007 2008 2009 2010 2011 CAs and Deposits CAs and Deposits % in Assets CAs and Deposits Growth, % Source: The Bank of Mongolia, Eurasia Capital Liabilities to the Banking Sector Foreign Liabilities 10% 0% 2,000 Deposits 7% Government Deposits 40% Equity Others Source: The Bank of Mongolia, Eurasia Capital The domestic loan demand was very strong during 2011 and is expected to continue growing the following years. Total outstanding loans jumped 73.4% y o y to MNT5,598bn which was 59.7% of total assets at the end of 2011. As the sector wide loan quality, measured by past due in arrears and non performing loans (NPLs) ratios, significantly improved in 2010, the banks started loosening credit policy from the beginning of 2011. During 1H2011, the total outstanding loans increased 40% (5.8% per month) or by MNT1,289bn. The global financial market uncertainty during 2H2011 had a negative effect on the MNT performance, export income and FDI inflow, thus eventually raising risk aversion of the banks. New loans granting speed observably slowed from July. During 2H 2011 new loans increased only 24% (3.6% per month) or by MNT1,080bn. The Bank of Mongolia raised reserve requirement ratio from 5% to 9% in February and further to 11% in August last year against surging inflation. However, as the banks had plenty of reserves, this tool didn’t effectively work to slow loan growth. The central bank’s only effective tool was policy rate, in our view, and therefore, the already high rate was further raised three times by 50bps to 11.5% in April, by 25bps to 11.75% in August, and by 50bps to 12.25% in October. www.eurasiac.com 21
  • 23.
    Mongolia Outlook 2012 World’sFastest Growing Economy 31 January 2012 Loans, Growth and Share in Assets Reserve and Liquidity Ratios 80% 6,000 5,000 60% 4,000 60% 50% 40% 3,000 40% 2,000 20% 1,000 30% 20% 10% 0 0% 2007 2008 2009 2010 2011 Outstanding Loans, MNTbn Loans/Assets, % Outstanding Loans Growth, % Source: Bank of Mongolia, Eurasia Capital 0% 2007 2008 2009 2010 2011 Reserve, Cbills/CAs and Deposits, % Liquidity Ratio, %* Source: Bank of Mongolia, *Eurasia Capital Estimates In line with our expectation, past due in arrears and NPLs ratios improved throughout the year, the former dropping to historical low of 1.3% and the latter substantially down to 5.8% at the end of 2011. In absolute terms, these sub loans declined 17.3% and 11.8%, respectively. NPLs and Past Due in Arrears Ratios 17.4% 20% 15% 10% 5.8% 5.8% 3.3% 5% 2.4% 4.6% 2.0% 1.3% 0% 2005 2006 2007 NPL/Loans, % 2008 2009 2010 2011 Past Due in Arrears/Loans, % Source: Bank of Mongolia, Eurasia Capital Market Bet for MNT The currency structure of CAs and deposits give us some notion regarding the market bet on the currency rate. Domestic currency CAs and deposits soared 48.3%, y o y. Its share in total CAs and deposits increased to 70% while foreign currency CAs and deposits increased only 15.3% y o y and its share down to 30%. www.eurasiac.com 22
  • 24.
    Mongolia Outlook 2012 World’sFastest Growing Economy 31 January 2012 Respective weighted average annual rates 10.5% and 2.8% on MNT denominated CAs and deposits against 4.5% and 1.1% on US$ denominated CAs and deposits, at the end of 2011, show the attractiveness of holding assets in MNT. Throughout 2011, individuals and corporate entities preferred holding their money in MNT as they were betting on MNT appreciation, though the local currency had steadily lost against US$ during 2H2011. The MNT depreciation during 2H 2011 didn’t clearly show dragging impact on the MNT denominated CAs and deposits’ growth. Currency Structure of CAs and Deposits 100% 80% 60% 67% 62% 61% 64% 70% 33% 38% 39% 36% 30% 40% 20% 0% 2007 2008 Foreign Currency 2009 2010 Domestic Currency 2011 Source: The Bank of Mongolia, Eurasia Capital The Blanket Guarantee Law on CAs and deposits approved in 2008 expired in January 2012. The Bank of Mongolia, the Financial Regulatory Commission and the Ministry of Finance had developed a commercial deposit insurance law during the last two years. As we projected a year ago, the law was not approved in 2011 and the parliament is currently discussing the law. We expect the law will be approved this year and it will serve for the sector development in the long term. Record Earnings 2011 was a golden year for the banking sector. It counted 2.8 times larger net earnings compared with the previous year. The sector wide net earnings summed to MNT184.3bn, the central bank numbers show. The profitability of the sector gauged by ROA and ROE ratios peaked to the top rates of our reference period of since 2003. These ratios peaked to 2% and 27.2%, respectively, last year. During the past financial crisis the sector netted MNT210bn cumulative loss in 2008 2009, which was mostly cost of the bankruptcies of two banks Zoos and Anod. www.eurasiac.com 23
  • 25.
    Mongolia Outlook 2012 World’sFastest Growing Economy 31 January 2012 Record ROA and ROE Largest 10 Banks By Outstanding Loans (2011, MNTbn) 40% 20% 27% 17% 15% 0% 20% 2007 2008 2009 2010 2011 20% 40% ROA, % 60% 80% 1,600 1,400 1,200 1,000 800 600 400 200 62% Source: The Bank of Mongolia, Eurasia Capital ROE, % Source: The Bank of Mongolia, Eurasia Capital 2012 Outlook: Will Hopefully Manage Well We expect the banking sector to expand about 30% this year. We believe this growth estimate is reasonable based on our economic growth target, inflation and MNT forecasts, and FDI expectation. On one hand, highly expansionary state budget and anticipated fund raising by the banks from the international capital markets may cause the sector to see higher than our estimated growth. On the other hand, heightened inflation fueled by the budget would possibly drag the growth of the sector through lower capital inflow. We expect that the market will remain betting on MNT in 2012 as we retain our long term bullish outlook on the local currency and target 1,300 MNT/US$ rate. In our view MNT denominated CAs and deposits’ share in total will stay stable at 70% and the balance will be on foreign currencies. Annual rates on CAs and deposits are likely to remain stable, we believe, as the banks have plenty of reserves in cash in Central Bank accounts (12.2% of total assets at the end 2011), Central Bank bills (9.4% of assets), assets deposited abroad (7.6% of assets), and government bonds and stocks (5% of assets). Therefore, the banks will not fiercely compete for capital by raising deposit rates, in our view. On the contrary, tightening monetary policy and heightened inflation expectation would possibly push the banks to raise rates. The Bank of Mongolia raised the liquidity ratio requirement for banks to 25% effective from January 2012. Due to the short term nature of banking sector liabilities (CAs and less than one year term deposits), the banks must seek access to long term capital available in the international capital market. XacBank intends to issue US$150mn of its planned US$300mn Euro Medium Term Notes in Singaporean Stock Exchange this year. We may see that the largest two banks also contemplate to tap into the bond market. Golomt Bank received the debut ratings from Standard & Poor's and Moody’s in November 2011 that may indicate preparation for bond issuance. In 2011, the Bank of Mongolia resolved that the equity capital adequacy ratio will be raised from current 12% to 12.5% on June 30, 2012, to 13% on December 31, 2012, and further to 14% on June 30, 2013. In addition, the banks have to increase their equity capital at least to www.eurasiac.com 24
  • 26.
    Mongolia Outlook 2012 World’sFastest Growing Economy 31 January 2012 MNT16bn by May 1, 2013. Meeting the absolute equity requirement does not pose a problem for most of the banks. However, increased capital adequacy requirement and sharp sector expansion will inevitably force the banks to go public in the coming years. We view that the banks will try to raise capital in private equity deals this year, and starting from the next year they will seek opportunities for possible IPOs. We recall that earlier in 2010, the CEO of Golomt Bank stated that the bank may go public on an international stock exchange in 2012. We estimate 40% more new loans to be granted in 2012 taking into account of continued strong demand, significant reserves of banks, capital growth as supporting factors. Meanwhile inflation threat and the expected more tightening monetary policy from the Bank of Mongolia will still be present. The Bank of Mongolia has been increasing reserve, liquidity and capital adequacy requirements and policy rate decline is unlikely this year. It appears that interest rates are not likely to decline in 2012. Loan quality will further improve, in our view. Loans in arrears rate already at the record low level, and we anticipate this to remain stable. Non performing loans ratio was markedly down from 11.5% to 5.8% as of the respective 2010 and 2011 year ends, and we expect to see further improvement on the ratio, smoothly declining below 5%. 2011 was a golden year for the Mongolian banking sector as it counted record profits. The local banks will do well again this year, based on our belief that the banks will not raise rates offered for capital, loans interest rates will not decline and loan repayment will further improve. www.eurasiac.com 25
  • 27.
    Mongolia Outlook 2012 World’sFastest Growing Economy 31 January 2012 ASSET CLASSES Local Equities: Second Best Performing Market Globally MSE Hit the Target In line with our projections that the Mongolian equity market will be among the world’s top three best performing markets, the MSE closed 2011 as the second best performing market globally. The market benchmark, the MSE Top 20 Index, surged 46.9% (32.3% in US$ term) to 21,687.57. This is higher than our initial target of 20,000, +40% growth estimated in our 2011 outlook. The MSE Top 20 Index outperformed developed and emerging markets, while the S&P 500 Index remained flat, and MSCI EM Asia and MSCI Frontier indices lost 19.1% and 22.1%, respectively. MSE Top 20 Index Performance 2011 MSE Top 20 vs Global and Regional Benchmarks 34,000 20,000 30,000 250% 15,000 22,000 10,000 18,000 200% MNTmn 26,000 MSE Top 20 MSCI EM Asia S&P 500 MSCI Frontier 150% 5,000 14,000 100% Dec 11 Source: MSE, Eurasia Capital Dec 11 Nov 11 Oct 11 Sep 11 Jul 11 Aug 11 Jun 11 May 11 Apr 11 Mar 11 Jan 11 Top 20 index Feb 11 Top 20 Trading Volume (MNTmn) 50% Dec 10 Oct 11 Nov 11 Sep 11 Jul 11 Aug 11 Jun 11 Apr 11 May 11 Feb 11 Mar 11 Jan 11 10,000 Source: MSE, Eurasia Capital MSE market cap reached MNT2,168.6bn (US$1,554.5mn) at the end of 2011 adding MNT794.6bn (US$570mn) in total during the year. Shortly after exceeding US$1bn threshold first time in mid November 2010, MSE market cap almost tripled in three months hitting US$2,829.5mn at the peak on February 25, 2011. However, the market declined till the end of May. The total equity trading volume at the MSE was MNT109.1bn (US$78.2mn) last year, 28.2% higher compared with 2010. MSE Market cap, US$mn MSE Stock Trading Volume, US$mn 3,000 US$mn 2,500 2,000 1,500 Source: MSE, Eurasia Capital www.eurasiac.com Dec 11 Nov 11 Oct 11 Sep 11 Aug 11 Jul 11 Jun 11 May 11 Apr 11 Mar 11 Feb 11 Jan 11 1,000 90 80 70 60 50 40 30 20 10 78 53 16 11 2006 50 47 2007 2008 2009 2010 2011 Source: MSE, Eurasia Capital 26
  • 28.
    Mongolia Outlook 2012 World’sFastest Growing Economy 31 January 2012 Bubble and Burst MSE experienced significant volatilities last year due to low liquidity, increased awareness of the market, new development initiatives and international financial market turbulences. Rush to take exposure as early as possible created a bubble in the MSE pushing the Top 20 Index up 123.3% to 32,954.97, within less than two months at the beginning of 2011. The 2010 global outperformance of the MSE (138.4%), the London Stock Exchange (LSE)’s strategic partnership agreement and the Master Service Agreement to modernize the MSE and the country’s stock market as a whole combined with positive general economic outlook loudly signaled about the opportunities of the market. Furthermore, the government announced that 10% common shares of Erdenes Tavan Tolgoi (ETT) will be distributed to every Mongolian citizen in 1Q2011 raised awareness of the market among the Mongolian people and foreign investors. Though the total market capitalization gained US$1.7bn during this period, an average daily volume was only US$230,000. During three months till the end of May following the peak, the index went through significant correction and lost 43.8% to 18,534.23 on an average daily volume of US$330,000. The international financial market slide and increased volatility started from 2Q further worsened through the remainder of the year which had a freezing impact on the cash inflows from foreign investors. During the second half of the year, the index ranged between 18,000 and 22,000 while the average daily volume further improved to US$370,000. Our 2011 Calls Played The top 5 companies of the exchange together with other two big gainers comprised over 80% (US$511mn) of the total market gain (US$570mn) in 2011. Tavan Tolgoi (TTL) and APU (APU) hit our 2011 targets. TTL, the largest cap stock of the bourse, surged 91% and APU, becoming the second largest, jumped 111.1% supporting the market expansion by US$198mn and US$118mn, respectively. However, Mongolia Development Resources (MDR), a real estate play, declined 22.3%. The third and fourth largest stocks of Main contributors to MSE 2011 Growth the bourse, Baganuur (BAN) and Shivee Ovoo (SHV) advanced at 16% relatively moderate rates of 24.8% and 4% 35% 17.7% adding US$39mn and US$22mn 4% to their market caps, respectively. The 5% other two big gainers were Berkh Uul 7% (BEU) which contributed US$50mn, 9% 20% the third biggest, to the market cap as its share price soared over 24 times from a year earlier level and UB BUK Source: MSE, Eurasia Capital (BUK) which contributed US$23mn as it grew over 6 fold. Tavan Tolgoi APU Berkh Uul Baganuur Sharyn Gol UB BUK Shivee Ovoo Others Our belief that the Mongolian stock market had been well undervalued has been proved by the spectacular growth for the past several years. The investors who understood the real opportunity in the market counted tremendous performance in their portfolios again in www.eurasiac.com 27
  • 29.
    Mongolia Outlook 2012 World’sFastest Growing Economy 31 January 2012 2011. The high performance of the blue chip large cap stocks was supported by the factors that first, these were fundamentally undervalued and second, they have strong growth outlook. We view that the valuations of some large cap stocks have reached the bottom of their reliable intrinsic value ranges considering their fundamentals, growth outlooks and, as well as the market and individual company risks. We believe that the downside risk in the market is limited as the Mongolian economy expanded 17.3% last year and is expected to speed up further this year and to remain as the world’s fastest growing economy for several years to come. MSE Top 20 Companies Share Performance 2011 50% Bayanteeg Suu Talkh Chikher Mogoin Gol Remicon APU Tavan Tolgoi Hotel Mongolia Bayangol Hotel BDSec State Department Store Baganuur Shivee Ovoo Sharyn Gol Khukh Gan Genco Tour Bureau Gobi 8% Mongolia Development Resources 22% Mongolian Telecom 23% Aduunchuluun 25% 0% 50% 100% 150% 200% 250% 300% 350% 400% 450% 414% 210% 184% 163% 144% 111% 91% 61% 50% 40% 35% 25% 18% 8% 7% 0% Source: MSE, Eurasia Capital “Hidden Jewels” Being Exploited Many small caps grew at skyrocketing rates emerging from very low bases. In 2011, 54 small caps out of the total listed 334 (MSE) companies surged more than 100%. The average share price growth of these 54 companies was 1,600% (median 491%), ranging from 107% to 28,010%. The combined market cap of these “hidden jewels” increased by MNT184bn (US$130mn) to MNT215bn (US$154mn) from a year earlier level of only MNT31bn (US$25mn). Most of them are industrial, consumer goods and mining plays. The tremendous growth is attributed to the following factors: The balance sheet assets were significantly undervalued or asset book values were much lower than the market values or replacement costs, Profits are hidden. The fundamental problem of accounting misreporting peculiar to frontier and early emerging markets is common in Mongolia. The belief that the accounting issues will be resolved leading to realization of hidden profits is one factor which supported the performance. www.eurasiac.com 28
  • 30.
    Mongolia Outlook 2012 World’sFastest Growing Economy 31 January 2012 Speculation. It should be noted that there is a speculation component with the general view that the market is undervalued and the Mongolian corporate sector has very positive prospects. We believe there are certainly a number of “hidden jewels”, however, investors should be mindful of the risks to explore and exploit them. The inherent risk of low liquidity of the market must be noted. The US$130mn market cap growth of these small caps was generated only on US$4.1mn total annual trade volume. 2011 MSE Top 10 Performers 0% Top 10 New Million $ Companies 10000% 20000% APP (Sudut) 30000% 28010% Teever Darkhan 13014% Tav 10917% Ar Bayankhangai 3221% 0 1 Market Cap, US$mn 2 3 4 5 APP (Sudut) Teever Darkhan Gutal Tav Berkh Uul 2447% Khereglee Impex 2148% Sor USIB 2014% Agro Tech Impex Ikh Barilga 1650% Nekheesgui Edlel Mongeo 1513% Darkhan Hotel 2010 Market Cap 1338% Bukhug 2011 Market Cap Khusug Trade Source: MSE, Eurasia Capital Ikh Barilga Source: MSE, Eurasia Capital MSE Fund Raising Activity Improving and New IPOs Expected in 2012 We expect a number of additional share offerings and few IPOs in 2012. Several currently listed companies and private companies submitted their IPO and additional offering documents to the Financial Regulatory Commission (FRC) for approval. Three companies received approval from FRC for additional share offering last year. On August 9, Silikat (SIL), an operator of light concrete plant in Darkhan city in Mongolia, successfully raised MNT3.65bn (US$3mn) issuing additional 16.2mn shares at MNT225 per share. On October 17, one of the blue chip coal stocks of the MSE, Sharyn Gol (SHG) completed MNT18.3bn (14.2mn) fund raising additionally offering 1.65mn or 16.2% of its shares at a price of MNT11,117 per share. This was the first capital raising by a mining company on the MSE and one of the largest. New York based Firebird Management’s funds acquired a controlling stake of the company in 2010 and SHG carried out additional exploration worth US$5mn in that year. In February, 2011, SHG released the new JORC compliant resource of 373.8Mt of thermal coal. Remicon (RMC), which operates concrete mixture plant in Ulaanbaatar, received approval from the FRC on its planned MNT7.5 9.4bn (US$5.4 6.7mn) secondary offering in December and currently collecting orders. www.eurasiac.com 29
  • 31.
    Mongolia Outlook 2012 World’sFastest Growing Economy 31 January 2012 New IPOs and more additional fund raisings are expected in 2012. As we reported last year the Mongolian Government approved a list of State Owned Enterprises (SOEs) that are slated for privatization; these are entities in mining, mineral processing, power generation and distribution, construction materials, telecom and transportation. The leaders among these expected privatizations we closely watch in 2012: Erdenes Tavan Tolgoi (ETT): The Mongolian government has planned to float up to 30% of the shares of ETT, who holds world’s largest untapped coking coal deposit, on the LSE and MSE within 1H2012. 10% of common shares were already distributed to all Mongolian citizens without charge in April, 2011. Another 10% should be sold to Mongolian companies according to the parliament resolution in 2010. However, the parliament is currently discussing whether to sell that 10% to Mongolian companies or to distribute it additionally to citizens. Mongolian Railway: In May 2011, the government announced that it had decided to raise the required fund for the construction of government’s planned new 1,100km railroad selling 49% of Mongolian Railway LLC on the MSE. The enterprise was established in 2008 with the intention to construct, own and use the railroads which will be built according to the state policy. And, now it is building the 1,100km railroad from South Gobi to the eastern border of Mongolia, in accordance with the state policy approved in 2010. The project cost is estimated to be US$2 3bn. We view that after the Erdenes Tavan Tolgoi IPO, the state priority will shift to this project though the time requirement for the project would possibly be longer than a single year. Baganuur: In 2010, the government approved Baganuur’s (MSE: BAN) additional share offering in the market by 2012. The company started the tender process to select technical and financial advisors for the project in October, 2011. The size of the offering is expected to be about 24% of the total shares. LSE and MSE Strategic Partnership Evolving In April 2011, Mongolia took a historically important step to develop its capital markets as the State Property Committee of Mongolia (SPC), MSE and London Stock Exchange (LSE) signed the landmark Master Service Agreement (MSA) to develop the MSE. The three institutions agreed on the details of modernizing the MSE with the support by the LSE during the next three years. According to the service agreement, the LSE will assist the MSE to introduce an integrated securities trading system, create effective legal environment, bring the infrastructure, technology, and help upgrade human resources capability in line with the international standards appointing a management team at the MSE. Since the agreement was signed, the LSE team together with the MSE and SPC has made an important progress in the areas of sector legal environment improvement, internal restructuring of the bourse, and professionals education. These include: Securities Market Law development: The restructured MSE led by the LSE team together with other sector regulatory and participatory organizations have developed new Securities Market Law and submitted to the Ministry of Justice for www.eurasiac.com 30
  • 32.
    Mongolia Outlook 2012 World’sFastest Growing Economy 31 January 2012 the review on September 1, 2011. The new law defines custody services and enables set up of custodians, nominee and omnibus accounts, trading and settlement of Depository Receipts. The law is expected to reduce legal conflicts. These amendments and revisions introduce international standards and are in line with the strategic partners’ plan to transform the securities settlement system of the MSE from current T+0 to T+3 which is standard in developed countries. MSE Rules and Regulations: The revised trading rules, membership rules are already approved, and listing rules, clearing & settlement rules are at the stage of approval. As the MillenniumIT system is installed in the MSE, the appropriate international standard trading and clearing & settlement rules are being developed. MillenniumIT: The system is completely installed by December, and the market professionals are currently exercising on trial trading. Training: The Academy of the LSE has carried out training programs for regulators, market participants and other stakeholders in UB and London during the last year. The major developments investors should expect to see in the Mongolian securities market and MSE in 2012 include: New Market and Trading Structures: MillenniumIT system will start officially and T+3 settlement cycle will replace T+0. Custodian services will be introduced, and Mongol Bank will start operating as a settlement bank, trading and clearing members will be registered. Minimum capital, financial and risk requirements for those participants will be re regulated. The Settlement Guarantee Fund (SGF) will be funded and enhanced. Listing and Membership Fees to Change: The MSE plans to change the initial listing and annual membership fees based on the market cap rather than nominal volume. They expect it will serve as an incentive for new companies to raise money listing on the exchange. Lower Trading and Settlement Fees: Currently the trading and settlement fees are very high compared with other international markets, and the MSE proposes to decrease the fees by 50% in 2012. As liquidity increases over time, the fees will be lowered to international levels, and be based on transactions not on monetary volumes of trades. The development will support the market liquidity making the market more attractive for international and domestic investors. Erdenes Tavan Tolgoi Listing: This will have significant direct and indirect impact to increase market size and liquidity attracting local and international investors. The MSE plans to improve corporate governance and transparency of the listed companies from this year. The new Company Law approved in October 2011 inserted many new concepts on corporate governance and transparency. We believe the law will support the securities market development. www.eurasiac.com 31
  • 33.
    Mongolia Outlook 2012 World’sFastest Growing Economy 31 January 2012 2012 Outlook We remain bullish on MSE listed equities in 2012. We expect the Mongolian equities to benefit from increased capital inflows and estimate the MSE TOP 20 Index to reach 28,000 by the end of this year, or +30% gain for 2012. We favor small caps that will outperform the index due to high growth of their businesses buoyed from low base effect and attractive valuations. We anticipate more IPOs and secondary offerings of Mongolian companies, both domestically and internationally, especially much anticipated jumbo IPO of Erdenes Tavan Tolgoi. Therefore, we strongly recommend our clients to invest in the Mongolian local equities as the most effective way to gain exposure to the Mongolian growth story. Our top picks for the next 12 months are Tavan Tolgoi (coking coal), APU (beverages), Remicon (construction materials) and Mongolia Development Resources (property). The pace of the upward move measured by the performance of the TOP 20 companies will be at a slower pace than the last year. Because first, the market has already come out of the low base and second, we view that the valuation of some large cap stocks have come into the their reliable intrinsic value ranges considering their fundamentals, growth outlooks as well as market and individual company risks. In our view, the downside risk is limited as the market has already reflected the significant correction since March 2011. We note that Mongolian stock market still remains illiquid and any inflow or outflow of hot money may significantly move the market up or down, as was the case in both 2010 and 2011. Erdenes Tavan Tolgoi’s IPO is expected to create crowd in the market. The MSE schedules to implement the public education programme during the year as all Mongolians are now shareholders of Erdenes Tavan Tolgoi. Flow of funds from foreign individual and institutional investors into Mongolia is projected to intensify starting from 2H2012. We expect within 1H2012 the European crisis situation will stabilize and Erdenes Tavan Tolgoi IPO will take attention of international investors into Mongolia. Although the market liquidity is currently low, it is likely to improve as new IPOs and new investors are expected to come into the market. In addition, the “Hidden Jewels” (small cap non resources sector companies) on the MSE will be further explored. The renovation and development measures at the MSE including start of MillenniumIT system, T+3 settlement, custodian services establishment, improvement in listing and membership fees and 50% decrease in trading commission are all to support the liquidity and attract new investors. www.eurasiac.com 32
  • 34.
    Mongolia Outlook 2012 World’sFastest Growing Economy 31 January 2012 We target the SILKMN index to reach 1,330 (+20% growth) in 2012, to be somewhat weighed down by expected subdue share performance of Ivanhoe Mines, the largest component of SILKMN index. Mongolian Mining Corp. (coking coal), Prophecy Coal (thermal coal, power), Entrée Gold (gold) and Erdene Resource Development (molybdenum and coal) are our top picks among the SILMN index companies. We advise investors to snap up the most beaten up stocks as the companies’ strong fundamentals and value of their resource assets become more apparent. www.eurasiac.com 33 Dec 11 Oct 11 Nov 11 Sep 11 Jul 11 Jun 11 Apr 11 May 11 Jan 11 Feb 11 Mar 11 Dec 10 Oct 10 Nov 10 Sep 10 Jul 10 Aug 10 Jun 10 Apr 10 May 10 Feb 10 Mar 10 Financial turbulences and debt crisis in Silk Road Mongolia Index Euro zone sent down emerging market 1,880 stocks significantly. Mongolia linked 1,780 internationally listed companies have 1,680 also suffered along with other emerging 1,580 markets companies. Total market 1,480 capitalization of Silk Road Mongolia 1,380 Index (SILKMN) which tracks 32 1,280 Mongolian companies was US$25.91bn 1,180 in 2011 and the index is down 27% y o 1,080 y. Silk Road Hong Kong Index (SILKHK), 980 includes 10 Hong Kong listed Mongolia 880 focused companies, is down 51% y o y. Ivanhoe Mines, Centerra Gold and Mongolian Mining Corp., the largest companies by market capitalization in Source: Silk Road Management SILKMN index are down 22.9%, 10.2%, 35.6% y o y, respectively. The main reasons behind the drop of share prices of the SILKMN index companies are, in our view, the overreaction by the investment community to the economic events occurring globally and, to some extent, their response to company specific events. However, thanks to strong demand by China for the Mongolian resources, sound fundamentals of the companies and while the global markets stabilize, we believe that internationally listed companies with operations in Mongolia are poised to experience recovery in 2012. Aug 11 International Equities
  • 35.
    Mongolia Outlook 2012 World’sFastest Growing Economy 31 January 2012 Mongolian Tugrik We maintain our long term bullish MNT and Current Account (2011) view on the MNT while short term Jan Feb Mar Apr May Jun Jul Aug Sep Oct Nov Dec volatilities may occur in 2012. Our call 1450 made on January 31, 2011 that the 186 1,396.37 1400 500 MNT may repeat global outperformance and continue 1350 1,000 appreciating another 10% in 2011 1300 1,500 played out partially. The currency strengthened 5% to MNT1,195 per US$ 1250 2,000 1245.5 through April 1 after which it has 2,500 2,421 1200 weakened 16.8% by end 2011 to MNT1,396 amid expanding current 1150 3,000 account deficit to US$2.4bn (end Current account, $mn (cumulative) (LHS) MNT/US$ (end month) (RHS) 2011) fuelled primarily by more than expected increase in imports of capital Source: Mongol Bank, NSOM, Eurasia Capital estimates goods for mining projects. The currency depreciated 11.1% y o y in 2011. The commercial banks experienced demand pressure for the US$ amid accelerated imports that exceeded export revenues. The current account deficit reached its record level of US$2.4bn by end 2011. The central bank that follows the flexible exchange rate regime has not intervened in the foreign exchange market and supplied limited amount of foreign currencies in the market. This resulted in accumulation of international reserves in the central bank a record level of over US$2.3bn at the end of 2011. We expect the MNT to experience volatility this year. Our target for the currency is 1,300 per US$ that represents approximately 7% appreciation in 2012. On one hand, there is a possible downside risk caused by further acceleration in imports for the development of key mining projects, including Oyu Tolgoi copper gold and Tavan Tolgoi coal mines as well as for building the major transport infrastructure. For example, import of trucks surged 177% to US$578mn last year. Expected high prices for petroleum products (petrol, diesel fuels) that represent over 16% Mongolia’s total imports and whose value jumped 68% last year (to US$1,052mn in 2011 from US$626mn a year earlier) may also increase the pressure on the downside. On the other hand, the national currency should expect some strength supported by ramp up in exports by key coal producers and inflow of foreign investments. Assuming that international prices for the country’s major export commodities – coal and copper – are expected to stay firm in 2012, and demand in China remains firm, the Mongolian economy should benefit from increase in physical volume of their exports, especially that of coal. We estimate that the coal exports may increase at least 40% y o y to 30 million tonnes in 2012 (from over 21 million tonnes in 2011) easing the downside pressure on the currency. www.eurasiac.com 34
  • 36.
    Mongolia Outlook 2012 World’sFastest Growing Economy 31 January 2012 In addition, we expect the central bank will likely intervene in the foreign exchange market to stem high inflation as political stress rises amid the June 2012 Parliamentary elections. We already see growing critics from the members of the Democratic Party, which withdrew from the coalition government this month, to seek more support from the voters as the elections approach. The democrats blamed the central bank that the high exchange rate of the US$ has affected fuel prices and, consequently other consumer goods that caused concerns among the people. Therefore, in our view, the central bank sold relatively large amount of US$ in the market to ease the accelerated depreciation of the MNT in January this year. www.eurasiac.com 35
  • 37.
    Mongolia Outlook 2012 World’sFastest Growing Economy 31 January 2012 Fixed Income Positive outlook is expected in 2012 for government bonds, certificates of deposits (CDs) and term deposits in major commercial banks in Mongolia. We view that in 2012 the government of Mongolia will further utilize debt markets both domestically and internationally for development in mining, construction of roads and houses, as well as to support social spending. The issuance of dollar denominated government bonds will accelerate the process to tap global international debt markets. It is currently unclear that the upcoming year will be successful for corporate bonds as they continue to undergo the test period started in 2011 with the Meat Bond offering. CDs and term deposits of major banks in Mongolia will continue offering attractive investment opportunities with high interest rates. The last year experienced relative improvement in government bond figures backed by confidence in Mongolia’s expected growth. Primary bond sales increased over 7.867 times in nominal terms year over year with a total amount of MNT236.73bn (over US$169mn) in 2011, although there was significant slowdown in later offerings. During June through August, the government offered bonds to finance the long term housing loan program for 4,000 government officials, and nearly MNT65bn was successfully sold out of the MNT72bn offer. The Mongolian government announced MNT300bn bonds issue in several offerings starting from August, to support cashmere, wool industries, and small and medium enterprises (SMEs). Though nearly MNT172bn of the issue was traded, further sales in October and November declined next to zero, affected by the negative global sentiment over government debts. Therefore, it is worth noting that further developments in government bond offerings might be significantly affected by the same factor in 2012. The Development Bank of Mongolia (DBM), with the unconditional backing of the Ministry of Finance of Mongolia and ING Groep of the Netherlands, established a US$600mn euro medium term note program. In December, the DBM sold the initial US$20mn one year bonds at 6% to ING Groep in a private placement. Given that Mongolia needs huge amounts of investment to finance railway, mining, and agriculture projects, construction of roads and accommodation, and various social spending, the DBM is expected to facilitate access to foreign debt for several debt issues. Meat Bonds (also “Makh Bond”) issued by Just Group kicks off the corporate bonds offer after a long break since 2007. While tapping into the debt market by the companies may be considered a good sign to diversify the sources of capital to implement projects at the company level, Mongolia is currently undergoing a testing period to measure the appetite of the corporate debt investors. Just Group was able to raise only just over MNT4bn out of the planned MNT30bn to finance meat processing activities. The disappointing bond sales were mainly due to risk aversion toward the debt instrument. We may expect such uncertainty in 2012, and it is unclear if there will be any bond offer by local companies, considering the risks of investing in untested market. CDs and term deposits at the top four commercial banks offer over 13% rates annually in MNT and 6% rates in the US$ for individuals. These banks offer negotiable rates for www.eurasiac.com 36
  • 38.
    Mongolia Outlook 2012 World’sFastest Growing Economy 31 January 2012 corporate clients at about 6% 8% in the national currency. Despite these favorable rates, for foreign investors, we believe the deposits in MNT should be considered together with the risks involved in the exchange rate. Deposits rates by major banks Bank Golomt Bank Trade and Development Bank Khan Bank Xac Bank Source: Company Data www.eurasiac.com 12 month rate in MNT 13.8% 13.5% 13.4% 13.2%/14.4% 12 month rate in US$ 6.6% 6.6% 6% 6%/6.2% Type CDs CDs Term deposit “Housing”/“Age gracefully” deposits 37
  • 39.
    Mongolia Outlook 2012 World’sFastest Growing Economy 31 January 2012 Property US$/sqm In Mongolia Outlook 2011, we mentioned Silk Road Ulaanbaatar Property Index, US$ per sqm that strong economic growth, national 1050 currency appreciation and speculative inflow 1000 of foreign capital have driven residential 950 property prices up nearly 20% during 2010. 900 We also concluded that growth of property 850 prices in US$ terms was mainly attributed to 800 MNT appreciation of 12.9%. At the end of 750 2011, Silk Road Ulaanbaatar Property Index 700 (SRPUB), the benchmark that tracks the 650 property prices in Ulaanbaatar advanced 600 18.4%. It implies that the average price of Jan 09 Jun 09 Nov 09 Apr 10 Sep 10 Feb 11 Jul 11 residential property in the secondary market reached US$1,018 per square meter and for Source: Silk Road Management the first time during the past 3 years it exceeded US$1,000 threshold. It has to be mentioned that unlike 2010, when Mongolian currency appreciated, this year MNT lost 11.1% y t d. The plunge of tugrik had downside impact in property prices in US$ terms, which suggests that price growth in MNT is even more significant. Mongolian banking system has been rapidly expanding but the effect of mortgage loan penetration was not significant at 4% in 2010 and 6% in 2011. Despite this, mortgage loans still nearly doubled from last year from MNT334bn to MNT656bn and had major impact in residential property market during 2011. We expect that Ulaanbaatar residential property prices will continue appreciation as the availability of mortgage financing increases and the rate of loan penetration grows. Mortgage loans, MNTbn 700 600 500 400 300 200 100 0 2008 2009 2010 2011 The Central Bank of Mongolia Luxury residential property segment is driven by foreign investors in the market and the growing number of wealthy Mongolians. With population of 2.7 million and fast growing economy, the significance of wealth creation for Mongolians will be even more apparent in the coming years. This factor has already resulted in increasing number of luxury residential developments as well as stimulating the demand from local population. In addition, cost of construction has increased as a result of appreciation of land prices in central locations. Majority of the luxury apartments were priced at US$1500 2700 per sqm during 2011 and average house or larger apartment could be priced at over US$500,000. www.eurasiac.com 38 Dec 11
  • 40.
    Mongolia Outlook 2012 World’sFastest Growing Economy 31 January 2012 Although the pace of construction slowed during 2009 2010 and office property projects stalled, market has picked up from 2H2010 and the supply of quality office space is expected to increase significantly going forward. Completion of Monnis Tower and Central Tower (51% owned by Shangri La Asia), has contributed to the increase of quality office space, followed by launch of Express Tower and Blue Sky Tower, all concentrated in the Sukhbaatar Square area. However the total space of modern class office space is estimated at 160,000sqm, still not adequate to alleviate demand pushing rental rates up. In the immediate future we do not expect that Grade A offices will be impacted by the increased supply and the rental rates will continue to increase. Situation might change from 2H2013 when the major projects will be completed and the market will see substantial increase of new office spaces. Mongolian commercial property market has rather young history. Robust economic growth during the last few years and improving living standards of the local population of Construction by property type, MNTbn Mongolia has driven retail sector to expand 300 significantly. According to National 250 Statistical Office, wholesale and retail trade 200 in Ulaanbaatar surged 57.7% from 1.75bn to MNT2.75bn in 2011. With the launch of 150 Max Mall and Naran Mall, the supply of 100 prime retail space has increased but rental 50 rates remain to be close to office rents, suggesting that there is significant potential 0 for growth. 2006 2007 2008 2009 2010 Residential Trade & service Other 2011 Industrial Hospitals, schools and cultural Estimated total contribution of the tourism sector to GDP in Mongolia remains to be Source: National Statistical Office of Mongolia around 9%. The number of visitors in Mongolia has been on the rise and reached all time high of over 492,800 visitors in 2009. In 2011, total of 460,360 tourists visited Mongolia according to General Authority for Border Protection. The demand for luxury hotel rooms is expected to grow as the booming mining sector will stimulate business travel. Currently operating hotels, that are considered to be 4 5 stars, do not fully comply with international quality standards. However situation is changing quickly. In 2011 Ramada hotel opened its doors, the first in a new wave of international brands to move into Ulaanbaatar. Construction projects are already underway for Shangri La, Best Western, Hilton, Sheraton, Hyatt and Radisson. In 2012, we reiterate our view that the Mongolian property market possesses significant growth potential. With the robust economic growth expectations, we estimate that property prices will continue to grow at double digit rates. Residential property prices in Ulaanbaatar should add another 15% in 2012 and reach US$1,150 per sqm. We also stand by our view that the growth will be boosted by economic growth, wealth creation and national currency appreciation. However we expect that from 2012 mortgage loans will start playing major role in property market growth. www.eurasiac.com 39
  • 41.
    Mongolia Outlook 2012 World’sFastest Growing Economy 31 January 2012 Private Equity Accelerating economic growth in Mongolia will offer a strong appeal for more sophisticated investors to search for private equity deals in financial services (banking, insurance, leasing), agricultural, manufacturing, media, IT, property advisory, tourism and hospitality sectors. Moreover, we believe that there are numerous under capitalized small to medium sized resource companies in Mongolia which are seeking for funds to develop their resources. A growing number of privately held companies, looking to list domestically and internationally, will create pre IPO opportunities. The telecom market appears to be relatively saturated with more than 60% penetration rate of cell phone users, according to South Korea’s SK Telecom. In 2011, SK Telecom exited the market selling its entire 29.3% stake at Skytel LLC for US$25mn to existing shareholders. Terra Energy LLC (TE), owned by Guildford Coal, may create a pre IPO opportunity as the owners initially planned to list TE with several exploration licenses in South Gobi region of Mongolia. M&A Mongolia experienced significantly larger M&A activities during 2011 in line with our projections the previous year. We estimate 39 M&A deals were observed with the total volume of over US$2bn in 2011, nearly twice as much as in 2010. Mining and exploration is an exclusive sector for M&A in Mongolia, particularly in 2011, many international mining and exploration companies were active participants in the process. According to our estimates, since 2007, the Mongolian coal industry has experienced over 50 M&A deals with total value of US$2.19bn. In 2011 only, 27 coal related M&A deals worth US$1.65bn were completed. The most prominent names in terms of the M&A deal size throughout the year include Banpu (Thailand), Mongolian Mining Corp. (Mongolia), Noble Group (Asia), Guildford Coal (Australia). Banpu, Thailand’s coal magnate, acquired Hunnu Coal with over 800Mt JORC compliant coking and thermal coal resources in 11 exploration projects in Mongolia. Banpu acquired 12.2% of Hunnu in March for AUS$45mn and the rest for AUS$477mn (US$493mn) in September through November at AUS$1.8 per share, paying nearly 30% takeover premium to shareholders. Mongolian Mining Corp. acquired the Baruun Naran (QGX) coking coal mine with 253Mt NI 43 101 compliant Measured and Indicated resources for US$464.5 from Kerry Mining (90%) and MCS Minerals (10%). The acquisition value may be adjusted to US$950mn depending on the proven and probable reserves as well as production from the Baruun Naran mine. Noble Group, a large Asian commodities trader, acquired 10.1% undiluted interest in Aspire Mining by the end of 2011. Through a joint venture (50/50) with Xanadu Mines, Noble owns the Nuurstei coking coal project (with the right to own up to 80%) and Javkhlant project. www.eurasiac.com 40
  • 42.
    Mongolia Outlook 2012 World’sFastest Growing Economy 31 January 2012 Guildford Coal, an Australian exploration company, made exploration license acquisitions worth a total of US$50.73mn through its joint venture, Terra Energy, with local partners. The company managed to increase its stake in Terra from 50% to 70% this year for US$7.23mn. Guildford recently carried out talks with potential buyers. Draig Resources (formerly C @ Ltd.), another Australian exploration company, acquired 100% shares of BDBL LLC, a subsidiary of Peabody Winsway Resources, with 8 coal exploration licenses. The settlement worth of US$7.87mn was completed in late 2011. We believe Mongolia continues to be one of the most appealing targets for M&A deals in 2012. Coal companies, both exploration and mining, will dominate in the list of potential strategic buyers. Mongolia holds estimated 160 billion tonnes of coal resources with significant further exploration potential and only 17% of the area has been explored. M&A target prospects, in our view, will include SouthGobi Resources (SGQ: TSX), Mongolia Energy Corp. (276: HK), Aspire Mining (AKM: ASX), Guildford Coal (GUF: ASX), Sharyn Gol (SHG: MSE), Xanadu Mines (XAM: ASX), Mogoin Gol (BDL: MSE). Naturally, the international players will account for the majority of the strategic buyers as they contribute to the development with much needed funds and expertise. We expect potential strategic buyers such as ArcelorMittal, Vale, Xstrata, Glencore, Noble Group, KORES, JOGMEG, Teck Resources to expand actively in Mongolia. Following the activities in mining, logistics will be an attractive topic. In 2011, Tembusu Investments (TIL: AIM), a logistics company, acquired Salins Limited, a local company with assets licensed to carry out coal transportation and other logistics services in Mongolia. www.eurasiac.com 41
  • 43.
    Mongolia Outlook 2012 World’sFastest Growing Economy 31 January 2012 Infrastructure Mongolia requires significant investments into infrastructure to support mining development. Infrastructure may turn into the major impediment to growth. Infrastructure problems faced by the country are reflected in an IFC Doing Business 2012 report, which ranked Mongolia 171 among 183 economies in ‘Getting electricity’ category. For comparison, the country is ranked 29 in ‘Protecting investors’ and 26 in ‘Registering property’. The rankings indicate what the country needs to improve in order to realize its considerable growth potential. Mongolia needs to provide power and water to growing mining projects and urban areas, expand its railroad and road infrastructure. The World Bank estimated that basic infrastructure development costs to support mining activities in Southern Mongolia alone will be over US$5bn. Implementation of ambitious railroad construction project may require approximately US$4.5bn in the next two to three years for about 1,800km of new railroads. They will connect mineral deposits in Southern Mongolia to Sainshand, where a large industrial complex is planned, and further to China and Russia. Construction of the industrial complex in Sainshand is estimated to cost US$10bn. The country needs to develop its water sources and increase power capacity to support its fast developing mining sector and urban settlements. The cost of building infrastructure will be substantial. Therefore, Mongolian government is seeking private sector investments into infrastructure through public private partnerships (PPPs). The Concessions Law adopted in 2010 sets the legal framework for private sector participation in the development of infrastructure projects in Mongolia. The government identified 121 projects to be implemented with private sector participation. Both foreign and domestic companies can participate in the projects individually or jointly. Concessions could be gained via open tender, competitive bidding or direct contract. Power In 2011 Mongolia made tangible steps to attract private investments into infrastructure development. The State Property Committee of Mongolia (SPC) announced a number of BOT tenders in power generation and road transportation. The year marks conclusion of the first concession agreement in power sector. SPC and the foreign invested New Asia Mining Group signed BOT concession agreement on Mogoin Gol Power Plant. Under the agreement the company builds 60MW Mogoin Gol Power Plant near Mogoin Gol coal mine to provide power to Zavkhan and Gobi Altai provinces. The power plant may also provide power to nearby Aspire Mining coal project, when it starts production at its property in the near future. The company will transfer the power plant to state after 20 year concession period. Construction is estimated to cost US$110mn and expected to be completed in the next two years. The State Property Committee of Mongolia also started competitive selection of private partners to build Combined Heat and Power Plant (CHP 5) in Ulaanbaatar with initial capacity 450MW, to be expanded to over 1GW by 2020, and Power Plant in Dornod province with initial capacity 100MW with an option to increase to 250MW. www.eurasiac.com 42
  • 44.
    Mongolia Outlook 2012 World’sFastest Growing Economy 31 January 2012 Private sector initiated several projects in power generation. Clean Energy Company, a subsidiary of Newcom Group, is implementing US$100mn wind farm project with 50MW total capacity. The wind farm is situated about 70km southeast of Ulaanbaatar and will be connected to central electricity grid. Construction is expected to be completed in the autumn of 2012. Prophecy Coal has obtained all government permissions to build 600MW power plant at Chandgana coal property. The project is still at early stages of implementation and still needs to secure financing and negotiate a power purchase agreement in Mongolia or abroad. Road In 2011 Gobi Road LLC, a subsidiary of Mongolian Mining Corporation (MMC) completed construction of 245km paved road from MMC coal mine to Chinese border under 10 year BOT agreement with SPC. The new road is planned to accommodate 2,000 trucks per day and have an annual throughput capacity of 18Mt of coal. Other concession projects announced by SPC included: 50km Narynsukhait – Shiveekhuren highway project for mining transportation and public use 435km Tavan Tolgoi – Khanbogd – Khangi highway project for mining transportation and public use Ulaanbaatar – Khushig Valley New International Airport highway project for public use 367km Altanbulag – Ulaanbaatar highway project for public use 630km Ulaanbaatar – Zamyn Uud highway project for public use Railroad There is a slight delay in implementation of the three stage Railway Policy adopted in June 2010. It reflects the sheer ambition of the initial plan to build thousands of kilometers of new railroads in a matter of years. Financing railroad construction is set as a priority for the state owned Development Bank of Mongolia. The Bank was specifically established to finance large infrastructure, mining and industrial projects. It is planning to raise up to US$600mn in international debt markets for domestic projects. Construction of the new railroads may require approximately US$4.5bn. The country plans to construct 1,766km of new railroads in south and east. Proposed routes are: Tavan Tolgoi – Sainshand 468km Sainshand – Khoot 450km Khoot – Choibalsan 155km Khoot – Nomrog 380km Tavan Tolgoi – Gashuunsuhait 267km Nariinsuhait – Shiveehuren 46km It appears that the first and second stages of the Railway Policy will be implemented simultaneously opening new trade routes to Russian and Chinese markets. The railroad construction plan is still ambitious and financing the project remains a challenge. www.eurasiac.com 43
  • 45.
    Mongolia Outlook 2012 World’sFastest Growing Economy 31 January 2012 Planned Railways in Mongolia Source: Mongolian Railroad Policy, Eurasia Capital Infrastructure Investment Key in 2012 Construction of new railroads expected to start in 2012 would create opportunities for investors, construction and operating companies. The government of Mongolia is likely to provide a concession to the private sector to build the railroad under a BOT model. Beyond railroads, the US$10bn Sainshand Industrial Complex project may go ahead in 2012 offering numerous opportunities for investors and contractors alike. The complex is designated to become a super hub for processing Mongolian raw materials and producing semi and finished products for export. Infrastructure services to mining projects represent strong investment opportunities through 2012 and beyond. Gobi Road LLC toll road for coal transportation in the south and Mogoin Gol Power Plant in the north of the country are examples of opportunities that exist in infrastructure in Mongolia. Demand for road transportation of minerals is set to rapidly increase as the country ramps up coal output while new railroad construction is delayed. Financing captive infrastructure for mining projects, including roads, power and water supply may yet turn out to be the best way of capitalizing on ongoing mining boom. Furthermore, mining settlements around major projects would require a complex of infrastructure services beyond accommodation, power and water supply. Infrastructure services provided by third party will allow mining companies to free capital and other resources for mining activities. The concept is still quite new for Mongolian companies and represents a niche yet not occupied by strong, entrenched player. www.eurasiac.com 44
  • 46.
    Mongolia Outlook 2012 World’sFastest Growing Economy 31 January 2012 ANNEX 1: 2011 M&A LEAGUE TABLE Buyer 1 2 3 4 5 6 7 8 9 10 11 12 13 14 15 16 17 18 19 20 21 22 23 24 25 26 27 28 29 30 31 32 Mongolian Mining Corp Banpu Minerals Goldstream Sovereign Wealth Funds Banpu Minerals Hunnu Coal Guildford Coal Sun Clay Group and Global Com Think Environmental Noble Group Guildford Coal Origo Partners Geological Resource Partners Global Met Coal Draig Resources (former CEO) Guildford Coal Voyager Resources Lucky Strike Resources Guildford Coal Wedge Energy International Prophecy Coal TVN Corporation Robe Australia General Mining Corp Lucky Strike Resources Firebird Mongolia Fund Blina Minerals Local Mongolian Companies Garrison International Xanadu Mines Haranga Resources Kara Minerals 33 34 35 Buyer Country MGL TN TN AUS AUS SNG HK AUS UK US CN AUS AUS AUS CN AUS CN CN AUS AUS AUS CN US AUS MGL/US CN AUS AUS AUS Banpu Minerals TN General Mining Corp AUS Xanadu Mines/Xanadu Metals AUS Mongolia 36 Solartech International Holdings HK 37 Xanadu Mines AUS 38 Xanadu Noble JV AUS/HK 39 Hunnu Coal AUS Total Source: Company data, Eurasia Capital estimates www.eurasiac.com Target Baruun Naran Coking Coal Mine Hunnu Coal ZAO Zolotoy Vostok Mongolia Gobi Coal and Energy Hunnu Coal Rio Tinto Minerals Developments Mongolian company SK Telecom Co Azargyn Gol Chonot Aspire Mining Deliin Shand Project Moly World Blue Wolf Mongolia Holdings Corp. MG Energy 8 coal licences Terra Energy Mongolian company Mongolian companies Alag Tevsh Undur Tolgoi Minerals Mongolian company Nuurst Thermal Coal Deposit Tsagaan Gol Exploration Licence Uvs Basin Mongolia Coal Project Mongolian company Berkh Uul BSI Berkh Uul Dehroy Financial Advisory Khavtsgait coal project Selenge Iron Ore Prooject Amirlangui Ujin / Narsyn Hundlun Tin Project Hunnu Coal Khuden Coal Deposit Soduntag Vangyunshing Javhlant Coking Coal Project Nuurstei coking coal project Unst Khudag Coal Mine Type 100% 100% 100% 15% 12% 70% 100% 29% 51% 3% 100% 20% 9% 35% 100% 20% 80% 80% 100% 90% 100% 100% 100% 100% up to 75% 50% N/A 3% 100% 100% 20% 100% Value, US$ mn 950 493 300 91 44 40 25 25 16 15.95 15 10 9.2 8.8 7.8 7.23 6.5 5.8 3.5 2 2 1.5 1 1 0.9 0.61 0.3 0.3 0.022 N/A N/A N/A 31.05.2011 17.11.2011 16.09.2011 Dec, 2011 08.03.2011 23.05.2011 08.07.2011 12.01.2011 23.06.2011 22.03.2011 08.07.2011 02.06.2011 04.08.2011 04.11.2011 17.07.2011 31.03.2011 09.05.2011 11.07.2011 09.08.2011 22.08.2011 04.05.2011 24.06.2011 12.10.2011 27.09.2011 27.04.2011 05.04.2011 17.05.2011 05.04.2011 18.08.2011 22.11.2011 11.11.2011 11.11.2011 Coal Coal Copper 90% N/A 100% N/A N/A N/A 07.11.2011 12.10.2011 30.03.2011 Rare earth Coal Coal Coal N/A 100% 80% 15% N/A N/A N/A N/A 2083.41 05.01.2011 22.07.2011 15.06.2011 25.01.2011 Coal Coking coal Gold Coking coal Coal Coal Coal Coal Coal Molybdenum Coal Coal Coal Gold Coal Coal Copper gold Coal Coal Coal Coal Coal Coal/Gold Copper Gold Coal Coal Coking coal Iron ore Tin Stake, % Date 45
  • 47.
    Mongolia Outlook 2012 World’sFastest Growing Economy 31 January 2012 ANNEX 2: SILK ROAD COMPOSITE INDEX COMPANIES # Ticker Name 1 2 3 4 5 6 7 8 9 10 11 12 13 14 15 16 17 18 19 20 21 22 23 24 25 26 27 28 29 30 31 32 33 34 35 36 37 38 39 40 41 42 43 44 45 46 47 48 49 50 51 52 53 54 55 IVN : US ENRC : LN KAZ : LN KMG : LI CG : CN DGO : LN GENL : LN 975 : HK GKP : LN UUU : CN ZKM : LI HSBK : LI KZTK : KZ AFR : LN DNO : NO 1733 : HK SGQ : CN KKB : LI HOIL : LN 276 : HK BUND : IQ TTL : MO BGEO : LI BDSI : IQ BBOB : IQ GUF : AU BROI : IQ BNOR : IQ SNM : CN CCBN : KZ WZR : CN AKM : AU APU : MO BKUI : IQ BAN : MO OPP : LN CPI : CN MXP : LN IBSD : IQ BIME : IQ ETG : CN FEO : AU SHV : MO TPL : CN YAK : CN KGL : AU BEFI : IQ KYS : LN BMNS : IQ BCOI : IQ GNF : CN CGH : LN TAU : LN VOR : AU STCM : LN Ivanhoe Mines Eurasian Natural Resources Kazakhmys Kazmunaigas Exploration Centerra Gold Dragon Oil Genel Energy Mongolian Mining Corp. Gulf Keystone Petroleum Uranium One Zhaikmunai Halyk Savings Bank Kazakhtelecom Afren DNO International Winsway Coking Coal Holdings Southgobi Resources Kazkommertsbank Heritage Oil Mongolia Energy Corp. United Bank Of Iraq Tavan Tolgoi JSC Bank Of Georgia Dar Es Salam Investment Bank Bank Of Baghdad Guildford Coal Credit Bank Of Iraq North Bank Shamaran Petroleum Corp. Bank CenterCredit Westernzagros Resources Aspire Mining Apu JSC Kurdistan International Bank Baganuur JSC Origo Partners Condor Petroleum Max Petroleum Baghdad Soft Drinks Iraqi Middle East Investment Bank Entree Gold Feore Shivee Ovoo JSC Tethys Petroleum Mongolia Growth Group Kentor Gold Economy Bank For Investment Kryso Resources Al Mansour Bank Commercial Bank Of Iraq Greenfields Petroleum Corp. Chaarat Gold Holdings Tau Capital Voyager Resources Steppe Cement 56 57 58 59 60 61 62 63 64 65 HMAN : IQ SHG : MO BIBI : IQ PCY : CN FML : LN CAML : LN BNOI : IQ MATD : LN BBAY : IQ BSUC : IQ Mansour Hotel Sharyn Gol JSC Investment Bank Of Iraq Prophecy Coal Frontier Mining Central Asia Metals National Bank Of Iraq Petro Matad Babylon Bank Sumer Commercial Bank www.eurasiac.com MCap, US$mn 13,095.4 12,692.0 7,617.7 6,298.8 4,184.1 3,628.6 3,140.3 2,786.0 2,516.8 2,033.8 1,794.5 1,589.7 1,528.6 1,426.7 1,189.0 1,112.5 1,073.0 1,052.1 781.9 595.4 460.2 415.6 407.4 384.6 336.1 331.1 308.0 300.9 282.2 262.5 244.6 235.5 223.8 213.9 197.1 195.5 187.3 168.7 164.7 164.2 154.9 151.9 147.3 146.6 141.0 130.7 127.5 112.9 110.4 108.6 100.8 99.1 97.0 93.4 93.0 2011 Growth 22.7% 39.4% 42.6% 24.6% 9.3% 14.9% 12.0% 35.6% 1.6% 55.1% 21.1% 51.6% 7.0% 41.5% 8.1% 51.0% 50.7% 54.6% 57.4% 69.8% 13.1% 91.0% 35.6% 23.0% 86.6% 2.7% 63.3% 7.0% 68.8% 59.0% 49.5% 22.9% 111.1% 76.1% 24.8% 14.6% 60.7% 41.1% 36.4% 66.4% 64.3% 12.0% 17.7% 67.7% 457.1% 33.3% 4.6% 62.7% 8.6% 9.4% 23.3% 64.1% 12.2% 26.9% 37.4% 85.6 82.8 81.3 79.9 77.2 76.0 72.7 70.8 69.3 68.4 4.0% 8.1% 25.8% 52.6% 64.3% 37.0% 3.7% 79.7% 8.0% 1.2% Industry Metals & Mining Metals & Mining Metals & Mining Oil and Gas Gold Oil and Gas Oil and gas Metals & Mining Oil and gas Energy Oil and Gas Bank Telecom Oil and gas Oil and gas Coal Energy Banks Oil and gas Energy Bank Energy Bank Bank Bank Energy Bank Bank Oil and gas Bank Oil and gas Metals & Mining Beverages Bank Energy Investments Oil and Gas Oil and Gas Consumer Goods Bank Metals & Mining Steel Energy Oil and Gas Investments Gold Bank Gold Bank Bank Oil and Gas Gold Investments Gold Construction materials Hotel & Tourism Energy Bank Energy Metals & Mining Metals & Mining Bank Oil and Gas Bank Bank Country of operation Mongolia Kazakhstan Kazakhstan Kazakhstan Kyrgyzstan Turkmenistan Iraq Mongolia Iraq Kazakhstan Kazakhstan Kazakhstan Kazakhstan Iraq Iraq Mongolia Mongolia Kazakhstan Iraq Mongolia Iraq Mongolia Georgia Iraq Iraq Mongolia Iraq Iraq Iraq Kazakhstan Iraq Mongolia Mongolia Iraq Mongolia Mongolia Kazakhstan Kazakhstan Iraq Iraq Mongolia Mongolia Mongolia Kazakhstan Mongolia Kyrgyzstan Iraq Tajikistan Iraq Iraq Azerbaijan Kyrgyzstan Kazakhstan Mongolia Kazakhstan Iraq Mongolia Iraq Mongolia Kazakhstan Kazakhstan Iraq Mongolia Iraq Iraq 46
  • 48.
    Mongolia Outlook 2012 World’sFastest Growing Economy 66 67 68 69 70 71 72 73 74 75 76 77 78 79 80 81 82 83 84 85 86 XAM : AU BMFI : IQ HAR : AU BASH : IQ AAZ : LN 402 : HK BEU : MO HNTI : IQ EAS : CN MCH : MO JPR : AU ALH : CN KCC : CN Bank : GG HMB : LN CHGG : LI RXP : LN MSR : AU ERD : CN 61 : HK MOU : AU Xanadu Mines Mosul Bank For Devt & Invest Haranga Resources Ashur International Bank Anglo Asian Mining Mongolia Investment Group Berkh Uul JSC National For Tourist Invest East Asia Minerals Corp. Mongolian Telecom Jupiter Energy Alhambra Resources Kincora Copper Liberty Bank JSC Hambledon Mining Chagala Group Roxi Petroleum Manas Resouces Erdene Resource Development North Asia Resources Holding Modun Resources Total Source: Bloomberg, Silk Road Management, Eurasia Capital www.eurasiac.com 31 January 2012 66.2 57.7 57.5 56.5 55.1 54.5 52.2 52.2 51.0 50.1 49.9 46.1 42.2 41.6 38.9 38.3 35.5 34.0 33.3 32.5 32.5 79,178 38.9% 48.4% 55.5% 12.5% 54.8% 68.9% 2446.7% 12.4% 94.2% 22.9% 24.3% 52.6% 14.8% 33.3% 53.5% 47.1% 36.2% 38.3% 69.8% 75.6% 350.0% Metals & Mining Bank Steel Bank Metals & Mining Investments Energy Hotel & Tourism Metals & Mining Telecom Gold Gold Metals & Mining Bank Gold Property Oil and Gas Gold Metals & Mining Energy Energy Mongolia Iraq Mongolia Iraq Azerbaijan Mongolia Mongolia Iraq Mongolia Mongolia Kazakhstan Kazakhstan Mongolia Georgia Kazakhstan Kazakhstan Kazakhstan Kyrgystan Mongolia Mongolia Mongolia 47
  • 49.
    Mongolia Outlook 2012 World’sFastest Growing Economy 31 January 2012 ANNEX 3: SILK ROAD HONG KONG INDEX COMPANIES # Ticker 1 2 3 4 5 6 7 Name 975 : HK 1733 : HK 1878 : HK 276 : HK 402 : HK 1166 : HK 61 : HK Mongolian Mining Corp. Winsway Coking Coal Holdings Southgobi Resources Mongolia Energy Corp. Mongolia Investment Group Solartech International Holdings North Asia Resources Holdings Total Source: Bloomberg, Silk Road Management, Eurasia Capital MCap, US$mn 2,786.0 1,112.5 1,066.2 595.4 54.5 40.2 32.5 5,687.4 2011 Growth 35.6% 51.0% 54.2% 69.8% 68.9% 81.6% 75.6% Industry Mining Energy Energy Energy Investments Energy Energy Country of operation Mongolia Mongolia Mongolia Mongolia Mongolia Mongolia Mongolia ANNEX 4: SILK ROAD AUSTRALIA INDEX COMPANIES # Ticker 1 2 3 4 5 6 7 8 9 10 Name GUF:AU AKM:AU FEO:AU KGL:AU VOR:AU XAM:AU HAR:AU JPR:AU MSR:AU MOU:AU Guildford Coal Aspire Mining Feore Kentor Gold Voyager Resources Xanadu Mines Haranga Resources Jupiter Energy Manas Resouces Modun Resources Total Source: Bloomberg, Silk Road Management, Eurasia Capital www.eurasiac.com MCap, US$mn 331.1 235.5 151.9 130.7 93.4 66.2 57.5 49.9 34.0 32.5 1,182.7 2011 Growth 2.7% 22.9% 12.0% 33.3% 26.9% 38.9% 55.5% 24.3% 38.3% 350.0% Industry Energy Energy Metals & Mining Metals & Mining Metals & Mining Energy Energy Oil and Gas Metals & Mining Energy Country of operation Mongolia Mongolia Mongolia Kyrgyzstan Mongolia Mongolia Mongolia Kazakhstan Kyrgyzstan Mongolia 48
  • 50.
    Mongolia Outlook 2012 World’sFastest Growing Economy 31 January 2012 ANNEX 5: SILK ROAD MONGOLIA INDEX COMPANIES # Symbol Name 1 IVN:US IVANHOE MINES 2 CG:CN CENTERRA GOLD 3 975:HK MONGOLIAN MINING CORP 4 1733:HK WINSWAY COKING COAL HOLDINGS 5 1878:HK SOUTHGOBI RESOURCES 6 276:HK MONGOLIA ENERGY CORP 7 TTL:MO TAVAN TOLGOI JSC 8 GUF:AU GUILDFORD COAL 9 AKM:AU ASPIRE MINING 10 APU:MO APU JSC 11 BAN:MO BAGANUUR JSC 12 OPP:LN ORIGO PARTNERS 13 ETG:CN ENTREE GOLD 14 SHV:MO SHIVEE OVOO JSC 15 YAK:CN MONGOLIA GROWTH GROUP 16 VOR:AU VOYAGER RESOURCES 17 SHG:MO SHARYN GOL JSC 18 PCY:CN PROPHECY COAL 19 CAML:LN CENTRAL ASIA METALS 20 MATD:LN PETRO MATAD 21 XAM:AU XANADU MINES 22 HAR:AU HARANGA RESOURCES 23 402:HK MONGOLIA INVESTMENT GROUP 24 MCH:MO MONGOLIAN TELECOM JSC 25 EAS:CN EAST ASIA MINERALS CORP 26 KCC:CN KINCORA COPPER 27 1166:HK SOLARTECH INTERNATIONAL HOLD 28 TVN:AU MODUN RESOURCES 29 ERD:CN ERDENE RESOURCE DEVELOPMENT 30 61:HK NORTH ASIA RESOURCES HOLDING Data as of December 31, 2011. *Since IPO Date Source: Bloomberg, Eurasia Capital www.eurasiac.com MCap, US$mn 13,110.2 4,119.2 2,785.1 1,112.2 1,065.9 595.3 415.3 316.3 233.0 223.7 197.0 194.4 152.9 147.2 118.2 92.4 82.7 78.5 75.5 70.8 65.5 56.9 54.5 50.1 49.6 42.0 40.2 34.5 33.2 32.5 2011 Growth 22.6% 8.8% 35.6% 51.0% 54.2% 69.8% 91.0% 2.7% 22.9% 111.1% 24.8% 14.6% 64.6% 17.7% 457.1%* 26.8% 8.1% 53.2% 37.0% 79.6% 38.9% 55.5% 68.9% 22.9% 94.3% 14.8% 81.6% 350.0% 69.8% 75.6% Industry Eurasia Capital Call Metals & Mining Metals & Mining Metals & Mining Metals & Mining Metals & Mining Metals & Mining Metals & Mining Metals & Mining Metals & Mining Beverages Metals & Mining Investments Metals & Mining Metals & Mining Investments Metals & Mining Metals & Mining Metals & Mining Metals & Mining Oil & Petrol Products Metals & Mining Metals & Mining Metals & Mining Telecommunications Metals & Mining Metals & Mining Metals & Mining Metals & Mining Metals & Mining Metals & Mining HOLD UNDER REVIEW BUY UNDER REVIEW BUY BUY BUY HOLD BUY BUY UNDER REVIEW BUY BUY UNDER REVIEW HOLD BUY BUY BUY BUY BUY HOLD HOLD UNDER REVIEW SELL HOLD UNDER REVIEW UNDER REVIEW SELL BUY UNDER REVIEW 49
  • 51.
    Mongolia Outlook 2012 World’sFastest Growing Economy 31 January 2012 IVANHOE MINES LTD Eurasia Capital Call Ivanhoe Mines Ltd (IVN) is a New York and Toronto listed international mining company with operations focused in the Asia Pacific region. Ivanhoe Mines holds a 66% interest in the world’s largest copper gold mine Oyu Tolgoi in southern Mongolia, a 58% interest in Mongolian coal miner SouthGobi Resources, an 59% interest in Ivanhoe Australia, a copper gold uranium molybdenum rhenium exploration and development company, and a 50% interest in Altynalmas Gold Ltd., a private company developing the Kyzyl Gold Project in Kazakhstan. Key Stock Data Ticker IVN:US Price (US$) 17.72 52 Wk high (US$) 28.91 52 Wk low (US$) 11.5 Market cap (US$mn) 13,095.41 Shares outstanding (mn) 739.02 Avg d'ly turn'r (US$mn) 61.43 Performance, y o y 22.7% Valuation Ratios P/E Earnings Yield P/B 3.2 ROE ROA Share Price Performance, US$ HOLD 30 25 20 15 10 5 Dec 11 Nov 11 Oct 11 Sep 11 Jul 11 Aug 11 Jun 11 Apr 11 0 May 11 In September 2011 twenty MPs and several lawmakers demanded the Coalition Government to reconsider existing agreement on the Oyu Tolgoi mine by requesting to increase Mongolia’s stake in the project to 50% from 34%. However, Rio Tinto and Ivanhoe Mines refused to accept proposed amendment to the agreement. The Coalition Government issued a joint statement with the two mining companies in which it reaffirmed its commitment to the existing investment agreement. 35 Mar 11 IVN announced in December 12, 2011 that it had received a decision regarding arbitration with Rio Tinto. The arbitrator determined that, if Rio Tinto triggers IVN’s Shareholders’ Right Plan and as a result becomes an “acquiring person”, the anti dilution rights granted to Rio Tinto in the Private Placement Agreement will nevertheless continue to apply. Moreover, the arbitrator also determined that Rio Tinto had not breached its obligations under the Private Placement Agreement. Jan 11 Rio Tinto announced on January 24, 2012 that it has increased its ownership in IVN to 51% from 49% after buying 15.1mn shares for US$298mn from two sellers. Rio Tinto stated in the press release that it has no “current intention” of buying more stock. Although Rio Tinto has no current intention to buy additional shares of IVN, it reserves its right to purchase additional IVN shares depending on various factors such as IVN’s financial condition, share prices and overall economic environment. Feb 11 Recent Developments Shareholders' Structure Growth Outlook Rio Tinto As of January, 2012 construction of the 1st phase of Oyu Tolgoi has been 70% completed with the 1st production line being expected to be finished in mid July 2012. Initial production from the Southern Oyu open pit mine is expected in mid 2012; commercial production of copper gold silver concentrate is projected to begin in the first half of 2013. Goldamere Holdings Fidelity Management Newstar Holdings 25.73% IVN possesses strong fundamentals primarily on positive outlook for commodity prices fuelled by growing demand in neighboring China and expected launch of initial production this year. Declining financing and operating risks associated with the flagship Oyu Tolgoi project with Rio Tinto becoming a majority shareholder in the Company and an operator of the project should also support the share price. Ratios and Growth Rates Net profit margin EPS (pence) Gross profit margin Sales growth rate Balance Sheet (US$mn) Current asset Fixed asset Total asset Total liabilities Shareholders' equity Total liabilities & equity 2009 2010 6.3% 2009 1,054.2 250.7 1,534.7 1,055.6 479.08 1,534.7 121% 2010 1,492.0 1,386.4 3,218.5 1,402.0 1,816.4 3,218.5 3Q 2011 12% 14.3% 27.8% 3Q 2011 1,712.7 3,494.5 5,638.8 804.9 4,833.8 5,638.8 51.07% 3.08% 4.37% Profit & Loss (US$mn) Revenue Gross profit Pretax profit Net profit Cash Flow (US$mn) Operating Cash flow Investing Cash flow Financing Cash flow Exchange gain Cash at the beginning Cash at the end Caisse De Depot ET Robert Friedland 4.99% 5.12% 5.64% Others 2009 36.0 2.3 315.5 280.2 2009 183.3 190.3 955.3 2010 79.8 2.3 298.1 211.5 2010 227.3 866.4 1,458.9 3Q 2011 60.5 8.6 18.4 7.3 3Q 2011 124.5 604.5 564.094 384.1 965.8 965.8 1,264.0 1,264.0 1,410.3 Stock data as of December 31, 2011 Source: Company data, Bloomberg, Eurasia Capital www.eurasiac.com 50
  • 52.
    Mongolia Outlook 2012 World’sFastest Growing Economy 31 January 2012 CENTERRA GOLD INC Eurasia Capital Call Centerra Gold is a Toronto listed Canadian gold producer with mining assets in Central Asia and Mongolia. In Mongolia the Company stopped production at its Boroo mine. It has been developing nearby Gatsuurt property. Key Stock Data Ticker Price (C$) 52 Wk high (C$) 52 Wk low (C$) Market cap (US$mn) Shares outstanding (mn) Avg d'ly turn'r (US$mn) Performance, y o y Valuation Ratios P/E Earnings Yield P/B ROE (3Q 2011) ROA (3Q 2011) Share Price Performance, C$ UNDER REVIEW Mining at Boroo deposit ceased at the end of November, 2010. The Boroo mill operation could potentially continue for a couple of years processing stockpile material Centerra clarified the status of its Mongolian Licenses on November 19. The Company said that it has four licenses on the list of alluvial gold mining licenses that may be revoked under the Water and Forests Law and that none of these licenses are material to the Company. Furthermore, the Company reported that the Gatsuurt hard rock mining license is not on the list of revoked alluvial licenses and it continues constructive discussions with the Government of Mongolia to resolve uncertainty and to obtain necessary approvals for the commissioning of the Gatsuurt project, which has been delayed and resulted in the laying off of 250 workers on December 1. 25 20 15 10 Shareholders' Structure 11.0% In July 2010, Centerra sold its 64% interest in the REN joint venture in Nevada for US$34.9mn to Homestake Mining Company, which is a subsidiary of Barrick Gold Corporation. 33.0% Kyrgyzaltyn Institutional Growth Outlook Retail Centerra Gold has 8.2mn ounces of proven and probable gold reserves and further 4.9mn ounces of measured and indicated resources. The company is expected to produce 640,000 660,000 ounces of gold in 2011. The long term objective is to produce 1.5mn ounces per year based on the potential of current properties and acquiring new prospective properties. Economic uncertainty and gold’s role as a hedge against inflation will continue to support demand for the precious metal. Ratios and Growth rates Net profit margin EPS (US$) EPS growth rate Sales growth rate Balance Sheet (US$mn) Current asset Fixed asset Intangible asset Total asset Current liabilities Long term liabilities Shareholders' equity Total liabilities & equity 20.0% 18.1% 2009 8.8% 0.27 (56.5%) 7.8% 2009 532.25 412.07 129.71 1,074.03 100.08 21.53 952.42 1,074.03 2010 38.1% 1.37 407.4% 23.5% 2010 718.12 548.85 129.71 1,396.68 102.30 24.89 1,269.49 1,396.68 3Q 2011 37.7% 1.23 68.5% 46.4% 3Q 2011 856.94 622.29 129.71 1,608.94 114.14 36.54 1,458.26 1,608.94 Profit & Loss (US$mn) Sales Gross profit Operating profit Pretax profit Net profit Cash Flow (US$mn) Operating Cash flow Investing Cash flow Financing Cash flow Exchange Translation Net cash flow Cash at the beginning Cash at the end 56.0% 2009 685.49 389.55 138.84 89.50 60.31 2009 245.57 (220.19) 1.94 2010 846.47 582.58 295.39 330.26 322.64 2010 271.43 (110.42) (7.18) 3Q 2011 772.38 494.17 302.35 298.70 291.47 3Q 2011 367.16 (329.33) (96.87) 27.32 149.58 176.90 153.83 176.90 330.73 (59.04) 330.73 271.69 Stock data as of December 31, 2011 Source: Company data, Bloomberg, Eurasia Capital www.eurasiac.com Dec 11 CG reports gold production of 678,941 ounces in 2010. Total cash cost at Kumtor US$411/oz and at Boroo US$611/oz 14.6 Oct 11 Update of reserves and resources in February 2011. Gold reserves increased by 1.7mn ounces to 8.2mn ounces Aug 11 In July 2011, CG announces the discovery of a significant precious and base metal deposit on its 100% owned Altan Tsagaan Ovoo property in northeast Mongolia Jun 11 Centerra becomes a supporting company of the Extractive Industries Transparency Initiative (‘EITI’) Apr 11 Flagship Kumtor mine in Kyrgyzstan achieves a continuous mining rate of 500,000t per day in 3Q 2011 Feb 11 3Q 2011 net earnings US$83.8mn or US$0.35 per share. Gold production totaled 154,936 ounces at a total cash cost of US$556 per ounce Dec 10 Recent Developments CG:CN 18.00 23.69 14.22 4,184.08 236.3 10.61 9.3% 51
  • 53.
    Mongolia Outlook 2012 World’sFastest Growing Economy 31 January 2012 MONGOLIAN MINING CORP Eurasia Capital Call Mongolian Mining Corporation (MMC) is a Hong Kong listed Mongolian owned mining company that owns and operates the Ukhaa Khudag coking coal mine located in Tavan Tolgoi coal formation in South Gobi province of Mongolia. The mine covers an area of 2,960 hectares and holds 499.9Mt of JORC compliant measured and indicated coal resources and 286.0Mt of proven and probable reserves. The Ukhaa Khudag coking coal mine is the closest to Baotou, China, a major railway hub connecting Mongolian coal to the largest steel producing provinces in China. MMC has lower operational costs than the majority of its world wide competitors due to favorable geological conditions and proximity to China. Key Stock Data Ticker 975:HK Price (HK$) 5.84 52 Wk high (HK$) 11.5 52 Wk low (HK$) 4.94 Market cap (US$mn) 2,785.96 Shares outstanding (mn) 3,705.04 Avg d'ly turn'r (US$mn) 2.85 Performance, y o y 35.6% Valuation Ratios P/E 46.4 Earnings Yield 2.2% P/B 3.7 ROE 15.6% ROA 10.3% Share Price Performance, HK$ BUY Ratios and Growth Rates Net profit margin EPS (pence) Gross profit margin Sales growth rate Balance Sheet (US$mn) Current asset Fixed asset Total asset Total liabilities Shareholders' equity Total liabilities & equity 2009 15.4% 0.34 42.3% 2009 30.1 83.2 113.2 69.4 43.8 113.2 2010 21.7% 1.91 40.8% 314.3% 2010 715.1 338.1 1,053.3 325.9 727.3 1,053.3 2Q 2011 14.6% 0.54 35.1% 55.3% 2Q 2011 509.2 1,129.7 1,638.8 894.1 744.7 1,638.8 Dec 11 Nov 11 Oct 11 Sep 11 Jul 11 Aug 11 Jun 11 Shareholders' Structure Growth Outlook Mongolian Mining Corporation’s Ukhaa Khudag coking coal mine has 499.9Mt coal, of which 57% is coking coal. In addition, company has acquired Baruun Naran coking coal deposit in 2011 enlarging its resource base (67% increase in reserves). Close proximity to China ensures increasing demand for the Company’s product. Low production costs, large scale open pit mining operations have been boosted by the completion of first module of the Coal Handling and Preparation Plant (for 5Mt of coal per year) as well as completion of two lane road to Gashuun Sukhait border. After successfully achieving production target of 7Mt in 2011, we expect the Company to reach its production targets of 10.7Mt of coal in 2012. Apr 11 MMC announced in June that the first module of the Coal Handling and Preparation Plant (CHPP) had been successfully commissioned by the state authorities. All inclusive capital expenditure for the first module of CHPP, with the capacity to process around 5Mt of coal per year, totaled approximately US$111.6mn. May 11 In June 2011, the Company acquired 100% interests in QGX Coal Ltd and its indirectly owned subsidiary Khangad Exploration LLC, the holder of mining license for the Baruun Naran coking coal deposit for a total consideration of US$464.5mn. The total consideration may be adjusted to US$950mn depending on the total proved and probable reserves and production of Baruun Naran mine. 12 11 10 9 8 7 6 5 4 Mar 11 On October, MMC has completed paved road construction between the Company's Ukhaa Khudag coking coal mine and Gashuun Sukhait border of Mongolia for its coal transport operation. Two lane heavy haul coal transport road has annual capacity of 18Mt of coal transportation. Jan 11 MMC has achieved its 2011 annual production target of 7Mt of coal by 23 December 2011, up from 3.9Mt produced in 2010. During the 4Q 2011, average monthly production reached approximately 900,000 tonnes of coal. The company aims to produce 10.7Mt of coal in 2012 and 14.7Mt in 2013. Feb 11 Recent Developments 11.80% 5.10% 3.20% 8.30% 45.30% Profit & Loss (US$mn) Revenue Gross profit Pretax profit Net profit Cash Flow (US$mn) Operating Cash flow Investing Cash flow Financing Cash flow Exchange gain Cash at the beginning Cash at the end 6.30% 20% 2009 66.98 28.3 14.4 10.3 2009 (4.0) (62.1) 62.7 (0.02) 3.79 0.37 MCS Holdings Petrovis Shunkhlai Group EBRD Kerry Holdings Ancora Capital Free float 2010 277.5 113.1 82.9 60.1 2010 69.6 (564.4) 823.5 (0.86) 0.37 328.3 2Q 2011 136.2 47.8 27.9 19.8 2Q 2011 (57.9) (184.3) 31.5 (0.5) 328.3 116.9 Stock data as of December 31, 2011 Source: Company data, Bloomberg, Eurasia Capital www.eurasiac.com 52
  • 54.
    Mongolia Outlook 2012 World’sFastest Growing Economy 31 January 2012 WINSWAY COKING COAL HOLDINGS LTD Eurasia Capital Call Winsway Coking Coal Holdings Limited is a Hong Kong listed company with branches in Hong Kong, Beijing, Singapore, Macau and Australia that is engaged in the importation and procurement of coking coal for Chinese consumers, particularly serving as an integrated platform that offers services in procurement, transportation, storage, processing and sales of coking coal. Winsway has strategically located and efficient infrastructure including cross border logistics facilities at the Sino Mongolian border crossing and strategic land reserves. These facilities involve offices, loading complex, custom supervised stockpile areas and coal testing centers, among others. Winsway procured 6.5Mt of coking coal into China in 2010. The Company also procures seaborne coal from Australia, Canada, Russia and Indonesia. Key Stock Data Ticker 1733:HK Price (HK$) 2.29 52 Wk high (HK$) 4.91 52 Wk low (HK$) 1.47 Market cap (US$mn) 1,112.53 Shares outstanding (mn) 3,773.18 Avg d'ly turn'r (US$mn) 3.38 Performance, y o y 50.9% Valuation Ratios P/E 10.65 Earnings Yield 9.4% P/B n/a ROE 11.3% ROA 5.3% Share Price Performance, HK$ Nov 11 Dec 11 Sep 11 Oct 11 Aug 11 Winsway reached a coal supply agreement with Mongolyn Alt (MAK) LLC to secure high quality supply. According to the agreement, starting from 2012 MAK will supply 3Mt per year high quality coal, and the price will be based on the market prices prevalent at the time of purchase. Jun 11 Jul 11 In October 2011, Winsway and Peabody Energy Corporation entered into MOU to expand the existing business relationship between the two companies. Further, in December Peabody purchased a 5% stake in Winsway through the Hong Kong Stock Exchange. Peabody Winsway Resources LLC, a coal exploration joint venture between the companies, was successfully sold to C @ Limited (currently Draig Resources) for US$7.67mn. 5 4.5 4 3.5 3 2.5 2 1.5 1 Apr 11 May 11 In November 2011, Winsway and Japan’s Marubeni Corporation agreed to acquire Canadian metallurgical coal producer Grande Cache Coal Corp for about US$1bn. The deal is subject to approval from majority of Grand Cache shareholders by February 2012. Jan 11 The company has been the subject to allegations by an unknown research house regarding the inventories, however, the management has made sufficient efforts to respond to conference calls and has denied the allegations. Feb 11 Mar 11 Recent Developments UNDER REVIEW Shareholders' Structure The company issued US$500mn 5 year 8.5% notes with semi annual payments in April, 2011. Growth Outlook Winsway procures over 50% of the Mongolian Coal exports into China, and is the largest coking coal off taker in Mongolia. The sources for growth will come from the significant increase in coal exports from Mongolia into China as the development of Tavan Tolgoi progresses and Chinese demand for coking coal is expected to grow. The major coal players Mongolia Mining Corp., SouthGobi Resources have agreements with the company. 1% 5% 4% 6% 5% 36% 43% Winsway Resources Holding Winsway Intl Petrole Peabody Energy Corp. Winstar Capital Group Goldman Sachs Group Yong Cui Other Shareholders The company expressed its intention to proceed with the plans of Grande Cache purchase. However, this may have contributed to the price volatility/decline in the short run as Winsway may now be exposed to additional uncertainties. Ratios and Growth Rates Net profit margin EPS(HK$) EPS growth rate Sales growth rate Balance Sheet (HK$mn) Current asset Fixed asset Total asset Current liabilities Long term liabilities Shareholders' equity Total liabilities & equity 2009 9.3% 0.250 92.3% 373% 2009 3,951 447 4,498 3,354 1,144 4,498 2010 10.0% 0.352 38.4% 75.5% 2010 7,662 474 9,123 2,418 160 6,545 9,123 2Q 2011 12.1% 0.215 n/a n/a 2Q 2011 12,881 646 15,409 4,236 3,972 7,201 15,409 Profit & Loss (HK$mn) Sales Gross profit Pretax profit Net profit Cash Flow (HK$mn) Operating Cash flow Investing Cash flow Financing Cash flow Exchange gain Net cash flow Cash at the beginning Cash at the end 2009 5,283 961 561 491 2009 (353) (647) 1,165 0 165 112 277 2010 9,272 2,118 1,180 929 2010 47 (1,056) 3,569 57 2,560 277 2,894 2Q 2011 6,705 1,418 1,057 811 2Q 2011 687 (681) 2,993 78 2,791 2,894 5,763 Stock data as of December 31, 2011 Source: Company data, Bloomberg, Eurasia Capital www.eurasiac.com 53
  • 55.
    Mongolia Outlook 2012 World’sFastest Growing Economy 31 January 2012 SOUTHGOBI RESOURCES LTD Eurasia Capital Call SouthGobi Resources (SGQ) is a Hong Kong listed company engaged in coal mining in Mongolia. The company owns three coal projects in Mongolia: company’s producing flagship mine Ovoot Tolgoi, and two development projects, the Soumber Deposit and Ovoot Tolgoi Underground Deposit. SGQ controls 12 exploration licenses in southern Mongolia. Currently, SGQ produces three coal products: semi soft coking coal, medium ash coal (screened) and a higher ash/sulphur coal (screened) at Ovoot Tolgoi mine and plans to produce a hard coking coal at Soumber. Key Stock Data Ticker Price (C$) 52 Wk high (C$) 52 Wk low (C$) Market cap (US$mn) Shares outstanding (mn) Avg d'ly turn'r 6M (US$mn) Performance, y o y Valuation Ratios P/E Earnings Yield P/B ROE ROA Share Price Performance, C$ BUY Ratios and Growth Rates Net profit margin EPS (pence) Gross profit margin Sales growth rate Balance Sheet (US$mn) Current asset Fixed asset Total asset Total liabilities Shareholders' equity Total liabilities & equity 2009 2010 3Q 2011 92.4% 18.4% 1053% 2009 409.2 91.6 560.7 563.5 2.80 560.7 2.9% 121% 2010 575.9 293.1 961.9 282.9 678.89 961.9 34.0% 817.% 3Q 2011 394.4 500.9 954.9 213.6 741.30 954.9 Shareholders' Structure IVANHOE MINES LTD/CA LAND BREEZE II SARL DWS INVESTMENT SA 21.7% 4.9% Profit & Loss (US$mn) Revenue Gross profit Pretax profit Net profit Cash Flow (US$mn) Operating Cash flow Investing Cash flow Financing Cash flow Exchange gain Cash at the beginning Cash at the end 57.7% 13.8% TD ASSET MANAGEMENT FIDELITY MANAGEMENT Others 2009 36.0 6.6 86.2 110.8 2009 35.2 105.1 487.3 2010 79.8 2.3 118.9 116.2 2010 57.8 217.7 410.2 3Q 2011 60.5 20.6 56.8 55.9 3Q 2011 18.8 45.7 12.4 10.3 357.3 357.3 492.0 492.0 205.8 Stock data as of December 31, 2011 Source: Company data, Bloomberg, Eurasia Capital www.eurasiac.com Dec 11 Oct 11 Nov 11 Sep 11 Jul 11 Aug 11 In 2011 Mongolia overtook Australia as the largest coking coal exporter to China. We estimate that in 2011 Mongolia met approximately 38% of China’s coking coal imports demand. SGQ will be one of the players in Mongolia who will benefit from growing demand in China for high quality coking coal. In early 2012 the company is expected to complete construction of wet washing plant which provides an annual wet washing capacity of approximately 3.5Mt of input raw coal. Raw higher ash and medium ash coals from the Ovoot Tolgoi mine will be washed at this facility and washed coal will generally meet semi soft coking coal specifications. Moreover, to further add value to the products, SGQ commenced construction of a basic coal handling facility including dry air separation. The coal handling facility will remove ash (waste rock) and enable the blending of coals from different seams to create higher value products. Initially two dry air separation modules will be included in the facility with combined capacity to process 6Mt a year. Capital expenditure for the coal handling facility is US$45mn and completion is scheduled for early 2012. We believe that with strong demand from China and SGQ’s plans to increase shareholders value by enhancing product value will put the company into strong position to capitalize on China’s demand and realize strong revenues in 2012. Jun 11 Growth Outlook 29.1 3% 1.6 18 16 14 12 10 8 6 4 2 0 Apr 11 In March 2011, SGQ announced updated NI 43 101 compliant coal Resources and Reserves for its Ovoot Tolgoi Complex prepared by Minarco MineConsult. Measured and Indicated Resources increased approximately 7% to 266Mt while Inferred Resources surged approximately 190% to 97.1Mt of coal. May 11 On July 6, 2011 the company received mining license (MV 016869) for the Soumber Deposit. The deposit is about 20km east of Ovoot Tolgoi mine and contains NI 43 101 compliant 61.4Mt of Measured and Indicated resources and 65.8Mt of inferred resources. Jan 11 SGQ announced on January 18, 2012 that in 2011 it has produced 4.57Mt (up +64% y o y) of coal and sold 4.02Mt (up +58% y o y) to China. In 2012 the Company plans to produce 6.5 7Mt of ROM coal with salable product reaching up to 5.5Mt. Feb 11 Mar 11 Recent Developments 1878:HK 6.00 16.64 5.54 1,066.21 181.81 0.52 50.7% 54
  • 56.
    Mongolia Outlook 2012 World’sFastest Growing Economy 31 January 2012 MONGOLIA ENERGY CORP LTD Eurasia Capital Call Mongolia Energy Corporation (MEC) is a Hong Kong listed energy and resource developer operating in Mongolia and China. Main assets including coal, ferrous and non ferrous metals concessions are located in western Mongolia. The company is focused on developing the 600ha Khushuut coal mine in Mongolia. Key Stock Data Ticker Price (HK$) 52 Wk high (HK$) 52 Wk low (HK$) Market cap (US$mn) Shares outstanding (bn) Avg d'ly turn'r (US$mn) Performance, y o y Valuation Ratios P/E Earnings Yield P/B ROE (2011) ROA (2011) Share Price Performance, HK$ BUY Growth Outlook MEC controls 336,506ha of concession areas in western Mongolia. It is focused on 600ha Khushuut mine. We expect commercial production at Khushuut to start in 2012. The mine has about 141.5mn tonnes of JORC compliant coal resources. The company is targeting fast growing Xinjiang region of China for its coking coal. Demand for coking coal is expected to grow from 15.8Mt in 2010 to 25 30Mt in 2015. MEC is positioned well to supply coking coal to Xinjiang market. It is planning to produce 8Mt/annum in the next couple of years. 2 1.5 1 0.5 Dec 11 Oct 11 Nov 11 Sep 11 Jul 11 Aug 11 0 Jun 11 4Q 2010 MEC commenced trial production and has since continued to ship batches of raw coking coal to Baosteel Bayi. 3 Apr 11 In May 2011, MEC issued HK$2bn 3% coupon convertible note due 2014. The proceeds to be used to redeem the 2008 Note in full. Conversion price is set at HK$2.00 per conversion share 0.3 2.0% 1.6% 2.5 May 11 The company disclosed that Mongolian Government temporary suspended two mining licences of about 525ha situated 85km southeast of Khushuut mine due to company not fully meeting the filing requirement of geological information. One exploration licence for 1,415ha area located 4km south of Khushuut is expected to expire in 2012. No substantial value has been assigned to the licences and there is no material impact on company asset value and operation, according to MEC Mar 11 Interim report for September, 2011 revealed net income HK$183.71mn for the period. It was due to a HK$390 fair value gain on convertible notes caused by decline in MEC’s share price and FX gain Jan 11 Feb 11 MEC completed construction of the 311km paved Khushuut Road in November 2011. The road connects Khushuut mine to Yarant (Mongolia side) and Takeshensken border (Xinjiang side). Mongolian Government approved the use of the road for coal transportation. The paved road shortens travel time to the border from 8 to 4 hours Dec 10 Recent Developments 276:HK 0.70 2.54 0.46 595.45 6.61 4.23 69.8% Shareholders' Structure Mr. Lo 19.5% 46.8% Recent Interim Report 2011 disclosed that run of mine Khushuut coal contains 40% ash. Ash could be reduced to 27% with dry screening the company reported. The company needs funds for coal processing facilities and further exploration activities. Dr. Cheng 6.0% Golden Infinity Dato Dr. Cheng 18.1% Dragon Noble Public 4.8% 4.9% In our view, the company equity was oversold in 2011. With the start of coal output in 2012, the upside may prove significant. Ratios and Growth rates Net profit margin EPS (HK cents) EPS growth rate Sales growth rate Balance Sheet (HK$mn) Current assets Fixed assets Intangible assets Total assets Current liabilities Long term liabilities Shareholders' equity Total liabilities & equity 2009 n/a (5.22) n/a n/a 2009 334.25 14,835.70 0.88 15,169.95 311.18 1,709.80 13,148.97 15,169.95 2010 n/a (5.02) n/a n/a 2010 111.04 15,796.22 1.11 15,907.26 2,131.21 701.90 13,074.16 15,907.26 2Q 2011 n/a (2.70) n/a n/a 2Q 2011 76.46 16,050.09 0.74 16,126.55 463.18 2,403.77 13,259.60 16,126.55 Profit & Loss (HK$mn) Sales Gross profit Operating profit Pretax profit Net profit Cash Flow (HK$mn) Operating Cash flow Investing Cash flow Financing Cash flow Exchange Translation Net cash flow Cash at the beginning Cash at the end 2009 n/a n/a (273.63) (248.52) (286.38) 2009 (162.13) (383.90) 0.21 6.22 (545.81) 660.89 121.30 2010 n/a n/a (381.12) (310.75) (261.60) 2010 (193.54) (606.42) 682.35 6.49 (117.61) 121.30 10.18 2Q 2011 n/a n/a (203.44) 178.35 183.71 2Q 2011 (63.98) (248.5) 317.3 (5.20) 4.80 10.18 9.78 * Financial year ends March 31. Stock data as of December 31, 2011 Source: Company data, Bloomberg, Eurasia Capital www.eurasiac.com 55
  • 57.
    Mongolia Outlook 2012 World’sFastest Growing Economy 31 January 2012 TAVAN TOLGOI JSC Eurasia Capital Call Tavan Tolgoi JSC (TTL) is one of the largest coal producers and exporters in Mongolia. TTL’s mine is located 250km north of China. The local administration owns 51% of the Company and around 4% of shares are on free float. TTL’s 270ha license area is located within 6.4Bt Tavan Tolgoi coking coal deposit area. The Company started exporting coking coal to China in 2004. In line with our expectations, TTL increased its coal production to 6.1Mt in 2011 from 5.2Mt in 2010. TTL employs about 200 people. Key Stock Data Ticker TTL:MO Price (MNT) 11,000 52 Wk high (MNT) 14,390 52 Wk low (MNT) 5,760 Market cap (US$mn) 415.3 Shares outstanding 52,665,200 Avg d'ly turn'r (MNTmn) 18.2 Performance, y o y 91.0% Valuation Ratios P/E (2011e) 7.2 P/E (2012f) 6.4 P/B (3Q 2011) 5.8 ROE (3Q 2011) 69.9% ROA (3Q 2011) 53.5% Share Price Performance, MNT BUY The Company produces high quality coal with a calorific value of 6,500 7,500 kcal/kg, with ash content of below 20% and sulfur content of 0.5%. Coking coal makes up to 60% of the deposit, according to the Company. Currently, there is no independent verification of reserves. Recent Developments In 2011, the Company drilled 14 holes in its license area for detailed reserve estimate and the laboratory data is expected to be received in a few months. TTL expects the reserve will be about 90Mt. 15,000 12,000 9,000 6,000 Nov 11 Jul 11 Sep 11 May 11 Jan 11 Mar 11 Nov 10 Jul 10 TTL is considering to install a coal conveyer system as its open pit is reaching 60m depth. The Company also had preliminary negotiations with Chinese and US investors on the construction of a coal washing plant. TTL projects that the conveyer system and washing plant will be built within the next five years. Jan 10 The Company is preparing new feasibility study on increasing annual capacity to 8Mt. Sep 10 3,000 May 10 TTL’s coal output increased at CAGR 50% during 2006 2011, reaching 6.1Mt. China is the primary market, accounting for over 98% of TTL’s sales. During the past five years, sales grew more than 20 times and net profit increased more than 15 times. Total sales are estimated to reach MNT190bn and net income MNT80bn for 2011. We expect coal exports to increase by another 1Mt to 7Mt in 2012. Mar 10 Growth Outlook Shareholders' Structure Currently, TTL sells its coal at mine gate with a discount. We see considerable upside potential in sales revenue and earnings as the Company realizes higher prices for its product in the coming years. 4.0% Provincial Administration 21.0% Ajnai Corporation 51.0% Eermel JSC 24.0% Other Shareholders Ratios and Growth rates Net profit margin EPS (MNT) EPS growth rate Sales growth rate Balance Sheet (MNTmn) Current asset Fixed asset Intangible asset Total asset Current liabilities Long term liabilities Shareholders' equity Total liabilities & equity 2009 45% 81,178 165% 100% 2009 58,894 4,885 56 58,835 5,919 2010 45% 145,306 79% 77% 2010 111,825 6,669 68 118,562 18,900 3Q 2011 44% 1,323 nm nm 3Q 2011 123,866 6,219 81 130,166 30,403 52,917 58,835 99,662 118,562 99,763 130,166 Profit & Loss (MNTmn) Sales Gross profit Operating profit Pretax profit Net profit Cash Flow (MNTmn) Operating Cash flow Investing Cash flow Financing Cash flow Exchange gain Net cash flow Cash at the beginning Cash at the end 2009 95,436 55,497 55,030 56,495 42,753 2009 22,475 (21) (6,433) (347) 15,674 5,024 20,697 2010 170,469 107,504 106,850 102,510 76,526 2010 95,922 (85) (19,933) (4,347) 71,557 20,697 92,255 3Q 2011 157,823 93,323 92,643 92,472 69,701 3Q 2011 2,114 (47,886) (935) (46,706) 92,255 45,549 Stock data as of December 31, 2011 Source: MSE, Eurasia Capital www.eurasiac.com 56
  • 58.
    Mongolia Outlook 2012 World’sFastest Growing Economy 31 January 2012 GUILDFORD COAL LTD Eurasia Capital Call Guildford Coal (GUF) is an ASX listed exploration company with coal assets in Mongolia and Australia. The company was listed on ASX in July 2010 and at that time the company held coal assets only in Australia. The company’s Australian coal assets include Hughenden, Sierra, Kolan, Sunrise and Monto exploration projects located in Queensland. In March 2011 the company announced the partial acquisition of Terra Energy LLC, a Mongolian based company that holds coking and thermal coal exploration licenses in the South Gobi and Middle Gobi provinces in Mongolia. The company’s South Gobi Project is located approximately 50 km east of two operating mines, Qin Hua MAK’s Nariin Sukhait mine and Southgobi Resources’ Ovoot Tolgoi mine which are located approximately 40km from the Mongolian Chinese border. The Middle Gobi project is located approximately 200km south of Ulaanbaatar and over 200km west from the Mongolian railway line. Key Stock Data Ticker Price (A$) 52 Wk high (A$) 52 Wk low (A$) Market cap (US$mn) Shares outstanding (mn) Avg d'ly turn'r (US$mn) Performance, y o y Valuation Ratios P/E P/E (2012f) P/B ROE ROA Share Price Performance, A$ HOLD 1.2 1.0 0.8 0.6 15.09% 5.87% 46.46% 9.29% 11.19% 12.10% Ratios and Growth Rates Net profit margin EPS (A$cents) EPS growth rate Sales growth rate Balance Sheet (A$’000) Current asset Fixed asset Intangible asset Total asset Current liabilities Long term liabilities Shareholders' equity Total liabilities & equity 2009 n/a n/a n/a n/a 2009 n/a n/a n/a n/a n/a n/a n/a n/a 2010 n/a n/a n/a n/a 2010 n/a n/a n/a n/a n/a n/a n/a n/a 2011 n/a (1.23) n/a n/a 2011 34,889 89,145 124,034 12,057 111,977 124,034 Nov 11 Dec 11 Shareholders' Structure Growth Outlook The relentless economic growth in China and other emerging markets around the world are creating increased demand for various commodities such as coal among others and expected to continue to do so in coming decades. As global engine of economic growth is shifting towards China and Asia resource companies such as Guildford Coal are poised to take advantage of this growth. Sep 11 Oct 11 Aug 11 Jun 11 Jul 11 0.4 Apr 11 May 11 In late December 2011, the company announced that it intersected significant coal seams with an interpreted 13.4m of net coal from the Permian Betts Creek Beds across 3 main seams between 242m and 281m depth, which forms part of the company’s White Mountain Project in Australia. n/a n/a 2.6 4.3% 3.9% 1.4 Jan 11 In August 2011, the company’s subsidiary Terra Energy LLC completed acquisition of 100% stake in Alag Tevsh LLC which holds coal exploration license in Gobi region for US$3.5mn. According to the company’s statement the independent geologists developed exploration target of up to 122Mt of coal on the area under the license. In September 2011, the company increased its ownership stake in FTB Pty Ltd from 80% to 100%. FTB controls a 100% interest in a number of tenements which makes up approximately 60% of the Hughenden coal project (in Australia) by area. In October, the company announced maiden JORC resource of 925Mt Hughenden project. Furthermore, the company announced maiden JORC resources of 63.1Mt and 221Mt in South Gobi and Middle Gobi projects in Mongolia. Feb 11 Mar 11 Recent Developments GUF:AU 0.75 1.37 0.62 316.3 413.5 1.1 2.74% Profit & Loss (A$’000) Sales Gross profit Operating profit Pretax profit Net profit Cash Flow (A$’000) Operating Cash flow Investing Cash flow Financing Cash flow Exchange gain Net cash flow Cash at the beginning Cash at the end 2009 n/a n/a n/a n/a n/a 2009 n/a n/a n/a n/a n/a n/a n/a Thechairmen1 Pty Och Ziff Capital Management Regal Funds Management Springsure Mining Credit Suisse Other shareholders 2010 n/a n/a n/a n/a n/a 2010 n/a n/a n/a n/a n/a n/a n/a 2011 (5,924) (3,794) (4,837) 2011 (3,000) (16,754) 53,524 (1.1) 33,769 33,768 * Financial year ends June 30. Stock data as of December 31, 2011 Source: Bloomberg, Eurasia Capital www.eurasiac.com 57
  • 59.
    Mongolia Outlook 2012 World’sFastest Growing Economy 31 January 2012 ASPIRE MINING LTD Eurasia Capital Call Aspire Mining Limited (AKM) is an early exploration company with a primary focus on Mongolia. Aspire owns 100% of the Ovoot Coking Coal project, the Nuramt project, the Jilchigbulag Coal project, and 70% of the Zavkhan Iron Ore project. Aspire Mining also holds a 49% stake in the Windy Knob gold and base metal project in Western Australia. Key Stock Data Ticker Price (A$) 52 Wk high (A$) 52 Wk low (A$) Market cap (US$mn) Shares outs (mn) Avg d'ly turn'r (US$mn) Performance, y o y Valuation Ratios P/E Earnings Yield P/B ROE ROA Share Price Performance, A$ BUY Recent Developments The Ovoot Coking Coal Project with 330Mt of JORC coal resources, 80% of which is measured and indicated coal, has been the primary activity of Aspire during 2011. The company completed the 2011 drilling program with additional 94 holes for 17,700 meters, and expects 16,500meters of drilling throughout 2012. The Ovoot Basin is about 550km east of Erdenet and the Nuramt Project is located almost linearly from Ovoot to the Erdenet rail link, providing good transportation potential. 0.8 0.6 0.4 Strong cash position (96% cash of current assets not including subsequent financing and 2.7x of net losses in 2011), upside potential to increase the JORC compliant resources of the Ovoot project (as only 20% of the license area drilled) will support growth. AKM plans to announce upgraded resource and reserve estimate in March 2012. Coal analysis demonstrated high indicative yields from washing the coal, with the washed product being a high vitrinite and low ash coking coal. The company also plans to conduct additional work on the other projects. AKM plans to develop the Ovoot Project in 2 Stages. In Stage 1, starting from 2013 we expect that the company would truck annually 0.5Mt to 1Mt of coking coal from the Ovoot Project to the Erdenet rail station in Mongolia from where it plans to ship via railway to customers in Russia and in Asia Pacific region. In Stage 2, we expect that the company completes railway construction by 2018 and reach full production capacity of 12Mt of high quality washed premium coking coal by 2020. We estimate that the total capital expenditure including railway infrastructure (US$1.1bn) and washing plant (US$336mn) will be about US$1.5bn. Ratios and Growth Rates Net profit margin Loss per share (AUS¢) Loss per share growth rate Sales growth rate Balance Sheet (A$'000) Current asset Long term asset Total asset Current liabilities Long term liabilities Shareholders' equity Total liabilities & equity 2009 n/a (0.51) n/a n/a 2009 1,043.2 1,149.1 2,192.4 48.4 2010 n/a (0.40) (21.6%) n/a 2010 5,765.3 11,521.7 17,286.9 3,679.7 2011 n/a (0.93) 132.5% n/a 2011 12,520.8 16,685.9 29,206.8 891.9 2,143.9 2,192.4 13,607.3 17,286.9 28,314.9 29,206.8 Profit & Loss (A$'000) Sales Gross profit Pretax profit Net profit Cash Flow (A$'000) Operating Cash flow Investing Cash flow Financing Cash flow Exchange gain Net cash flow Cash at the beginning Cash at the end Nov 11 Dec 11 Sep 11 Oct 11 Aug 11 Growth Outlook Jun 11 Jul 11 0.2 Apr 11 May 11 In April 2011, Aspire confirms high quality of raw coking coal from its 2010 drilling program with 19.5% ash, 1.2% sulfur, 26.5% volatile matter, and 6,668 kcal/kg. Later in June, following wash yield analysis AKM raises its coking coal production target from 10.5Mtpa to 12Mtpa. 1 Jan 11 AKM raised AUS$32.5mn via institutional placement, and the proceeds to be used for exploration at Ovoot, completion of feasibility studies, and working capital. n/a n/a 6.8 (15.9%) (15.4%) 1.2 Feb 11 Mar 11 AKM and Noble Group, one of the world’s largest commodity trader and logistics companies, have entered into an Alliance Agreement on marketing and logistics on Ovoot. Noble has acquired just over 8% stake in AKM in several transactions in 2011. AKM:AU 0.34 1.14 0.275 235.48 620.59 0.64 22.9% Shareholders' Structure AKM Directors 30% 20% SouthGobi Resources Ltd. 5% Noble Group Mongolian Vendors 17% 28% Others 2009 2010 2011 (358.5) (5,263.2) 2009 (554.1) (1,966.6) 1,231.5 (879.4) (879.4) 2010 (251.9) (2,043.9) 6,953.2 (1,289.2) 2,297.3 1,008.1 4,657.3 1,008.1 5,665.4 (4,490.1) (4,490.1) 2011 (2,517.0) (10,851.7) 19,881.2 (156.5) 6,512.5 5,665.4 12,021.3 * Financial year ends June 30. Stock data as of December 31, 2011 Source: Company data, Bloomberg, Eurasia Capital www.eurasiac.com 58
  • 60.
    Mongolia Outlook 2012 World’sFastest Growing Economy 31 January 2012 APU JSC Eurasia Capital Call APU (APU) is the largest alcoholic beverage company in Mongolia. Established in 1924, APU was one of the first companies privatized in the 1990s. The Company produces spirits, vodka, beer, pure water, soft drinks and milk and holds over 50% of the market share for beer and vodka. APU’s current beer factory capacity is 50mn liters per year, with utilization close to 100%. The Company supplies drinking water (approx. 7 8 tonnes per day) to Oyu Tolgoi, the world’s largest untapped copper gold mine currently being developed by Ivanhoe Mines. Key Stock Data Ticker APU:MO Price (MNT) 4,200 52 Wk high (MNT) 4,200 52 Wk low (MNT) 1,990 Market cap (US$mn) 223.7 Shares outstanding 74,287,700 Avg d'ly turn'r (MNTmn) 28.0 Performance, y o y 111.1% Valuation Ratios P/E (2011e) 12.8 P/E (2012f) 11.1 P/B (3Q 2011) 4.7 ROE (3Q 2011) 28.8% ROA (3Q 2011) 16.4% Share Price Performance, MNT BUY 4,000 3,000 2,000 Nov 11 Jul 11 Sep 11 May 11 Jan 11 Mar 11 Nov 10 1,000 Jul 10 We believe the outlook for APU in 2012 is positive. The main drivers of growth are internal factors of its expertise it holds in the beverages market, modern production facilities, investments made to expand capacity, growing profits and efficient distribution network with over 6000 outlets, and the market (external) factor of strong demand. 5,000 Sep 10 As of 3Q 2011, the Company generated MNT19.7bn profit, and we estimate the total 2011 profit meets our estimate of MNT24.4bn. The increased profit will provide the Company with much flexibility to expand its activities further in beverage production and to other fields. May 10 There is high demand for beverages and branded alcoholic drinks in Mongolia. Domestic demand is expected to increase further thanks to rapid growth in income. Jan 10 Growth Outlook Mar 10 APU currently exports its products to South Korea, Japan, Germany and plans to export its products to the U.S.A., Europe and Asia. The Company has already registered the "Chinggis Khan" vodka trademark in the U.S.A. and Europe. Shareholders' Structure 8% Management Other Shareholders 92% Ratios and Growth Rates Net profit margin EPS (MNT) EPS growth rate Sales growth rate Balance Sheet (MNTmn) Current asset Fixed asset Intangible asset Total asset Current liabilities Long term liabilities Shareholders' equity Total liabilities & equity 2009 9% 109 209% 162% 2009 36,159 35,683 17 71,858 29,040 10,742 32,077 71,858 2010 16% 265 144% 41% 2010 37,564 58,963 4 96,531 19,454 27,093 49,985 96,531 3Q’11e 16% 256 nm nm 3Q 2011 60,266 55,714 3 115,983 28,894 21,033 66,056 115,983 Profit & Loss (MNTmn) Sales Gross profit Operating profit Pretax profit Net profit Cash Flow (MNTmn) Operating Cash flow Investing Cash flow Financing Cash flow Exchange gain Net cash flow Cash at the beginning Cash at the end 2009 86,867 19,806 13,341 10,818 8,070 2009 7,018 (81) 6,875 (298) (237) n/a 1,663 2010 122,132 36,406 24,191 25,816 19,717 2010 7,889 21 396 17,177 (257) 3,412 1,663 5,075 3Q’11e 117,976 35,167 23,368 24,938 19,046 3Q 2011 n/a n/a n/a n/a n/a n/a n/a Stock data as of December 31, 2011 Source: MSE, Eurasia Capital www.eurasiac.com 59
  • 61.
    Mongolia Outlook 2012 World’sFastest Growing Economy 31 January 2012 BAGANUUR JSC Eurasia Capital Call Baganuur (BAN) is the largest supplier of coal to the Mongolian domestic market, supplying approximately 50% of total demand. BAN supplies 100% of demand to Mongolia’s Thermal Power Plant (TPP) 2 and TPP 3 and 50% of demand to TPP 4, Erdenet TPP and Darkhan TPP. The total initial estimated resources are 600Mt of coal with a calorific value of 3,000 3,600kcal/kg. So far, the Company exploited over 80Mt from the deposit. Key Stock Data Ticker BAN:MO Price (MNT) 13,100 52 Wk high (MNT) 41,780 52 Wk low (MNT) 9,000 Market cap (US$mn) 197.0 Shares outstanding 20,974,360 Avg d'ly turn'r (MNTmn) 39.7 Performance, y o y 24.8% Valuation Ratios P/E (3Q11) nm P/E (2011e) nm P/B (3Q 2011) nm ROE (3Q 2011) nm ROA (3Q 2011) 6.1% Share Price Performance, MNT UNDER REVIEW In 1996 2004, the Mongolian Government implemented a project to modernize and expand production of the mine using long term loans of US$31.1mn and US$19.8mn from the World Bank and the Japanese Government, respectively. As a result of the project, exploitation capacity reached 4Mt per year. Since, the Company has been extracted about 3Mt of coal per year depending on demand and operational constraints. It is estimated that BAN produced 3.4Mt in 2011. 75% of the Company is owned by the Government and less than 10% is on free float. As the Company sells the coal at state controlled price, it wasn’t able to generate profit from its operations in the past. However, lately the fact that the Company has disputes with other legal entities in the Baganuur deposit license areas has been revealed. No detailed information from the Company creates much uncertainty on the BAN’s future, and we view that the fact had an influence on BAN share performance in the past few months. Recent Developments 50,000 40,000 30,000 20,000 Nov 11 Jul 11 Sep 11 May 11 Jan 11 Mar 11 Nov 10 Jul 10 Sep 10 May 10 Jan 10 Mar 10 10,000 BAN was included in the 2012 Privatization Plan approved by the Mongolian Parliament in 2010. The Government plans to further privatize 24% of the Company by offering additional shares while retaining a 51% controlling stake. Accordingly, in October 2011, BAN announced the tender offer to choose technical and financial advisors for the assessment of other project developments including coal to liquid, power plant and for the additional share offering. Shareholders' Structure Growth Outlook According to the last information, BAN will supply 30% of the coal consumption of the planned TPP 5. We estimate that BAN’s production volume will increase gradually until the TPP is built, and as the TPP became fully operational by 2016 additional 1Mt coal will be required from BAN. We view that BAN will remain as the most important player in the domestic thermal coal market for a long. 10.7% State 14.3% Firebird Management Other Shareholders 75.0% The vitally important factor for BAN’s future is coal price. Though, in 2010, the Parliament ordered the Government to implement a policy to shift energy sector companies to a market economy principal by 2014, it remained unclear that whether coal price will be liberalized from the state control. If the additional offering will succeed, the private ownership percentage of the Company will increase up to 49%, which we believe that give power to the private owners to have influential voice regarding coal price deregulation to the state. Ratios and Growth Rates Net profit margin EPS (MNT) EPS growth rate Sales growth rate Balance Sheet (MNTmn) Current asset Fixed asset Intangible asset Total asset Current liabilities Long term liabilities Shareholders' equity Total liabilities & equity 2009 18% (435) nm 15% 2009 31,272 43,584 617 75,472 13,346 78,778 (16,652) 75,472 2010 13% 386 nm 26% 2010 32,886 48,478 2011e nm (241) nm 10% 3Q 2011 35,740 47,531 81,364 10,261 67,402 3,701 81,364 83,272 20,680 76,196 (13,604) 83,272 Profit & Loss (MNTmn) Sales Gross profit Operating profit Pretax profit Net profit Cash Flow (MNTmn) Operating Cash flow Investing Cash flow Financing Cash flow Exchange gain Net cash flow Cash at the beginning Cash at the end 2009 49,483 5,256 701 (9,121) (9,121) 2009 (3,468) 2010 62,546 7,242 (1,121) 8,112 8,093 2010 1,892 3,220 35 (213) 2,303 2,090 (2,350) (730) 2,090 1,359 2011e 68,801 7,966 (1,233) (8,000) (8,000) 2011e n/a n/a n/a n/a n/a n/a n/a Stock data as of December 31, 2011 Source: MSE, Eurasia Capital www.eurasiac.com 60
  • 62.
    Mongolia Outlook 2012 World’sFastest Growing Economy 31 January 2012 ORIGO PARTNERS PLC Eurasia Capital Call Origo Partners Plc. is a private equity investment company listed on the London Stock Exchange. The primary focus of the company is China linked core economic growth opportunities. In December 2009, the company formerly known as Origo Sino India Plc. was reorganized and became Origo Partners Plc. after combining its asset manager and its managed fund, Origo Resource Partners. Unaudited net asset value (NAV) of the Company’s portfolio was US$215.4mn as of 30 September 2011, with the majority of assets being in resources or resource development. Key Stock Data Ticker OPP:LN Price (GBp) 35 52 Wk high (GBp) 54.125 52 Wk low (GBp) 25.75 Market cap (US$mn) 195.5 Shares outstanding (mn) 360.17 Avg d'ly turn'r (US$’000) 334 Performance, y o y 14.6% Valuation Ratios P/E 10.1 Earnings Yield 9.9% P/B 0.9 ROE 10.1% ROA 8.6% Share Price Performance, GBp BUY Shareholders' Structure Lansdowne Partners 17% Ecofin 12% Growth Outlook GLG Partners As of September 30, 2011 Origo’s net asset value stood at US$215.4 compared with US$165.4mn a year earlier. The Company has successfully raised US$60mn and US$32.5mn through issue of preferred and common shares during 2011. Although Origo’s Mongolian investments in Kincorra Copper and Gobi Coal were successful, investments in some Chinese companies underperformed. We expect that growth in NAV of Origo’s portfolio will originate from Mongolian investments. Completion of exploration work in prospects owned by Origo’s portfolio companies as Huremtiin Hyar, Moly World and Kincora Copper has potential to significantly increase the NAV. Ratios and Growth Rates Net profit margin EPS (cents) Gross profit margin Revenue growth rate Balance Sheet (US$mn) Current asset Fixed asset Total asset Total liabilities Shareholders' equity Total liabilities & equity 2009 n/a 37.93 46% (23%) 2009 28.7 105.8 134.5 2.5 132.0 134.5 2Q 2010 n/a 0.9 50% 65% 2Q 2010 51.1 114.6 165.7 3.2 162.5 165.7 2Q 2011 n/a 5.9 51% 11% 2Q 2011 55.7 228.2 283.9 58.8 225.1 283.9 Profit & Loss (US$mn) Revenue Gross profit Pretax profit Net profit Cash Flow (US$mn) Operating Cash flow Investing Cash flow Financing Cash flow Exchange gain Cash at the beginning Cash at the end 10% F&C Asset Mgt. F&C Fund Mgt. 8% 26% 7% 3% 4% 4% 5% 5% Morgan Stanley Soros LLC Credit Suisse TT International Inv JP Morgan Asset Mgt. Others 2009 3.7 1.7 39.5 38.9 2009 (0.4) 6.3 (1.2) 1.4 19.0 25.0 2Q 2010 1.4 0.7 2.0 2.0 2Q 2010 (1.9) (5.4) 29.5 0.2 25.0 47.4 2Q 2011 1.3 0.6 19.4* 19.3* 2Q 2011 (0.6) (39.1) 57.3 0.9 33.4 51.9 *After revaluation of investments. Stock data as of December 31, 2011 Source: Company data, Bloomberg, Eurasia Capital www.eurasiac.com Dec 11 Fair value, $mn $67,0 $12,6 $10,0 Nov 11 Cost, $mn $15,0 $4,6 $10,0 Oct 11 Ownership 17,9% 33,2% 20,0% Sep 11 # Company Sector 1 Gobi Coal & Energy Mining 2 Kincora Copper Mining 3 Moly World Mining Source: Company announcements Jan 11 Largest holdings in Mongolia, November 2011 Jul 11 In March 2011, the Company completed capital raise of US$60mn, by placing new convertible preference shares at a price of $1.00 each. Earlier, Origo informed that it had commitment from Spearpoint Limited to subscribe for US$60mn. 55 50 45 40 35 30 25 20 Aug 11 In July, Origo completed listing of Kincora Copper through reverse take over of Toronto listed Brazilian Diamonds. Following the transaction, Origo held approximately 34.8% of the Kincora Copper. Jun 11 In September, Origo launched MSE Liquidity Fund and announced the formation of China Cleantech Partners, L.P., a US$200mn private equity fund which will invest in China's cleantech sectors. Apr 11 In November, Origo Partners and Trafigura announced formation of a 50/50 joint venture, Trafigura Origo MGL to invest in coal and iron ore opportunities. May 11 In December 2011, Origo Partners has raised approximately US$32.5mn, through placing of 57,758,333 new ordinary shares at a price of 36 pence per Placing Share. Feb 11 Mar 11 Recent Developments 61
  • 63.
    Mongolia Outlook 2012 World’sFastest Growing Economy 31 January 2012 ENTRÉE GOLD INC Eurasia Capital Call Entrée Gold is a Toronto listed Canadian mineral exploration company with gold, copper, molybdenum and coal properties in Mongolia, the USA, China, Canada and Australia. Entrée has three major projects in Mongolia, all located near the Oyu Tolgoi project. The Shivee West copper gold project is 100% owned by the company, while the Heruga project and the Hugo North Extension project are jointly owned by Entrée (20%) and Ivanhoe Mines (80%) through Entrée OT LLC joint venture. Key Stock Data Ticker Price (C$) 52 Wk high (C$) 52 Wk low (C$) Market cap (US$mn) Shares outstanding (mn) Avg d'ly turn'r (US$mn) Performance, y o y Valuation Ratios P/E Earnings Yield P/B ROE ROA Share Price Performance, C$ BUY Another mostly developed and promising Entrée project is the Ann Mason copper molybdenum deposit with inferred copper resources of 7.1bn lbs in Nevada. In the USA, Entrée has several copper projects in Nevada, Arizona and New Mexico, and a uranium project in North Dakota. Recent Developments The initial results of the 2011 exploration program from the Shivee West project were very encouraging returning up to 1.82g/t over 14 meters and demonstrated significant gold extensions for over 300 meters. In November 2011, Entrée made an additional offering of 10mn shares at C$1.25 per share and in December offered an over allotment option for additional 1.125mn shares at the same price. Entrée was able to raise C$16mn from the public offering, the exercise of the over allotment option, and the exercise of the pre emptive rights of Rio Tinto. The net proceeds are expected to be used for ongoing exploration at Ann Mason in the US and Shivee West in Mongolia. n/a n/a 3.5 (25.3%) (19.3%) 3.5 As part of the sale of its non core assets, Entrée sold the Togoot mining license covering 14,031ha for a gross consideration of C$1.6mn as the company had identified limited upside potential from the coal targets located in the area. The company also sold the Rainbow Canyon property to lower the relative acquisition cost and to strengthen the cash position for exploration in Nevada. The Rainbow property was a part of PacMag Metals acquisition in June 2010, giving Entrée title over the Ann Mason deposit in Nevada. ETG:CN 1.24 3.40 1.01 154.93 127.02 0.13 57.8% 1 3 2.5 2 Nov 11 Oct 11 Sep 11 Jul 11 Aug 11 Jun 11 Apr 11 Shareholders' Structure Entrée has an agreement, subject to regulatory approval and TSX acceptance, to acquire the remaining 49% stake in the Blackjack copper property from Honey Badger. The company had previously acquired 51% in Blackjack, located next to the Ann Mason deposit. Rio Tinto, Ivanhoe Mines The Caisse, Atlas Iron 24% Directors and Management 10% 7% Growth Outlook TD Asset Management 5% The company has a strong cash position (estimated 87% not including 4Q 2011 financing), and has a good control over acquisition and exploration costs (sale of non core assets and cut back in 3Q 2011 losses over Mongolian exploration). Entrée will explore southern part of the Heruga (copper gold molybdenum), the Blackjack, the Roulette projects, and continue drilling in the Shivee West in 2012, we believe, to discover more assets. And the strategic location (next to world class Oyu Tolgoi) and partnership with Ivanhoe will significantly contribute to the growth potential with the spillover effects from the development of Oyu Tolgoi project. Ratios and Growth Rates Net profit margin Loss per share (US$) Loss per share growth rate Sales growth rate Balance Sheet (US$mn) Current asset Long term asset Total asset Current liabilities Long term liabilities Shareholders' equity Total liabilities & equity May 11 Mar 11 Jan 11 Feb 11 1.5 2009 n/a 0.18 n/a n/a 2009 42.0 3.8 45.8 1.2 0.7 43.9 45.8 2010 n/a 0.19 5.6% n/a 2010 22.7 58.7 81.4 1.5 16.2 63.7 81.4 3Q 2011 n/a 0.12 (37%) n/a 3Q 2011 12.1 52.8 64.9 1.8 13.7 49.4 64.9 Profit & Loss (US$mn) Sales Gross profit Operating profit Pretax profit Net profit Cash Flow (US$mn) Operating Cash flow Financing Cash flow Investing Cash Flow Net cash flow Cash at the beginning Cash at the end 42% 4% 4% 4% Front Street Capital Royal Bank of Canada, RBC Dominion Securities U.S. Global Investors, Royce and Associates Other Shareholders 2009 2010 3Q 2011 (17.3) (17.1) (17.1) 2009 (13.3) 2.3 (0.3) (4.9) 45.2 40.4 (19.9) (20.6) (20.1) 2010 (15.9) 2.5 (6.9) (19.1) 40.4 21.3 (18.1) (16.5) (12.5) 3Q 2011 (16.6) 0.6 5.7 (10.8) 21.3 10.5 Stock data as of December 31, 2011 Source: Toronto Stock Exchange, Eurasia Capital www.eurasiac.com 62
  • 64.
    Mongolia Outlook 2012 World’sFastest Growing Economy 31 January 2012 SHIVEE OVOO JSC Eurasia Capital Call Shivee Ovoo (SHV) is the third largest coal producer listed on the MSE. The Company began operations in 1990 and was listed on the exchange in February 1995. The Mongolian Government owns 90% of the Company through state owned Erdenes MGL LLC, which currently holds coal licenses pertaining to SHV, and Firebird Management holds 8.1%. SHV coal mine, a Mongolian strategic deposit, is located 260km southeast of Ulaanbaatar and 20km from the Choir railway station. SHV’s total license area covers 4,293ha. According to the European and Russian reserves and resources classification standards, the initial estimated reserves of the SHV deposit is 646Mt of which 564Mt of coal is on balance (reserves) and 82Mt is off balance (resources) with calorific value of 2,963 4,407Kcal/kg. Key Stock Data Ticker SHV:MO Price (MNT) 15,300 52 Wk high (MNT) 62,300 52 Wk low (MNT) 12,500 Market cap (US$mn) 147.2 Shares outstanding 13,419,101 Avg d'ly turn'r (MNTmn) 12.8 Performance, y o y 17.2% Valuation Ratios P/E (2Q 2011) nm P/E (2011e) nm P/B (2Q 2011) nm ROE (2Q 2011) 41.5% ROA (2Q 2011) 1.6% Share Price Performance, MNT UNDER REVIEW SHV got US$67.6mn loan from the Japanese Government in 1998 2004 for expansion and the annual capacity increased to 2Mt. In 2010, it sold 1.7Mt supplying 28% of the total Mongolian consumption, according to the Company. We estimate that SHV produced about 1.8Mt in 2011. So far, SHV produced over 9Mt from the deposit. But, the state regulated coal price has been again major problem for the Company. 70,000 60,000 50,000 40,000 30,000 20,000 The installed 2km long coal conveyer system replaced truck transportation, hence it is expected to be cost efficient and improve profitability. Nov 11 Jul 11 Sep 11 May 11 Jan 11 Mar 11 Nov 10 Jul 10 Jan 10 Sep 10 10,000 The Company expects that as the coal drying facility makes the moisture to the minimum of 15% from the previous over 43%, the marketability of its coal will significantly improve. May 10 The Company invested MNT7.4bn (~US$5mn) for the construction of a coal handling facility, a coal drying facility and a conveyer system in the last two years. And, the annual capacity of the facilities and conveyer system is 2Mt, and they became operational from September 2011. The investment was financed by the Company’s own retained earnings of previous years. Mar 10 Recent Developments Shareholders' Structure 1.9% Growth Outlook According to the last information, 70% of coal consumption of the planned TPP 5 will be supplied from SHV. We estimate that SHV’s capacity should be doubled to 4Mt in order to supply the required additional 2Mt coal by 2016. As the case with other thermal coal producers, the coal price will be the most important factor for its future. In 2010, the Parliament ordered the Government to implement a policy to shift energy sector companies to a market economy principal by 2014. However, it remained unclear that whether coal price will be liberalized from the state control. 8.1% State Firebird Management Other Shareholders 90.0% To double the capacity SHV will need significant amount of financing. We view that, as is the case with BAN, the state will approve the Company to issue additional shares to finance the expansion in the coming years. However, the state ownership has to be at least more than 50% according to Mongolian law. Ratios and Growth Rates Net profit margin EPS (MNT) EPS growth rate Sales growth rate Balance Sheet (MNTmn) Current asset Fixed asset Intangible asset Total asset Current liabilities Long term liabilities Shareholders' equity Total liabilities & equity 2009 68% (823) nm 10% 2009 28,559 62,829 856 92,244 7,455 92,371 (7,583) 92,244 2010 55% 937 nm 42% 2010 31,644 60,611 787 93,042 9,904 78,240 4,898 93,042 2Q 2011 13% (107) nm nm 2Q 2011 30,087 59,203 752 90,042 8,342 78,240 3,460 90,042 Profit & Loss (MNTmn) Sales Gross profit Operating profit Pretax profit Net profit Cash Flow (MNTmn) Operating Cash flow Investing Cash flow Financing Cash flow Exchange gain Net cash flow Cash at the beginning Cash at the end 2009 16,202 1,587 1,054 (11,048) (11,048) 2009 3,552 (1,907) (27) (59) 1,558 2,131 3,689 2010 23,053 1,254 522 12,568 12,568 2010 1,172 7 59 (407) 831 3,689 4,519 2Q 2011 11,276 (808) (1,254) (1,438) (1,438) 2Q 2011 (797) (382) (1,952) (11) (3,142) 4,519 1,377 Stock data as of December 31, 2011. Source: MSE, Eurasia Capital www.eurasiac.com 63
  • 65.
    Mongolia Outlook 2012 World’sFastest Growing Economy 31 January 2012 MONGOLIA GROWTH GROUP LTD Eurasia Capital Call Mongolia Growth Group (MGG) is a real estate, financial services and insurance conglomerate, focusing its operations in the emerging economy of Mongolia. In February 2011, present management of MGG purchased common shares of Canada listed Summus Capital Corp., and renamed the company to Mongolia Growth Group Ltd. MGG is listed on the Canadian National Stock Exchange (CNSX), having the symbol YAK. Key Stock Data Ticker Price (C$) 52 Wk high (C$) 52 Wk low (C$) Market cap (C$mn) Shares outstanding (mn) Avg d'ly turn'r (C$’000) Since February 4, 2011* Valuation Ratios P/E Earnings Yield P/B ROE ROA Share Price Performance, C$ HOLD Recent Developments On December 23, 2011 MGG announced that it closed C$15mn private placement after issuing 3,846,154 common shares at a price of C$3.90 per share. On June 23, 2011, the Company closed another private placement at C$ $3.51 per share for aggregate gross proceeds of C$17.1mn. In June MGG received an insurance license from the Financial Regulatory Commission to underwrite property and casualty insurance in Mongolia. The newly formed insurance company was named “Mandal General”. Ratios and Growth Rates Net profit margin EPS (cents) Gross profit margin Sales growth rate Balance Sheet (C$mn) Current asset Fixed asset Total asset Total liabilities Shareholders' equity Total liabilities & equity 2009 2010 3Q 2011 (0.01) (0.10) (0.07) 2009 0.39 0.02 0.41 0.01 0.39 0.41 2010 0.16 0.001 0.16 0.01 0.15 0.16 3Q 2011 19.5 16.9 36.4 0.28 36.2 36.4 Profit & Loss (C$000) Revenue Gross profit Pretax profit Net profit Cash Flow (C$000) Operating Cash flow Investing Cash flow Financing Cash flow Exchange gain Cash at the beginning Cash at the end Dec 11 Nov 11 Oct 11 Sep 11 Aug 11 Jul 11 Jun 11 Apr 11 Mongolia Growth Group raised over US$45mn through private placements during 2011 and has already invested close to US$25mn in property assets comprising of retail space, office space, residential units and land. Although property rental operations generate good level of income, losses incurred by insurer Mandal General Daatgal and other corporate expenses hinder the cashflow. According to the company management, with initial capital of US$5m, Mandal General Daatgal is the best capitalized insurer in Mongolia. However, the company which received insurance license in June this year will incur further losses in the short term before it turns into profits. We believe that the property portfolio of MGG has significantly appreciated in value since it was acquired, which is in line with the management statements. With healthy cash position which was enhanced after C$15mn raise in December, the Company is expected to continue to grow its property portfolio. We are cautious about the prospects of insurance business of the Company. Possible appreciation of NAV through professional valuation of property portfolio may not be able to justify current premium at P/B ratio of 3.5. May 11 Growth Outlook Feb 11 In March, MGG has decided to enter the Mongolian Property and Casualty Insurance Market. A partnership has been struck with various members of UMC Group to provide consulting services during the business formation process. 3.5 7 6 5 4 3 2 1 0 Mar 11 In April, the Company closed C$14.9 private placement after issuing 11,257,923 common shares at C$1.32 per share. YAK:CN 3.9 6.04 0.6 126 30.3 27.3 457.1% Shareholders' Structure 9% 6% 17% 5% 3% Kupperman Harris Fleckenstein William Calonego Jordan TD Asset Mgt. Green Apple Hlds. Others 60% 2009 2.5 2010 1.4 3Q 2011 404.2 (49.4) 2009 (53.6) 0 (15.4) (247.8) 2010 (244.6) (1,445) 3Q 2011 158.1 36,224 (22,710) 451.7 382.8 382.8 138.2 138.2 13,810 *IPO Date. Stock data as of December 31, 2011 Source: Company data, Bloomberg, Eurasia Capital www.eurasiac.com 64
  • 66.
    Mongolia Outlook 2012 World’sFastest Growing Economy 31 January 2012 VOYAGER RESOURCES LTD Eurasia Capital Call Voyager Resources Limited (VOR) is an Australian listed company (quote: VOR). The company’s goal is to create sustainable exploration and development business of copper gold and gold projects in Mongolia. It has Tsagaan Chuluut gold, Tsagaan gold, Daltiin Ovoo gold and Khongor copper. Chief among of the acquisitions of several mineral deposits, the Khongor copper gold porphyry project and KM Project have potential for the company’s growth. Key Stock Data Ticker Price (A$) 52 Wk high (A$) 52 Wk low (A$) Market cap (US$mn) Shares outstanding Avg d'ly turn'r (A$mn) Performance, y o y Valuation Ratios P/E P/E (2011f) P/B ROE ROA Share Price Performance, A$ BUY Recent Developments In 2011, VOR started aggressive exploration at its gold and copper projects. With Reverse Circulation drilling at KM project located in the World Class Copper Belt of the South Gobi Province of Mongolia, the initial results were promising with 1.48 4.06% of copper from 10 66 meters and 5.4 16.2g/t silver from 14 70 meters. The Company completed the geophysics and geochemistry, and based on the results coming those survey company expanded the drilling program with two more diamond drilling. VOR also implemented extensive exploration at Khongor project throughout 24 diamond core drill holes. In addition, the recent 3D modeling of the IP survey has revealed potential for depth extension and it has expanded the mineralized zone by 150 metres in area. Updates: n/a n/a 2.67 19.9% 19.4% 0.16 0.12 0.08 Received secure commitments from subscribers on the placement of US$4.1mn 0.04 Provided prospectus, stating one share for every eight shares held by shareholders at an issue of 6 cents per share for the capital raise and it completed Agreed to acquire up to 80% of the KM Copper project 3 Jan 3 Feb 3 Mar 3 Apr 3 May 3 Jun 3 Jul 3 Aug 3 Sep 3 Oct 3 Nov 3 Dec 0 Shareholders' Structure Growth Outlook The company is planning to complete the JORC resource estimate at the second quarter of 2012 and its 50,000 meters of drilling. In reflection to its new deposits and drilling results the year to date share price increased by 25.9%. Khongor has a mineralised strike length of +1km from geological mapping and sampling that is broadly coincidental with a large Induced Polarisation chargeability anomaly that extends for +1,600 by 380 metres with average 0.93% Cu and 0.24 gt of Au based on its drilling results. It is high risk, high reward scenario. Ratios and Growth Rates Net profit margin EPS (A$ ‘000) EPS growth rate Sales growth rate Balance Sheet (A$‘000) Current asset Fixed asset Intangible asset Total asset Current liabilities Long term liabilities Shareholders' equity Total liabilities & equity VOR:AU 0.068 0.1341 0.034 71.51 1.03B 8.03 25.9% 2009 n/a n/a n/a n/a 2009 139.8 2010 n/a n/a n/a n/a 2010 2,395.2 1,244.6 2011 n/a n/a n/a n/a 2011 9,752.7 6,636.2 139.8 31,912.4 3,639.9 77.9 16,388.9 435.1 (31,632) 139.8 3,562 3,639.9 15,953.7 16,386.8 Profit & Loss (A$‘000) Sales Gross profit Operating profit Pretax profit Net profit Cash Flow (A$‘000) Operating Cash flow Investing Cash flow Financing Cash flow Exchange gain Net cash flow Cash at the beginning Cash at the end 3.0% 2.6% Peterson jason 1.4% Wood Matthew Sacha Investments 93.0% others 2009 2010 2011 (1,063.7) (1,063.7) (1,063.7) 2009 10,060.6 10,060.6 10,077.3 2010 (1,779) 1,410 5,588 0.476 2,399 4.0 2,137 (1,983) (1,983) (2,227.1) 2011 (823) 4.0 4.0 (2,350) 108.29 7,368 2,401 9,877 * Financial year ends June 30. Stock data as of December 31, 2011 Source: Bloomberg, Eurasia Capital www.eurasiac.com 65
  • 67.
    Mongolia Outlook 2012 World’sFastest Growing Economy 31 January 2012 SHARYN GOL JSC Eurasia Capital Call Sharyn Gol JSC (SHG) is a MSE listed thermal coal mining company. In 1995, the mine was partially privatized and listed on the MSE, and by 2003 it became a fully private company. Connected by railroad, SHG’s mine is located 215km north of Ulaanbaatar and 65km south of Darkhan city. SHG’s JORC compliant coal resource is 373.8Mt (of which 279.4Mt is Measured & Indicated) with a calorific value of 4,128 5,083 kcal/kg. Historically, SHG was producing over 2Mt a year in the mid 1980s. From 2000 to 2005, it produced 0.7Mt a year. Since then it has been producing around 0.5Mt of coal of which 80% has been going to the Darkhan and Erdenet thermal power plants (TPP). SHG exploited 55Mt of the coal reserve so far. Key Stock Data Ticker SHG:MO Price (MNT) 11,350 52 Wk high (MNT) 35,099 52 Wk low (MNT) 10,500 Market cap (US$mn) 82.7 Shares outstanding 10,231,389 Avg d'ly turn'r (MNTmn) 200.3 Performance, y o y 8.1% Valuation Ratios P/E (2011e) nm P/E (2012f) nm P/B (3Q 2011) 8.4 ROE (3Q 2011) 4.4% ROA (3Q 2011) 3.0% Share Price Performance, MNT BUY 30,000 20,000 SHG has intention to ramp up its production to 2.5Mt as it develops the new mine at the new discovery area and sees opportunities to reach Russian, Chinese, and the East Asian markets as it has ready railroad infrastructure connected with the Trans Mongolian railroad. Ratios and Growth Rates Net profit margin EPS (MNT) EPS growth rate Sales growth rate Balance Sheet (MNTmn) Current asset Fixed asset Intangible asset Total asset Current liabilities Long term liabilities Shareholders' equity Total liabilities & equity 2009 2% 30 260% 16% 2009 6,577 2,920 38 9,535 5,592 2,508 1,434 9,535 2010 2% 25 16% 15% 2010 8,422 14,079 38 22,539 12,197 2,508 7,834 22,539 3Q 2011 8% 59 nm nm 3Q 2011 5,100 8,576 6,803 20,478 4,075 2,508 13,894 20,478 Shareholders' Structure Firebird Management 2.1% Nihan Holdings 9.7% 8.7% Mogul Resources 9.8% 54.4% Batbold Jigjidsuren 15.2% Profit & Loss (MNTmn) Sales Gross profit Operating profit Pretax profit Net profit Cash Flow (MNTmn) Operating Cash flow Investing Cash flow Financing Cash flow Exchange gain Net cash flow Cash at the beginning Cash at the end Sharyn Gol Energo Other 2009 8,812 964 510 244 220 2009 (308) (31) (339) 623 284 2010 10,169 2,710 1,860 390 215 2010 2,642 (758) (72) (279) 1,533 284 1,818 3Q 2011 7,114 1,241 159 645 605 3Q 2011 (236) (29) 39 (11) (237) 1,818 1,581 Stock data as of December 31, 2011 Source: MSE, Eurasia Capital www.eurasiac.com Nov 11 Jul 11 Sep 11 May 11 Jan 11 Mar 11 Nov 10 The Company plans to increase its production from current less than 0.5Mt to 1Mt by 2013 and to 1.5Mt by 2015. The recently raised fund will mainly be used to renew and expand mining equipments and technology in regard to the production expansion, for working capital needs and additional exploration. The Company projects per tonne coal price at which SHG sells to increase more than 30% this year, and further steadily grew per year. According to the Company estimates, its profit will significantly increase and ROE will reach 20% in 2013. At this stage, we believe that SHG can sell the coal to the Thermal Power Plants and other consumers in the domestic market. Jan 10 Growth Outlook Jul 10 10,000 Sep 10 In January 2011, SHG converted MNT5.5bn (~US$4mn) debt from its controlling shareholder, Firebird Management, into new 1.3 shares. In October, SHG issued 1.7mn news shares at a price of MNT11,117/share in the market and successfully raised MNT18bn (~US$14mn). 40,000 May 10 On January 24, 2012, SHG announced that the Mineral Authority of Mongolia (MRAM) has approved revised mineral reserve of 146.3Mt thermal at its flagship Sharyn Gol thermal coal project in northern Mongolia. The Company conducted extensive drilling programme on the project in 2010 and earlier in 2011 announced 374Mt of JORC compliant resources. This revised reserve includes the former reserve and the reserve discovered by the above JORC compliant exploration. SHG said this more than doubles its previous reserve estimate (under Mongolian standard). Mar 10 Recent Developments 66
  • 68.
    Mongolia Outlook 2012 World’sFastest Growing Economy 31 January 2012 PROPHECY COAL CORP Eurasia Capital Call Prophecy Coal Corp. (PCY) is a Toronto listed Canadian mining development and exploration company. PCY has coal properties in Mongolia and copper, molybdenum, vanadium and titanium properties in Canada. The flagship and most developed of the Company’s assets is Ulaan Ovoo coal property in Mongolia, in which it holds a 100% interest. Prophecy also owns 100% of the Chandgana coal property, another major asset in Mongolia. In Canada, Prophecy has a 100% interest in Lynn Lake, 60% interest in Okeover and 80% interest in Titan. Key Stock Data Ticker Price (C$) 52 Wk high (C$) 52 Wk low (C$) Market cap (US$mn) Shares outstanding (mn) Avg d'ly turn'r 6M (US$mn) Performance, y o y Valuation Ratios P/E Earnings Yield P/B ROE ROA Share Price Performance, C$ BUY On May 4, 2011 PCY announced that it has entered into an Option Agreement with a private Mongolian company holding an exploration license near PCY’s Ulaan Ovoo mine, pursuant to which PCY has been granted the right to acquire 100% ownership for US$2mn within the first year, or US$4mn in the second year of the execution of the Agreement. Management and Directors 20% institutional Investors 50% 2010 3Q 2011 2009 0.1 15.2 15.3 0.04 15.3 15.3 2010 43.3 75.0 118.3 16.1 102.2 118.3 3Q 2011 14.1 106.5 120.2 1.4 118.8 120.2 Profit & Loss (US$mn) Revenue Gross profit Pretax profit Net profit Cash Flow (US$mn) Operating Cash flow Investing Cash flow Financing Cash flow Exchange gain Cash at the beginning Cash at the end Retail 30% We believe that the company starts generating cash flow in coming years as it has signed several agreements to supply with coal. Construction of 600MW Chandgana TPP will serve as a catalyst in share price increase, in our view. 2009 Nov 11 Dec 11 Shareholders' Structure Growth Outlook Ratios and Growth Rates Net profit margin EPS (pence) Gross profit margin Sales growth rate Balance Sheet (US$mn) Current asset Fixed asset Total asset Total liabilities Shareholders' equity Total liabilities & equity Sep 11 Oct 11 In late June, 2011 the company made landmark shipment of 650 tonnes of coal to Energy LLC, a company registered in the Buryatia Republic of Russia, which was then consumed in local Buryat power stations and boilers. Aug 11 On August 17, 2011 PCY discovered 19 meter thickness coal seam at the 4,733 hectare IIch property located 17km from its Ulaan Ovoo Coal mine in Mongolia. Jun 11 Jul 11 PCY announced on October 18, 2011 that the common shares of the company have been approved for listing on the Toronto Stock Exchange Starting October 19, 2011. PCY’s shares were delisted from TSX Venture Exchange as a result. 0.95 1 0.9 0.8 0.7 0.6 0.5 0.4 0.3 Apr 11 May 11 In November, 2011 the company announced that its wholly owned subsidiary East Energy Development LLC, has received the license certificate from the Mongolian Energy Regulatory Authority to construct the 600MW Chandgana power plant. Jan 11 PCY reported on December 30, 2011 that it has executed a term loan of up to C$5mn from a bank and a C$2mn inter company loan facility agreement with an affiliate company, Prophecy Platinum Corp. The loan facility which is subject to completion of the lender’s due diligence, TSX approval and completion of customary credit documentation will operate for a period of 14 months from the date of its first drawdown and bears interest at 10% per annum, compounded quarterly. Feb 11 Mar 11 Recent Developments PCY:CN 0.41 0.96 0.4 79.87 198.06 0.68 52.6% 2009 0.0 0.0 1.6 1.6 2009 1.1 0.6 0.5 2010 0. 0.0 5.6 5.6 2010 4.8 12.3 55.1 3Q 2011 0.0 0.0 13.8 6.9 3Q 2011 5.2 5.1 4.9 1.4 0.1 0.1 39.3 39.3 4.2 Stock data as of December 31, 2011 Source: Company data, Bloomberg, Eurasia Capital www.eurasiac.com 67
  • 69.
    Mongolia Outlook 2012 World’sFastest Growing Economy 31 January 2012 CENTRAL ASIA METALS PLC Eurasia Capital Call Central Asia Metals Plc. (CAML) is a London listed mining, exploration and development company whose principal business activities are on base and precious metals in Central Asia. Currently, CAML has majority interests in 5 projects: the Alag Bayan (copper gold, 70%), Ereen (gold, 85%) and Handgait (molybdenium, 80%) projects in Mongolia and the major Kounrad (copper, 60%) project in Kazakhstan. Key Stock Data Ticker CAML:LN Price (GBp) 56.88 52 Wk high (GBp) 101.50 52 Wk low (GBp) 54.00 Market cap (US$mn) 76.00 Shares outstanding (mn) 86.17 Avg d'ly turn'r (US$mn) 0.14 Performance, y o y 36.9% Valuation Ratios P/E n/a Earnings Yield n/a P/B 1.2x ROE (2.5%) ROA (2.4%) Share Price Performance, C$ BUY Recent Developments Kounrad was planned to be commissioned during 4Q 2011, and CAML has done significant development work to remain on course. In March, the company provided an update on the project with estimated capex of US$46.9mn, completed engineering design, first deliveries of equipment to the site expected in April. CAML also completed and commissioned rail system providing access to Kounrad. In December, CAML announced the official opening of the project, included in the national initiative of State Programme of Innovation and Accelerated Industrial Development of Kazakhstan for 2010 2014. Full commissioning has been planned for February 2012. CAML reached an agreement to sell the Tochtar project in line with the corporate strategy outlined in 2010 to Wildford Holding Limited for a total of US$2.5mn. The total consideration consists of US$0.825mn in cash payment and US$1.675mn to cover historical liabilities. According to the management, the sale will remove the historical cost liabilities and enable to focus 100% on delivery of Kounrad SXEW Copper project. CAML will also continue to negotiate the disposal of Ereen (Mongolia) project. Successful completion will be contingent upon the negotiations of CAML with the Mongolian Government as 3 out of 5 mining licenses are included in the revocation list of ‘placer’ gold occurrences. Since Ereen comprises of JORC compliant 19.9Mt at grade 1.2g/t ‘hardrock’, and not considered ‘placer’ gold, CAML will continue discussions with authorities, and allocate only US$0.2 0.8mn for exploration and evaluation at Ereen. 110 100 90 80 70 60 50 Jan 11 Feb 11 Mar 11 Apr 11 May 11 Jun 11 Jul 11 Aug 11 Sep 11 Oct 11 Nov 11 Dec 11 Among the company’s major activities is the construction and operation of a 10,000tpa copper cathode Solvent Extraction Electro Winning (SXEW) plant in Kounrad. Shareholders' Structure Comonwealth America Blackrock Inc. 11% 18% Growth Outlook In our view, the planned start of production in early 2012 in Kounrad with ready infrastructure and expected rise copper prices will bring CAML to positive net profit by the year end. Currently, the company has a cash position (82% cash of current assets in 2Q2011) that can support minor capex before production in Kourad and further exploration in other licence areas. We believe, CAML’s decision not to proceed with larger capex at Ereen until clarification over some of the licenses is right and the company may focus on extending the licence in Alan Buyag (copper gold) and exploring in Hangait (molybdenum). Ratios and Growth Rates Net profit margin Loss per share (US¢) Loss per share growth rate Sales growth rate Balance Sheet (US$'000) Current asset Non current asset Total asset Current liabilities Long term liabilities Shareholders' equity Total liabilities & equity Lansdowne Partners 2009 (1315%) 46 n/a n/a 2009 5,990 14,235 20,225 3,539 441 16,244 20,225 2010 (404%) 11 (76%) 27% 2010 54,057 22,505 76,562 1,147 684 74,730 76,562 2Q 2011 (159%) 2 (82%) (22%) 2Q 2011 40,424 35,281 75,706 1,787 799 73,120 75,706 Profit & Loss (US$'000) Sales Gross profit Pretax profit Net profit Cash Flow (US$'000) Operating Cash flow Investing Cash flow Financing Cash flow Exchange gain Net cash flow Cash at the beginning Cash at the end 7% 7% 5% 35% 5% 2% 5% 5% Henderson Global Investors Legal & General Group Mr. Robert Maitland Cathery Mr. Edward Bloomstein Capital Research Global Investors Fidelity Management Other Shareholders 2009 1,141 25 (15,002) (15,002) 2009 (3,625) (4,564) 4,890 (6,207) (3,299) 4,630 1,330 2010 1,446 48 (5,844) (5,844) 2010 (7,681) (5,176) 58,952 60 46,035 1,330 47,365 2Q 2011 1,129 149 (1,797) (1,797) 2Q 2011 (4,311) (9,614) (241) (14,165) 47,375 33,211 Stock data as of December 31, 2011 Source: Company data, Bloomberg, Eurasia Capital www.eurasiac.com 68
  • 70.
    Mongolia Outlook 2012 World’sFastest Growing Economy 31 January 2012 PETRO MATAD LTD Eurasia Capital Call Petro Matad Ltd. is an AIM listed parent of a group focused on oil exploration, as well as future development and production in Mongolia. The principal asset is the PSC over Matad Block XX, a petroleum block with an area of 14,250 sq. km in the far eastern part of the country. Key Stock Data Ticker MATD:LN Price (GBp) 24.75 52 Wk high (GBp) 211.00 52 Wk low (GBp) 13.50 Market cap (US$mn) 70.80 Shares outstanding (mn) 184.57 Avg d'ly turn'r (US$mn) 0.36 Performance, y o y 79.7% Valuation Ratios P/E Earnings Yield P/B ROE 2Q 2011 28.0% ROA 2Q 2011 25.9% Share Price Performance, C$ BUY Recent Developments In November the company completed 2011 exploration programme in Blocks IV and V consisting of stratigraphic core drilling, 2D seismic acquisitions and field geology operations. The exploration programme aimed to identify drillable prospects and will help 2012 exploration programme. The programme confirmed the presence of a working petroleum system in the Tugrug basin in Block V In September 2010 the company raised through a placing and subscriptions approx. US$54mn Petrovis LLC and Westhouse Securities Ltd. exercised their options on 2mn and 966,800 Petro Matad shares respectively in July 2010 Jul 15, 2010 Petro Matad announced that the Davsan Tolgoi 1 well (DT 1) on Block XX had been completed, and found significant indications of hydrocarbons in the target Tsagaansav formation. The well is the first to be drilled as part of the 2010 drilling programme on Block XX 250 A US$6mn investment in Petro Matad by the European Bank for Reconstruction and Development (EBRD) announced on Dec 18, 2009. First tranche of 13,730,103 shares issued to EBRD in Feb 2010 and the second tranche of 14,644,004 shares issued in Jun 2010. 100 200 150 50 Dec 11 Oct 11 Aug 11 Jun 11 Apr 11 Company’s Matad Block XX is located near China and to the south of the largest producing oilfield in Mongolia. There is a ready market, at close to world prices, in nearby China for any oil discovered in Block XX, and there are established export routes. The two other Blocks, IV and V are located in central Mongolia and jointly cover 71,000 km2. Feb 11 Dec 10 0 Growth Outlook Shareholders' Structure Petrovis LLC 6% 20% 4% 47% 17% 6% Janchiv Oyungerel EBRD Forestberries LLC Others GLG Partners LP Ratios and Growth rates Net profit margin EPS (US$) EPS growth rate Sales growth rate Balance Sheet (US$‘000) Current assets Fixed assets Intangible assets Total assets Current liabilities Long term liabilities Shareholders' equity Total liabilities & equity 2009 n/a (4.70) n/a n/a 2009 5,352 199 15,275 20,826 796 2010 n/a (10.50) n/a n/a 2010 52,132 450 15,275 67,857 1,421 2Q 2011 n/a (8.27) n/a n/a 2Q 2011 42,306 912 15,275 58,493 4,179 20,030 20,826 66,436 67,857 54,314 58,493 Profit & Loss (US$‘000) Sales Gross profit Operating profit Pretax profit Net profit Cash Flow (US$‘000) Operating Cash flow Investing Cash flow Financing Cash flow Exchange Translation Net cash flow Cash at the beginning Cash at the end 2009 n/a n/a (5,080) (5,080) (5,080) 2009 (4,006) (124) 6,173 (76) 2,043 3,248 5,215 2010 n/a n/a (16,079) (16,079) (16,079) 2010 (13,342) (307) 60,442 (318) 46,793 5,215 51,690 2Q 2011 n/a n/a (16,029) (15,185) (15,185) 2Q 2011 (10,030) (522) 161 (10,391) 41 51,690 41,340 Stock data as of December 31, 2011 Source: Company data, Bloomberg, Eurasia Capital www.eurasiac.com 69
  • 71.
    Mongolia Outlook 2012 World’sFastest Growing Economy 31 January 2012 XANADU MINES LTD Eurasia Capital Call Xanadu Mines (XAM) is a Mongolia focused coal, gold and copper exploration company listed on ASX. The company was founded in 2005 and listed on the ASX in December 2010. The Company has two coking coal assets, the Nuurstei and Javkhlant Joint Ventures with Noble Group, as well as two thermal coal assets the Khar Tarvaga coal project, located 200kms south east of Ulaanbaatar in Central Mongolia with a JORC compliant coal resource of 327Mt and the Galshar coal project located in the south east Gobi with a JORC compliant coal resource of 170Mt. Other assets include copper and gold exploration licenses in northern and south eastern Mongolia. Key Stock Data Ticker Price (A$) 52 Wk high (A$) 52 Wk low (A$) Market cap (US$mn) Shares outstanding (mn) Avg d'ly turn'r (US$) Performance, y o y Valuation Ratios P/E P/E (2012f) P/B ROE ROA Share Price Performance, A$ HOLD Recent Developments On November 22, 2011 the company announced that it had acquired 100% interest in Khavtsgait coking coal project located in Khuvsgul province of northern Mongolia. In early December 2011 the company received mining license from Mineral Authority of Mongolia for the Khar Tarvaga thermal coal project which is located 36km from the trans Mongolian railway in Tuv province. The mining license covers an area of 83.5 sq km and has been granted for an initial term of 30 years. In late November, 2011 the company announced that it would start drilling work shortly following the announcement at its Javkhlant metallurgical coal project located 22km from Chinese border in Gobi Altai province of Mongolia. XAM:AU 0.345 0.80 0.31 65.8 186.9 222,700 (38.9%) n/a n/a 1.53 (9.8%) (9.3%) 0.8 0.7 0.6 Growth Outlook 0.5 0.4 0.3 3 Dec 3 Oct 3 Nov 3 Sep 3 Jul 3 Aug 3 Jun 3 Apr 3 May 3 Jan 0.2 3 Feb 3 Mar Strong economic growth in China has resulted in increased demand for resources such as coal, and coupled with continuing demand from other Asian markets, has driven and will continue to drive the global resource sector. Xanadu Mines with its coal and other assets in Mongolia, next door to China, is well positioned to take advantage of this growth. Shareholders' Structure Straits Energy Trading 11.4% Noble Group LTD 9.6% 7.5% 6.0% 65.6% Eagle Securities Limited Bikini Atoll Investments Other shareholders Ratios and Growth Rates Net profit margin EPS (A$cents) EPS growth rate Sales growth rate Balance Sheet (A$’000) Current asset Fixed asset Intangible asset Total asset Current liabilities Long term liabilities Shareholders' equity Total liabilities & equity 2009 n/a (7.1) n/a n/a 2009 709 6,366 11 7,087 484 508 6,094 7,087 2010 n/a (1.85) n/a n/a 2010 949 9,441 8 10,399 3,118 2011 n/a (2.75) n/a n/a 2011 24,938 19,577 5 44,520 2,441 7,281 10,399 42,079 44,520 Profit & Loss (A$’000) Sales Gross profit Operating profit Pretax profit Net profit Cash Flow (A$’000) Operating Cash flow Investing Cash flow Financing Cash flow Exchange gain Net cash flow Cash at the beginning Cash at the end 2009 2010 2011 (4,000) (3,229) (3,229) 2009 (1,285) (2,222) 739 288 (2,756) 3,058 590 (2,083) (2,058) (2,058) 2010 (1,725) (329) 2,096 43 42 590 677 (4,162) (3,463) (4,155) 2011 (3,957) (9,867) (37,442) (709) 23,618 677 23,586 * Financial year ends June 30. Stock data as of December 31, 2011 Source: Bloomberg, Eurasia Capital www.eurasiac.com 70
  • 72.
    Mongolia Outlook 2012 World’sFastest Growing Economy 31 January 2012 HARANGA RESOURCES LTD Eurasia Capital Call Haranga Resource (HAR) is an Australian listed iron ore exploration and mining company with investment of CIC holding a third of the company’s stake. The company operates in two strategy line: exploration and development of iron ore, and acquisition and upgrade of its portfolio. HAR wholly owns Khundlun project and holds majority stakes in 4 deposits in Mongolia: Shavdal (75%), Selenge (60%), and Tumurtei Khudag (51%), and Sumber (75%). The current projects in Mongolia have the cost advantageous location close to transportation facilities. Key Stock Data Ticker HAR:AU Price (A$) 0.285 52 Wk high (A$) 0.74 52 Wk low (A$) 0.16 Market cap (US$mn) 57.24 Shares outstanding 196.75mn Avg d'ly turn'r (US$) 253466.4 Performance, y o y 55.5% Valuation Ratios P/E 39.23 P/E (2011f) 50.4 P/B 2.21 ROE n/a ROA n/a Share Price Performance, A$ HOLD Recent developments In November 2011, HAR announced that it acquired a further 20% interest in a joint venture company that holds the five exploration licences comprising the Selenge Iron Ore Project. 29 of the 33 drill holes at the Bayantsogt Prospect within the Selenge Iron Ore Project area have intersected significant widths of iron mineralization as well as Huiten Gol and Dund Bulag prospects at Selenge project. Five major iron lodes identified within the large Bayantsogt hill with the result of 26 47% Fe. In 2011, with having completed full magnetic survey the company drilled first pass drill holes and 10 out of 20 holes encountered significant iron mineralization at Shavdal project. It has also started the metallurgical test and is targeting the release of maiden JORC estimates by the first quarter of 2012. Growth Outlook 0.8 0.6 0.4 0.2 In 2011 Mongolian iron ore export has grown rapidly and the market outlook remains strong due to the demand of the world’s biggest importer of iron ore, China. The JORC estimate coming in the first quarter of 2012 will be vital to company’s growth and future stage of operation. 31 Dec 31 Oct 31 Aug 30 Jun 28 Feb 30 Apr 0 31 Dec The company is planning to explore the current projects and to acquire additional top quality projects. At Selenge A$1.8m was allocated to carry out a geophysical survey and a 15,000m drilling campaign aimed at defining a maiden JORC compliant resource. Rock chip sampling has already returned positive results at the project. Shareholders' Structure 7% 5% 4% Golden Rain Holding Ltd Sukhbaatar Bat Ochir Wood Matthew 84% Ratios and Growth Rates Net profit margin EPS EPS growth rate Sales growth rate Balance Sheet (A$ ‘000) Current asset Fixed asset Intangible asset Total asset Current liabilities Long term liabilities Shareholders' equity Total liabilities & equity 2009 n/a n/a n/a n/a 2009 n/a n/a n/a n/a n/a n/a n/a n/a 2010 n/a n/a n/a n/a 2010 23,219.5 3,157.9 26,377.5 503.9 25,873.6 26,377.5 2011 n/a n/a n/a n/a 2011 n/a n/a n/a n/a n/a n/a n/a n/a Profit & Loss (A$ ‘000) Sales Gross profit Operating profit Pretax profit Net profit Cash Flow (A$ ‘000) Operating Cash flow Investing Cash flow Financing Cash flow Exchange gain Net cash flow Cash at the beginning Cash at the end Other 2009 n/a n/a n/a 2009 n/a n/a n/a n/a n/a n/a n/a 2010 n/a n/a n/a (2,310.8) (2,310.8) 2010 (272.5) (2,397.9) 25,814.6 (116.5) 23,028 23,028 2011 n/a n/a n/a 2011 n/a n/a n/a n/a n/a n/a n/a Stock data as of December 31, 2011 Source: Bloomberg, Eurasia Capital www.eurasiac.com 71
  • 73.
    Mongolia Outlook 2012 World’sFastest Growing Economy 31 January 2012 MONGOLIA INVESTMENT GROUP Eurasia Capital Call Mongolia Investment Group (402) is a Hong Kong listed company formerly known as Ming Hing Waterworks Holdings Limited. The company changed its name in September 2010 following a substantial acquisition of a Mongolia focused company. In Hong Kong the group is engaged in waterworks engineering, road works and drainage and slope upgrading services. In 2010, the group transformed into a Mongolian resources related group through the acquisition of Tugrugnuuriin Energy LLC, which holds four mining licenses for a coal mine in Tugrug Valley, located approximately 170 km southeast of Ulaanbaatar. Additionally, the company holds several gold, copper and coal exploration licenses in Gobi Altai, Dundgobi and Zavkhan provinces. The coal deposit in Turgug valley has 64Mt measured and indicated resource, and 27.9Mt inferred resource of coal. Another three coal exploration licenses are located in DundGobi province, 198km southeast of Ulaanbaatar. The company’s gold and copper license areas are located in Gobi Altai and Zavkhan provinces covering 44,019 hectares and 15,517 hectares respectively. Key Stock Data Ticker Price (HK$) 52 Wk high (HK$) 52 Wk low (HK$) Market cap (US$mn) Shares outstanding (bn) Avg d'ly turn'r (US$) Performance, y o y Valuation Ratios P/E P/E (2012f) P/B ROE ROA Share Price Performance, HK$ UNDER REVIEW 0.14 0.12 0.10 0.08 0.06 0.04 Moving forward, the group will continue to develop the operations at its mine gradually, and work towards securing off take agreements with customers. With the Hong Kong Government’s commitment towards implementing more infrastructural development projects mentioned in its 2011 Policy Address, it is believed the group’s waterworks business will benefit from such significantly. The Group will duly seek to secure new public sector contracts, thereby drawing additional sources of income. Ratios and Growth Rates Net profit margin EPS (HK$cents) EPS growth rate Sales growth rate Balance Sheet (HK’000) Current asset Fixed asset Intangible asset Total asset Current liabilities Long term liabilities Shareholders' equity Total liabilities & equity 2009 1% 0.71 n/a n/a 2009 550,945 61,670 2010 (2.6%) (2.13) n/a 2.3% 2010 507,304 60,912 2011 (42%) (6.76) n/a 29.4% 2011 720,733 2,603,222 612,615 210,548 18,885 383,182 612,615 568,216 197,892 6,056 364,268 568,216 3,323,955 213,650 1,419,321 1,690,380 3,323,955 3 Dec 3 Oct 3 Nov 3 Sep 3 Jul 3 Aug 3 Jun 3 Jan 3 Apr 0.02 Growth Outlook The Company plans to continually develop and expand the potential business by acquiring valuable and quality assets in the region. Chinese economic growth results in increased demand in China for resources such as coal, coupled with continuing demand from other Asian markets, have driven and will likely continue to drive the global resource sector. Resource companies with assets in Mongolia and elsewhere in proximity with China are expected to show significant growth depending on its quality of mineral assets. NA NA 0.25 (21.9%) (11.1%) 0.16 3 May In December 2011, the company signed a MOU with Yun Tu and other parties to acquire Sinbu Investment Limited, a company engaged in aerial photography, aviation and aerospace remote sensing image data processing, provision of geographic information system (“GIS”) software and solutions. For the six months ended on 30 September, 2011 the company reported revenue of HK$425mn (or US$54.7mn) and net loss of HK$74.8mn (or US$9.6mn). The group achieved stable revenue from its waterworks business while dedicating efforts to facilitate profitable output at its Mongolia mine sites. The output of coal from the mine during the period was about 748 tonnes, which was below the company forecast. 3 Feb 3 Mar Recent Developments 402:HK 0.046 0.149 0.039 54.5 9.19 533,000 (67.6%) Shareholders' Structure Diamond Wealth Holding Tan Kah Hock 20.14% 7.60% 6.43% 60.90% Profit & Loss (HK$’000) Sales Gross profit Operating profit Pretax profit Net profit Cash Flow (HK$’000) Operating Cash flow Investing Cash flow Financing Cash flow Exchange gain Net cash flow Cash at the beginning Cash at the end 4.93% 2009 660,870 49,950 14,763 8,197 6,391 2009 (23,466) (17,622) (67,821) (218) (108,909) 172,884 63,757 2010 675,959 31,393 (13,742) (15,234) (17,281) 2010 111,540 (30,009) (57,757) 21 23,774 63,757 87,552 Mashbat Bukhbat Robinhoods Development Other shareholders 2011 874,961 46,538 (382,399) (458,385) (370,586) 2011 (28,370) (247,824) 478,717 591 202,523 87,552 290,666 * Financial year ends March 31, Stock data as of December 31, 2011 Source: Bloomberg, Eurasia Capital www.eurasiac.com 72
  • 74.
    Mongolia Outlook 2012 World’sFastest Growing Economy 31 January 2012 MONGOLIAN TELECOM JSC Eurasia Capital Call Mongolian Telecom (MCH) is a telecommunications services provider. It provides traditional fixed line telephone services throughout the country using the nationwide fixed line network; however, the network is under state ownership. The Company also offers internet, facsimile, TV broadcasting and mobile phone services in the capital city. A 54.7% stake of the Company is held by the Government, 40% by Korea Telecom and the rest is on free float. MCH employs over 1,000 people. Key Stock Data Ticker MCH:MO Price (MNT) 2,700 52 Wk high (MNT) 4,501 52 Wk low (MNT) 2,500 Market cap (US$mn) 50.1 Shares outstanding 25,870,276 Avg d'ly turn'r (MNTmn) 1.2 Performance, y o y 22.9% Valuation Ratios P/E (3Q 2011) 507.2 P/E (2011e) 380.4 P/B (3Q 2011) 2.1 ROE (3Q 2011) 0.4% ROA (3Q 2011) 0.3% Share Price Performance, MNT SELL 3,000 2,000 Nov 11 Jul 11 Sep 11 May 11 Jan 11 Mar 11 Jul 10 1,000 Nov 10 The Company’s future development will significantly depend on its privatization and business strategy. In case Korea Telecom will not buy the state owned stake, there is an opportunity for players such as MobiCom to acquire the Company. 4,000 Sep 10 The company’s profitability has been decreasing every year from MNT5.3bn in 2008 to MNT2.8bn in 2009 to MNT1.8bn in 2010. During the first three quarters of 2011, the Company operated with only MNT138mn net earnings. Recently, MCH laid off 200 workers, 140 in local settlement offices and 60 in the capital city due to the deteriorating financial results. 5,000 May 10 MCH was the only company to provide telecommunication services in Mongolia before the establishment of MobiCom, the first mobile phone service provider in Mongolia, in 1996. Since that time, three more mobile service providers entered the market. As mobile service providers expanded their networks throughout the country, MCH’s market share in the telecom sector has been decreasing. Jan 10 Growth Outlook Mar 10 MCH is included in the 2012 Privatization Plan approved by Parliament in early 2010. The Government plans to completely privatize its holdings in the Company. Due to the agreement with Korea Telecom, the Government stake will be offered to Korea Telecom first. If Korea Telecom is not interested, the stake will be offered to the public in an open tender. During 2011, however, no important news was realised on the matter. Shareholders' Structure 5.3% State Korea Telecom 40.0% 54.7% Other Shareholders Ratios and Growth Rates Net profit margin EPS (MNT) EPS growth rate Sales growth rate Balance Sheet (MNTmn) Current asset Fixed asset Intangible asset Total asset Current liabilities Long term liabilities Shareholders' equity Total liabilities & equity 2009 10% 107 48% 15% 2009 20,087 16,316 3,332 39,735 7,369 2010 7% 71 34% 5% 2010 21,411 16,333 4,016 41,760 8,383 3Q 2011 1% 5 nm nm 3Q 2011 22,535 14,709 4,138 41,381 8,695 32,367 39,736 33,376 41,760 32,686 41,381 Profit & Loss (MNTmn) Sales Gross profit Operating profit Pretax profit Net profit Cash Flow (MNTmn) Operating Cash flow Investing Cash flow Financing Cash flow Exchange gain Net cash flow Cash at the beginning Cash at the end 2009 26,655 4,193 2,703 3,089 2,776 2009 5,234 (2,328) (1,119) (20) 1,768 9,106 10,874 2010 25,290 3,158 1,550 2,100 1,838 2010 3,661 (3,767) (112) (12) (230) 10,874 10,644 3Q 2011 17,322 928 (262) 201 138 3Q 2011 3,337 (3,757) (213) 8 (626) 10,644 10,018 Stock data as of December 31, 2011 Source: MSE, Eurasia Capital www.eurasiac.com 73
  • 75.
    Mongolia Outlook 2012 World’sFastest Growing Economy 31 January 2012 EAST ASIA MINERALS CORP Eurasia Capital Call East Asia Minerals Corporation (the “Company”) is listed for trading on the TSX Venture Exchange (EAS) and operates in the mineral exploration and development industry, specifically on properties within East Asia. In Indonesia the Company has 6 gold & copper properties, and in Mongolia it has 9 uranium properties and two phosphate properties. The gold & copper properties form the Company’s core Indonesia growth assets, and the uranium properties; Enger, Ingiin Nars and Ulaan Nuur uranium properties in Mongolia. Key Stock Data Ticker EAS:CN Price (C$) 0.47 52 Wk high (C$) 8.55 52 Wk low (C$) 0.41 Market cap (US$mn) 50.7 Shares outstanding 110.22mn Avg d'ly turn'r (US$) 223109.6 Performance, y o y 94.2% Valuation Ratios P/E n/a P/E (2011f) n/a P/B 2.14 ROE 24.15% ROA 22.86% Share Price Performance, C$ HOLD Recent Developments The Company has been doing the initial drilling at several sites. It is ready to commence initial drillings at Salurgan, Sede, Kupa and Taware and its Phase 2 drilling at Binebase and Bawone, in Indonesia. In 2011, the company established wholly owned subsidiary companies and transferred the non Miwah assets to them. Hence wholly owned East Asia Minerals Exploratioin and EAM Teshig LLC are becoming holding companies of the uranium and phosphate exploration prospects in Mongolia. The company also completed 53 drill holes for a total of 2624 meters in Mongolia in October 2011. 10 It also filed NI43 101 Resource estimate technical report on Miwah Gold project in Indonesia. According to the company, its Inferred Resources at a 0.20 g/t gold cut off, is estimated at 103.9 million tonnes averaging 0.94 g/t gold and 2.68 g/t silver for 3.14 million ounces gold and 8.95 million ounces silver in near and at surface mineralization. 8 In October 2011, the company announced the completion of US$8mn brokered private placement and US$5mn non brokered private placement for the use of general working capital. Also, the Company announced changes to its management structure as well as the board of directors. Dr. Darryl Clark has resigned as CEO Director of East Asia, and is replaced by Mr. Edward Rochette. 0 6 4 Nov 11 Dec 11 Sep 11 Oct 11 Aug 11 Jun 11 Jul 11 Apr 11 May 11 Jan 11 Feb 11 Mar 11 2 Shareholders' Structure Growth Outlook The Company holds 85% of Miwah project which was planned the exploration in 2012. Miwah project lies within three contiguous Izin Usaha Pertambangan ("IUP"), also referred to as mining business licenses which does not grant complete set of permits mining activity including forestry access permits. To this extent, the company should clear out the legal and regulatory situation regarding to the mining area which overlaps with a protected forest area. This will affect the company’s plan of 2012 and its future growth. Sprott Asset Management 12% 5% 4% Franklin Resources incorporated 79% Other In terms of the uranium deposits in Mongolia, the uranium sector has not been developed. The Parliament has announced a new law which dictates the Government will own +34% and +51% of the license holding company’s shares for free depending on whether the company or the Government financed the exploration. Ratios and Growth Rates Net profit margin EPS EPS growth rate Sales growth rate Balance Sheet (C$‘000) Current asset Fixed asset Intangible asset Total asset Current liabilities Long term liabilities Shareholders' equity Total liabilities & equity 2009 n/a n/a n/a 2010 n/a n/a n/a 2011 n/a n/a n/a 2009 7,476.0 16,397.1 2010 21,791.7 26,947.0 2011 10,945 33642 23,873.1 700.6 48,738.7 1,963.3 125.5 46,649.9 48,738.7 44,588 2,871.7 44.9 41671 44,588 23,172.5 24,173.1 Profit & Loss (C$‘000) Sales Gross profit Operating profit Pretax profit(loss) Net profit Cash Flow (C$‘000) Operating Cash flow Investing Cash flow Financing Cash flow Exchange gain Net cash flow Cash at the beginning Cash at the end Tocqueville Asset Management 2009 2010 2011 (9,932.2) (9,932.2) 2009 (13,411.5) (5,668.9) 5,390.9 (16,883.8) (17,209.7) (15,508.8) 2010 (2,179.9) (8,289.8) 24,461.6 (11,781.5) (11,762.2) (10,666.5) 2011 (5,926.6) (17,542.9) 12,343.6 (13,689.5) 19,084.6 5,395.1 13,991.6 5,395.1 19,386.7 (11,125.9) 19,386.7 8,260.8 * Financial year ends August 31. Stock data as of December 31, 2011 Source: Bloomberg, Eurasia Capital www.eurasiac.com 74
  • 76.
    Mongolia Outlook 2012 World’sFastest Growing Economy 31 January 2012 KINCORA COPPER Eurasia Capital Call Kincora Copper is a mining exploration and development company focused on copper and gold deposits in Mongolia. The company is listed on the TSX Venture Exchange as KCC and holds 100% ownership of the Bronze Fox Copper Gold Project (Buyant License) located 200 kilometers from the Chinese border in the southeast of Mongolia. Key Stock Data Ticker KCC:CN Price (C$) 0.31 52 Wk high (C$) 0.65 52 Wk low (C$) 0.105 Market cap (C$mn) 42.88 Shares outstanding 138.332mn Avg d'ly turn'r (US$) 16,508.8 Performance, y o y 12.9% Valuation Ratios P/E n/a P/E (2011f) n/a P/B n/a ROE n/a ROA 120.47% Share Price Performance, C$ UNDER REVIEW 0.6 0.5 0.4 0.3 0.2 0.1 Stock options to its directors, officers, employees and consultants The geological team is working throughout the winter to review all of the historic and recent geological information in order to optimize the exploration efforts for the next drilling season in March 2012. Kincora plans to carry out a high resolution ground magnetic survey program. The objective of this survey is to map structure and alterations associated with magnetite destruction, and also to highlight any magnetic intrusions, especially for the covered terrain which composes significant parts of the license area. Additionally the company is looking for acquisition of additional top quality copper and gold projects in Mongolia and moving to pre feasibility work and development. At present, the Company’s operations do not generate cash inflows and its financial success is dependent on management’s ability to discover economically viable mineral deposits and an equity sale is the way to fuel its exploration expenditures. 2009 n/a n/a n/a n/a 2009 1,570.0 1,150.0 2010 n/a n/a n/a n/a 2010 200.0 2,720.0 1,760.0 130.0 830.0 2,720.0 200.0 990.0 3Q 2011 n/a n/a n/a n/a 3Q 2011 6,407.0 37,419.0 N/A 43,826.0 1,034.0 (790.0) 200.0 42,792.0 43,826.0 3 Dec 3 Oct Shareholders' Structure Growth Outlook Ratios and Growth Rates Net profit margin EPS EPS growth rate Sales growth rate Balance Sheet (C$ ‘000) Current asset Fixed asset Intangible asset Total asset Current liabilities Long term liabilities Shareholders' equity Total liabilities & equity 3 Nov 3 Jul 3 Jan 3 Sep 0 In July, the Company announced that it had retained First Canadian Capital Corp. ("First Canadian) to provide strategic marketing and investor relations service. 3 Aug In July, the Company announced the completion of its acquistition of a 75% in Kincora Group Ltd by issuing 49mn common shares to Origo and paid US$6mn to Mr. Khojgor and invested US$4.5mn. 0.7 3 Jun On April 11, 2011, the Company issued 2.4mn common shares at C$0.09 per share to settle outstanding debt in the amount of C$217,400 and also the company completed a private placement with total proceeds of C$1.6mn in tranches. 3 Apr Highlights: 3 May Former Brazilian Diamonds, Kincora Copper acquired the full ownership of Kincora Group. The company commenced 10,000m drilling campaign in 2011. It has focused on 13% of the license area and drilled 23 holes in 2011 to a total depth of over 12,000m. The Company has also completed a soil sampling exercise over the area at a grid of 200m and a rock chip sampling exercise at 2m intervals. There are currently a large number of assays still outstanding and these results are being received on a daily basis. Rock chip sampling with 1716 samples in the existing Russian trenches was conducted and 8 out of which has been returned with 0.5 3.05g/t Au and 3 samples with +19g/t Au. 3 Feb 3 Mar Recent developments Profit & Loss (C$ ‘000) Sales Gross profit Operating profit Pretax profit Net profit Cash Flow (C$ ‘000) Operating Cash flow Investing Cash flow Financing Cash flow Exchange gain Net cash flow Cash at the beginning Cash at the end Origo Partners Plc 33% Khojgor Duchintav 20% Massif Ltd 45% Others 2% 2009 n/a n/a (1,320.0) (1,320.0) (1,320.0) 2009 (560.0) 570.0 (10.0) 2010 n/a n/a (1,090.0) (1,710.0) (1,710.0) 2010 (780.0) 850.0 10.0 77.0 87.0 80.0 87.0 167.0 3Q 2011 n/a n/a n/a n/a n/a 3Q 2011 (732.0) (6,724.0) 13,536.0 (279) 6,080 167.0 6,247 Stock data as of December 31, 2011 Source: Bloomberg, Eurasia Capital www.eurasiac.com 75
  • 77.
    Mongolia Outlook 2012 World’sFastest Growing Economy 31 January 2012 SOLARTECH INTERNATIONAL HOLDINGS LTD Eurasia Capital Call Solartech International Holdings Ltd., incorporated in Bermuda and listed on the Hong Kong Stock Exchange, is principally engaged in the business of manufacturing and trading of cables and wires, copper rods and connectors and terminals. By the end of its 2010 financial year (June 30), Solartech disposed of its manufacturing and trading of connector and terminals business. Most of Solartech’s turnover is generated in American market (55.0%) and Mainland China and Hong Kong markets (36.7%). However, the company is working to focus and deploy its resources on the businesses of manufacturing and trading of copper products and cable and wires based in Mainland China and has begun to shift more heavily into resource exploration and extraction. Key Stock Data Ticker 1166:HK Price (HK$) 0.177 52 Wk high (HK$) 1.1 52 Wk low (HK$) 0.145 Market cap (US$mn) 40.24 Shares outstanding (mn) 1765.8 Avg d'ly turn'r (US$mn) 0.227 Performance, y o y 81.6% Valuation Ratios P/E n/a Earnings Yield n/a P/B 0.12 ROE 19.3% ROA 17.2% Share Price Performance, HK$ 0.9 0.7 0.5 0.3 Nov 11 Dec 11 Sep 11 Oct 11 Aug 11 0.1 Jun 11 Jul 11 In May 2010, Solartech acquired Ikh Shijir Erdene LLC, a company incorporated in Mongolia with exploration and mining licenses covering 3,112.5ha and 351.26ha, respectively, including total resources of 1.44Mt of copper, for the Bor Teeg Copper Gold Project. The acquisition was valued at HK$1.5bn with HK$1,432.0mn worth of convertible bonds issued by Solartech to the vendor and HK$68.0mn in cash. 1.1 Apr 11 May 11 Solartech entered into a placing agreement with Kingston Securities Ltd. in September 2010 to place up to 7.2bn shares on a fully underwritten basis for aggregate net proceeds of HK$140mn. Jan 11 Solartech announced in January 2011 that it entered into an MOU in relation to acquisition of a company holding a mining license and two exploration licenses of rare earth located in Tuv province of Mongolia. The target company is called Vangyunshing LLC incorporated in Mongolia. Feb 11 Mar 11 Recent Developments UNDER REVIEW Growth Outlook Solartech is very sensitive to global commodity prices, particularly copper prices as the company’s major business is manufacturing and trading of copper rods, cables and wires. Further, as the company explains the competition is putting downward pressure on prices of the products. This may explain the significant decline is share prices in the market. Therefore, we believe that upside potential is limited from the main operations. In 2011, the company finished the financial year with a positive net profit; however, this is due to large change in fair value of convertible bonds that have put option properties and change in fair value of derivative instruments. Shareholders' Structure Top Esteem Holdings Ltd. 10% 10% 14% Luckyman Assets Management 66% On the mining front, the company has not completed the acquisition of rare earth assets in Mongolia, and it is still uncertain if it advances any plans in this regard. Ratios and Growth Rates Net profit margin EPS (HK¢) EPS growth rate Sales growth rate Balance Sheet (HK$'000) Current asset Non current asset Total asset Current liabilities Long term liabilities Shareholders' equity Total liabilities & equity 2009 (46.6%) n/a n/a (67.0%) 2009 557.2 553.1 1,110.3 444.2 40.1 626.0 1,110.3 2010 (9.6%) (8.32) n/a 23.5% 2010 618.4 1,704.9 2,323.3 368.3 1,052.9 902.1 2,323.3 2011 50.0% 33.12 n/a (49.6%) 2011 558.7 1,497.2 2,055.9 201.5 22.6 1,831.9 2,055.9 Profit & Loss (HK$mn) Sales Gross profit Pretax profit Net profit Cash Flow (HK$'000) Operating Cash flow Investing Cash flow Financing Cash flow Exchange gain Net cash flow Cash at the beginning Cash at the end Mr. Soyol Samdam Others 2009 1136.9 69.9 (450.6) (529.5) 2009 87.3 46.7 (99.1) (16.7) 34.9 80.2 98.4 2010 1,404.3 194.7 (106.3) (134.6) 2010 (74.5) (103.8) 293.5 3.5 115.3 98.4 217.2 2011 707.5 30.9 356.7 353.9 2011 (46.2) 0.656 5.8 3.9 (39.8) 217.2 181.4 * Financial year ends June 30. Stock data as of December 31, 2011 Source: Company data, Bloomberg, Eurasia Capital www.eurasiac.com 76
  • 78.
    Mongolia Outlook 2012 World’sFastest Growing Economy 31 January 2012 MODUN RESOURCES Eurasia Capital Call Modun Resources (MOU) is a Mongolia focused coal exploration company listed on ASX. Previously the company engaged in web based direct marketing and sales business under the name of TVN Corporation. The company’s name was changed to Modun Resources in November 2011 reflecting the company’s focus on Mongolia. In June 2011 the company entered into option agreement to acquire Nuurst coal project. The Nuurst Project has JORC compliant 489Mt of thermal coal resources under a 3,451 hectare exploration license located 120kms south of Ulaanbaatar and 6km from existing rail infrastructure. Key Stock Data Ticker Price (A$) 52 Wk high (A$) 52 Wk low (A$) Market cap (US$mn) Shares outstanding (mn) Avg d'ly turn'r (US$) Performance, y o y Valuation Ratios P/E P/E (2012f) P/B ROE ROA Share Price Performance, A$ SELL Dec 11 Oct 11 Nov 11 Sep 11 Jul 11 Aug 11 Jun 11 Apr 11 We believe that the strong economic growth in China and other emerging markets around the world which are creating increased demand for various commodities such as coal among others is expected to continue to do so in coming decades. As global engine of economic growth is shifting towards China and Asia resource companies such as Modun Resources are poised to take advantage of this growth given the positive exploration results and mineral reserves. n/a n/a 78.5 (249%) (217%) 0.08 0.07 0.06 0.05 0.04 0.03 0.02 0.01 0.00 May 11 Growth Outlook Jan 11 In July 2011, the company has placed 76 million shares at A$0.02 to raise A$1.52mn to fund the 100% acquisition of the Nuurst coal project. In the same month the company started its drilling program on Nuurst. Furthermore in August 2011, the company has also placed 90 million shares at A$0.04 to raise A$3.6mn for exploration activities. The drilling program on Nuurst project has been completed and JORC compliant 489mt of coal resource was announced in early December 2011. Feb 11 Mar 11 Recent Developments TVN:AU 0.045 0.071 0.009 34.5 767.9 399,000 350% Shareholders' Structure 4.97% 9.97% 3.74% 3.60% Warner Hugh RZJ Capital Management Gribble Anne Batavia Capital 77.72% Other shareholders Ratios and Growth Rates Net profit margin EPS (A$ cents) EPS growth rate Sales growth rate Balance Sheet (A$’000) Current asset Fixed asset Intangible asset Total asset Current liabilities Long term liabilities Shareholders' equity Total liabilities & equity 2009 n/a (0.19) n/a n/a 2009 631.2 2.9 2010 n/a (0.14) n/a n/a 2010 420.4 1.5 2011 n/a (0.22) n/a n/a 2011 449.1 7.1 634.1 33.3 421.9 39.4 456.2 59.2 600.8 634.1 382.5 421.9 397 456.2 Profit & Loss (A$’000) Sales Gross profit Operating profit Pretax profit Net profit Cash Flow (A$’000) Operating Cash flow Investing Cash flow Financing Cash flow Exchange gain Net cash flow Cash at the beginning Cash at the end 2009 n/a n/a (603.3) (603.3) (603.3) 2009 (529.8) (22.1) 6.7 2010 n/a n/a (501.5) (501.5) (501.5) 2010 (521.9) (545.2) 1,153 607.8 (240.9) 607.9 367 281 2011 n/a n/a (992.3) (992.3) (992.3) 2011 (928.5) (2.9) 960.1 (0.7) 28.6 367 394.9 * Financial year ends June 30. Stock data as of December 31, 2011 Source: Bloomberg, Eurasia Capital www.eurasiac.com 77
  • 79.
    Mongolia Outlook 2012 World’sFastest Growing Economy 31 January 2012 ERDENE RESOURCE DEVELOPMENT Eurasia Capital Call Formerly listed on the RSX Venture exchange under the symbol of ERD, Erdene Resource Development (The company) is a resource exploration and development company listed on the Toronto Stock Exchange with two core projects: the Donkin Coal Project (25%) in Nova Scotia with Xstrata Coal and the Zuun Mod Molybdenum Copper Project in Mongolia. Erdene also has numerous non core projects including kaolin and aggregate interests. The Company’s long term focus remains the discovery and development of large tonnage, low cost, gold, copper, molybdenum, and coal deposits in Mongolia; and the development of its coal and industrial mineral interests in North America. Key Stock Data Ticker Price (C$) 52 Wk high (C$) 52 Wk low (C$) Market cap (US$mn) Shares outstanding Avg d'ly turn'r (C$) Performance, y o y Valuation Ratios P/E P/E (2011f) P/B ROE ROA Share Price Performance, C$ BUY 1.5 1 0.5 The company operates a kaolin processing plant in Dearing, Georgia, USA through its subsidiary APM. In October 2011, APM announced the denial of its application to mine kaolin from its Cofer and surrounding properties. 2009 n/a n/a n/a n/a 2009 14,480.3 46,744.7 2010 n/a n/a n/a 240% 2010 9,249.2 46,744.7 3Q 2011 n/a n/a n/a 32.2% 3Q 2011 4,323.8 46,693.5 58,646.6 489.9 5,895.0 52,261.6 58,646.6 55,994.0 922.8 5,236.1 49,835.9 55,994.0 51,017.4 760.7 5,259.3 44,997.3 51,017.4 3 Dec 3 Oct 3 Nov 3 Sep 3 Jul 3 Jan Shareholders' Structure Growth Outlook Even though the JORC estimate carried out, the current market price of molybdenum is making the project not feasible. The share price has fallen down since its IPO in Canada due to the recent European debt crisis and slower growth of China’s economy. However on the upside the company owns 25% of Donkin Coal project which has a US$1.06bn NPV at 8% discount rate. The Company will continue its mineral exploration and development projects in Mongolia. Ratios and Growth Rates Net profit margin EPS (MNT) EPS growth rate Sales growth rate Balance Sheet (C$ ‘000) Current asset Fixed asset Intangible asset Total asset Current liabilities Long term liabilities Shareholders' equity Total liabilities & equity 3 Aug 0 Exploration work continued on the Tsenher Nomin property. Exploration work has identified unknown gold and base metal mineral occurrences and two drilling at Nomin Tal and Altan Nar, reporting the very encouraging initial results. 3 Jun Minarco MineConsult updated resource estimate of Zuun Mod project, representing a Measured and Indicated resource of 218Mt at an average grade of 0.057% Mo, and 0.069% Cu at a cut off grade of 0.04% Mo. This equates to 273.5 M lbs of contained Mo metal and 330.7 M lbs of contained Cu metal. n/a n/a 2.23 6.99% 6.22% 2 3 Apr In June, the Company announced the receipt of a National Instrument 43 101 complaint Technical Report for the Donkin Coal Project, showing the Pre Feasibility study. The resource and inferred resource is 227mn tonne and 254 mn tonne, respectively. 3 May The company completed the private placement financing announced on 16th November with the total proceeds of US$2.0mn to fund the exploration projects in Mongolia and for working capital. 3 Feb 3 Mar Recent Developments ERD:CN 0.375 1.84 0.31 33.15 90.32mn 108,844 69.7% Profit & Loss (C$ ‘000) Sales Gross profit Operating profit Pretax profit Net profit Cash Flow (C$ ‘000) Operating Cash flow Investing Cash flow Financing Cash flow Exchange gain Net cash flow Cash at the beginning Cash at the end 9% 2% 2% AGF Investments Inc Byrne John P Global Strategy Financial inc 88% other 2009 167.9 (3,569.6) 2010 526.5 (2,786.8) 3Q 2011 696.2 (254.0) (3,146.3) (2,177.0 2009 (3,651.7) 1,220.7 (4,509.7) (3,567.5) 2010 (3,360.0) (2,020.0) 150.0 (2,430.9) 16,195.1 13,764.1 (5,230.0) 13,764.1 8,379.2 (7,943.8) (7,951.3) 3Q 2011 (3,545.6) (1,522.1) 440.2 43.8 (4,583.7) 8,379.2 3,795.5 Stock data as of December 31, 2011 Source: Bloomberg, Eurasia Capital www.eurasiac.com 78
  • 80.
    Mongolia Outlook 2012 World’sFastest Growing Economy 31 January 2012 NORTH ASIA RESOURCES HOLDINGS Eurasia Capital Call North Asia Resources (NAR), previously known as Green Global Resource Ltd., is a Hong Kong listed mineral exploration and development company with main operations in Mongolia. NAR owns a 99.99% interest in Golden Pogada LLC, which holds a mining right license for a 12.01 square km iron ore mine (Oyut Ovoo Mine) located in south central Mongolia. Dadizi Yuan LLC, a wholly owned subsidiary of the Group, holds mining and exploration licenses in respect of two alluvial gold mines, located in Khar Yamaat Khongor and Sharin Gol Soum of Darkhan Uul aimag, Mongolia. Key Stock Data Ticker 61:HK Price (HK$) 0.22 52 Wk high (HK$) 1.36 52 Wk low (HK$) 0.2 Market cap (US$mn) 32.52 Shares outstanding (mn) 1,138.01 Avg d'ly turn'r 6M (US$mn) 0.05 Performance, y o y 75.6% Valuation Ratios P/E Earnings Yield P/B 0.2 ROE ROA Share Price Performance, HK$ UNDER REVIEW Dec 11 Oct 11 Nov 11 Sep 11 Jul 11 Aug 11 Jun 11 We are cautious about NAR’s ability to ramp up production significantly in near term. Apr 11 Growth Outlook May 11 On May 25, 2011 the company terminated a framework agreement for the acquisition of two additional iron mines in Mongolia. NAR did not complete any acquisitions of mining and resources businesses during 2Q 2011. 1.6 1.4 1.2 1 0.8 0.6 0.4 0.2 0 Mar 11 The company produced approximately 13,000 tonnes of iron ore products during the trial production phase up to 30 June 2011, however, didn’t sale any iron ore products. The raw alluvial gold previously recovered from the Gold Mines during the trial production in 2010 was successfully sold during the period. The gold was weighed and made into 5kg gold bars which were sold to the Trade and Development Bank of Mongolia. Jan 11 In June 2011, NAR’s non wholly owned Mongolian subsidiary, Global Link Logistics LLC, entered into a coal transportation agreement with a Mongolian coal mining company, whereby Global Link has agreed to transport coal products from one of its coal mines to the unloading station near the Gants Mod border using heavy duty trucks. Feb 11 Recent Developments Shareholders' Structure ULTRA ASSET INTL LTD MOUNTAIN SKY RES MON KONG XIANGHU 16% GREAT METAL GROUP CO TAK CHEUNG YAM 14% 52% CHEN YUN 8% DIMENSIONAL FUND ADV TSE MICHAEL NAM 4% 1% Ratios and Growth Rates Net profit margin EPS (pence) Gross profit margin Sales growth rate Balance Sheet (US$mn) Current asset Fixed asset Total asset Total liabilities Shareholders' equity Total liabilities & equity 2009 2010 17.9% 2009 34.3 2.8 572.9 85.5 487.4 572.9 38.4% 2010 40.7 13.3 220.8 62.9 157.9 220.8 3Q 2011 3Q 2011 Profit & Loss (US$mn) Revenue Gross profit Pretax profit Net profit Cash Flow (US$mn) Operating Cash flow Investing Cash flow Financing Cash flow Exchange gain Cash at the beginning Cash at the end 2% 2% Others 1% 2009 6.6 1.6 4.1 24.0 2009 1.1 0.6 0.5 2010 4.1 1.3 391.2 387.4 2010 4.8 12.3 55.1 3Q 2011 1.4 0.1 0.1 39.3 39.3 4.2 3Q 2011 5.2 5.1 4.9 Stock data as of December 31, 2011 Source: Company data, Bloomberg, Eurasia Capital www.eurasiac.com 79
  • 81.
    Mongolia Outlook 2012 World’sFastest Growing Economy 31 January 2012 CONTACTS Research Sardor Koshnazarov Dosbergen Musaev Akmal Aminov Rentsendorj Yondon Head of Research, Oil & Gas Chief economist Associate, Metals & Mining Associate, Mongolia Equities sardor.koshnazarov@eurasiac.com dosbergen.musaev@eurasiac.com akmal.aminov@eurasiac.com rentsendorj.yondon@eurasiac.com Sales and Trading Zhyldyz Sadyralieva Hoosniddin Hakimov Bolor Ulziisaikhan Narantsatsral Batgerel Associate Associate Associate Broker zhyldyz.sadyralieva@eurasiac.com hoosniddin.hakimov@eurasiac.com bolor.ulziisaikhan@eurasiac.com narantsatsral.batgerel@eurasiac.com Addresses: MONGOLIA th Suite 65, 6 Floor, Grand Office Center st Jamiyangun Street 12, 1 Khoroo, Ulaanbaatar Tel: +976 7013 0078 Fax: +976 7013 0078 Eurasia Capital is the leading investment bank, focused on Mongolia and other resource rich Asian countries. The Firm provides capital raising, cross border M&A advisory, sales & trading and research services. Eurasia Capital offers its services to its international and regional clients including government organizations, sovereign wealth funds, resource companies, private equity groups and global portfolio investors. The Firm has major emphasis on resources sector, including key commodities such as gold, copper, coal, iron ore and oil & gas. For more info, please visit our website: www.eurasiac.com DISCLAIMER This report is made for information purposes only, and does not constitute an offer, solicitation of an offer to purchase, hold, sell, invest or make any other financial decision. In making decisions, investors may rely on their own examinations of the parties and risks involved. Information contained in this report is obtained from the sources believed to be accurate and reliable. Because of the possibility of human or mechanical error as well as other factors such information provided 'as is" without warranty of any kind and Eurasia Capital Ltd., in particular, make no representation or warranty, express or implied, as to accuracy, timeliness, completeness, merchantability or fitness for any particular purpose of any such information. Under no circumstances, Eurasia Capital Ltd. have any liability to any person or entity ( ies) for (a) any loss or damage in whole or in part caused by, resulting from, or relating to, any error (negligible or otherwise) or other circumstances or contingency within or outside the control of any of their directors, managements, officers, employees, or agents in connection with compilation, analysis, interpretation, communication, publication or delivery of any such information, or (b) any direct, indirect, special, consequential, compensatory or incidental damages whatsoever (including without limitation, loss profits) even if Eurasia Capital Ltd. is advised in advance of the possibility of such damages, resulting from the use of or inability to use, any such information. ©2012 Eurasia Capital Ltd. All rights reserved. www.eurasiac.com 80