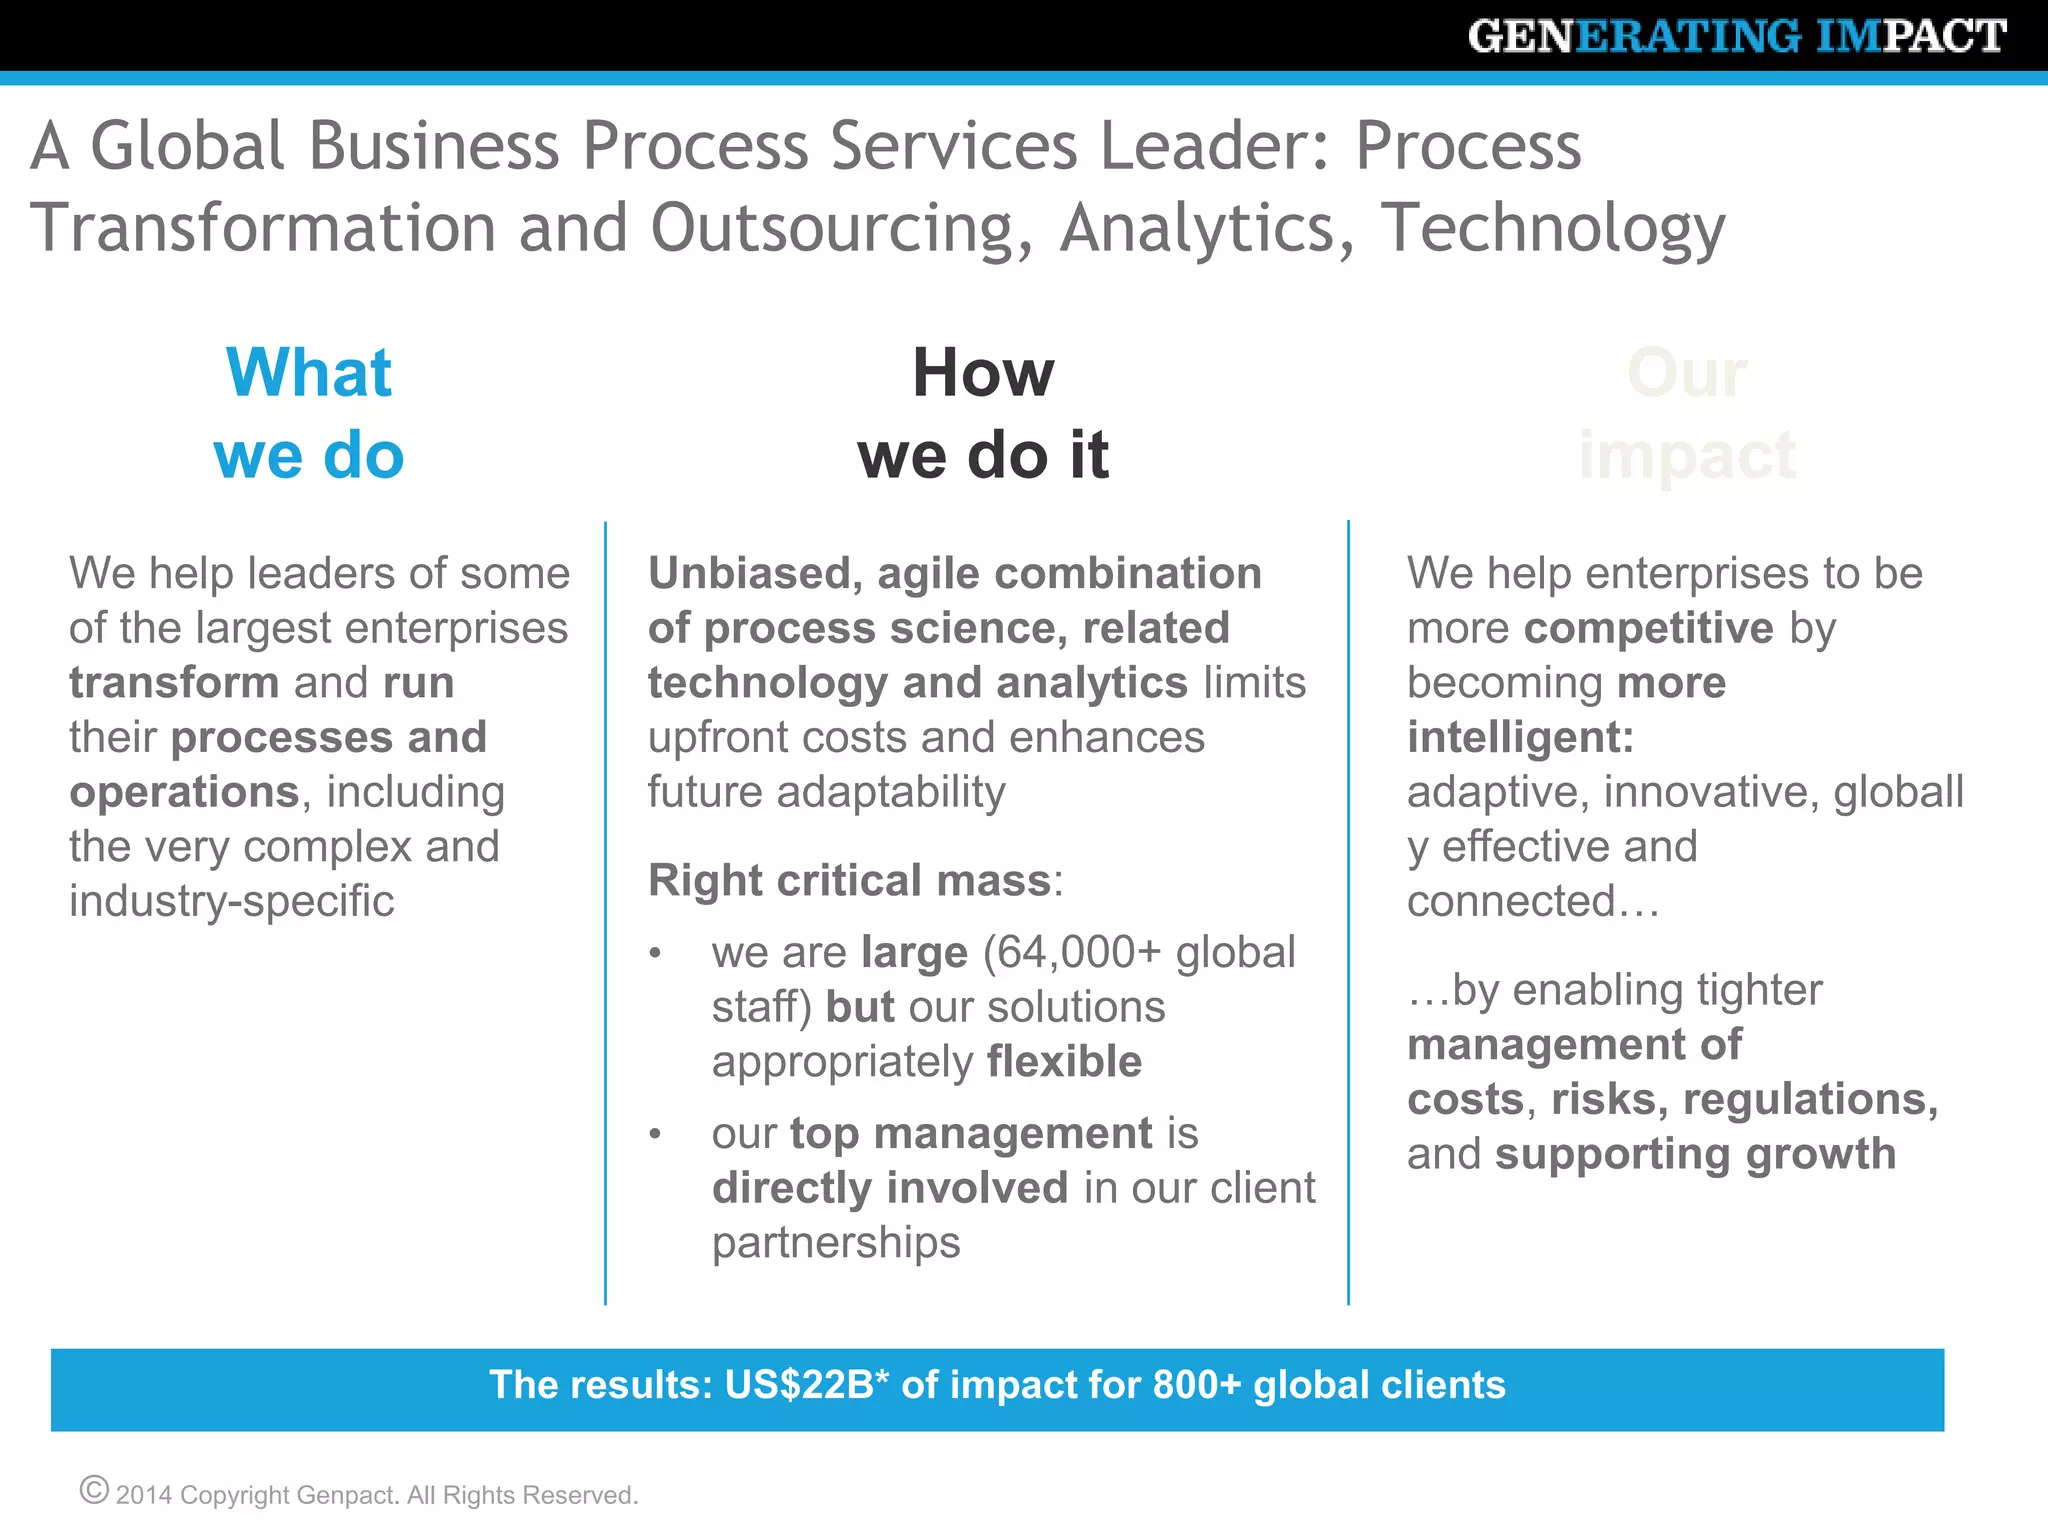
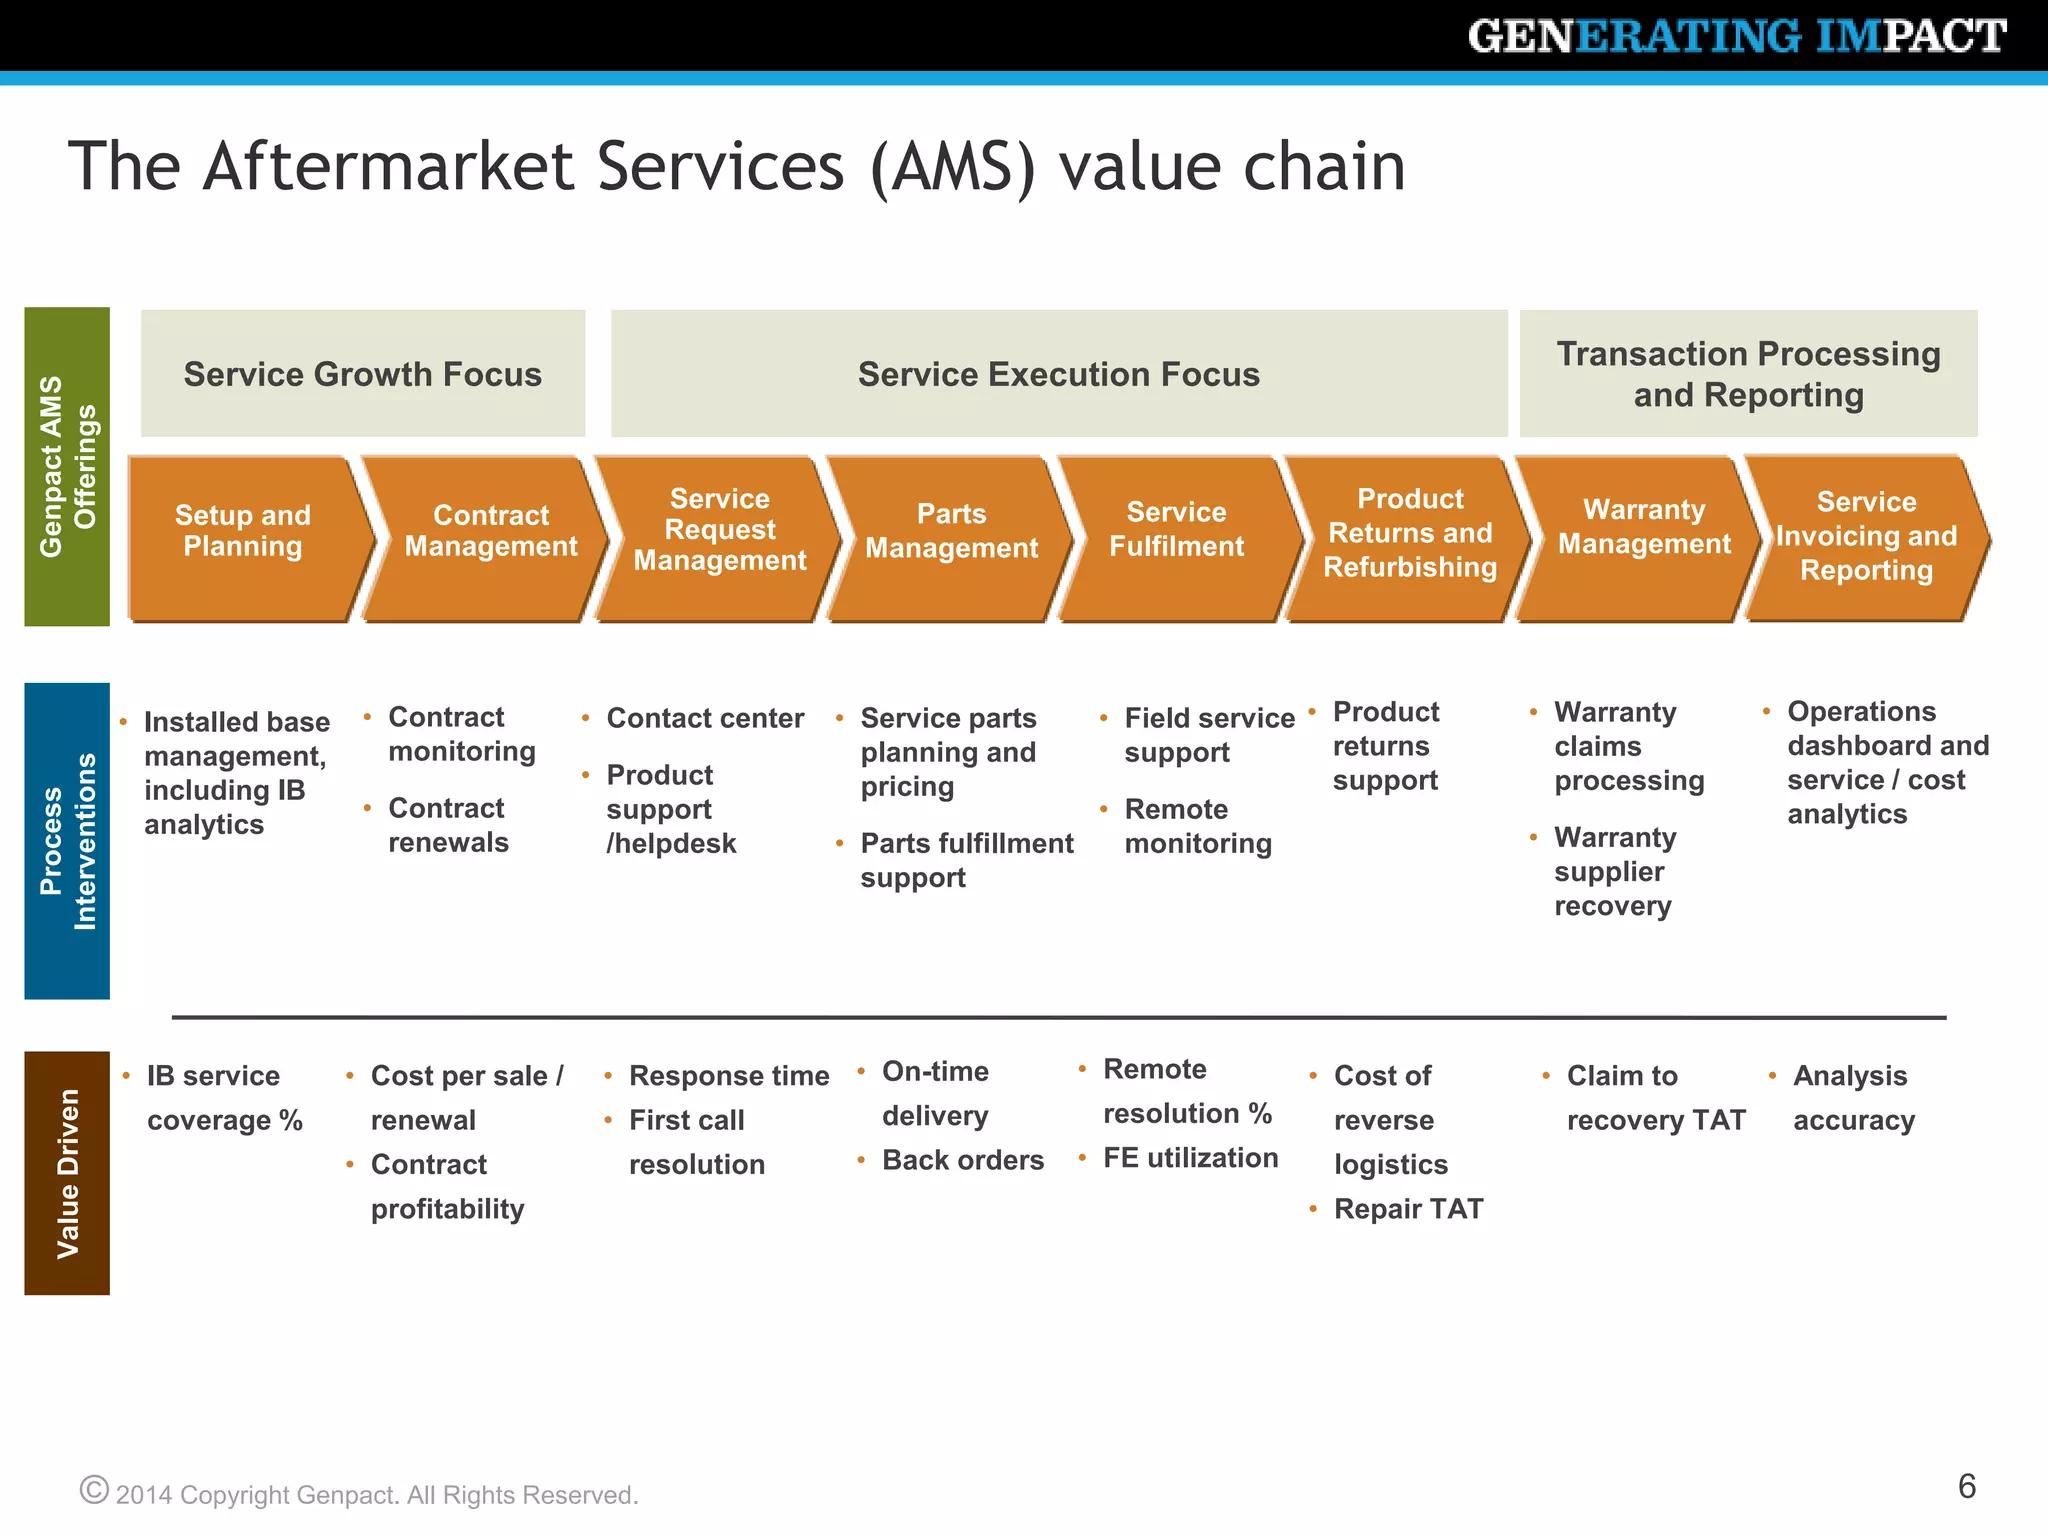
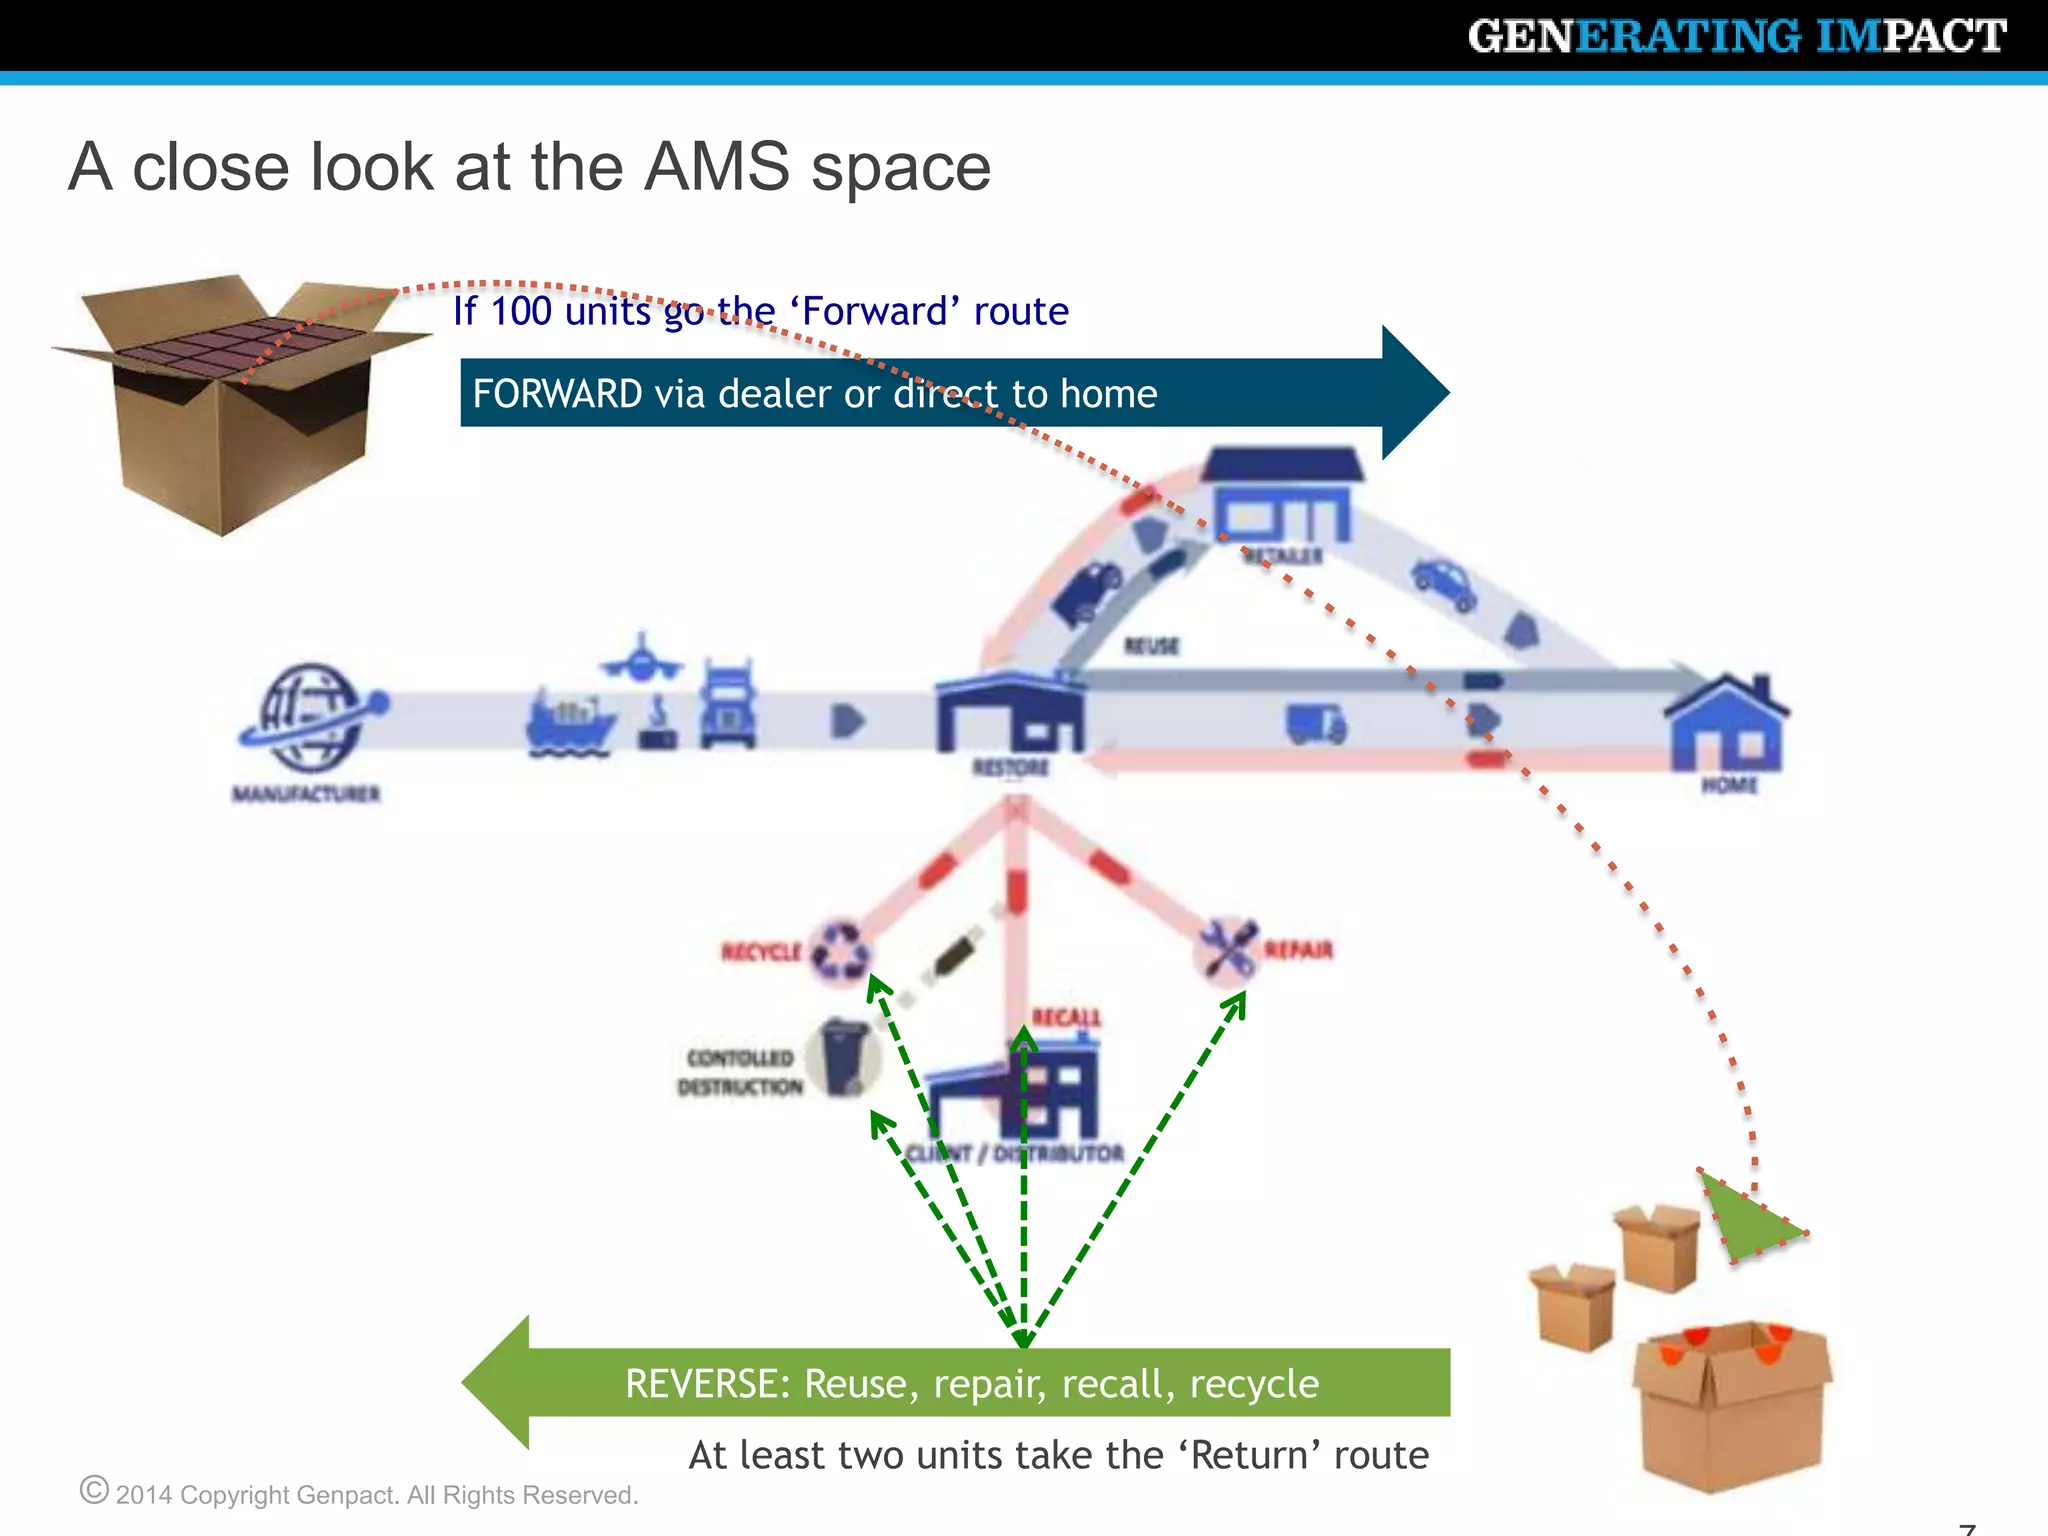
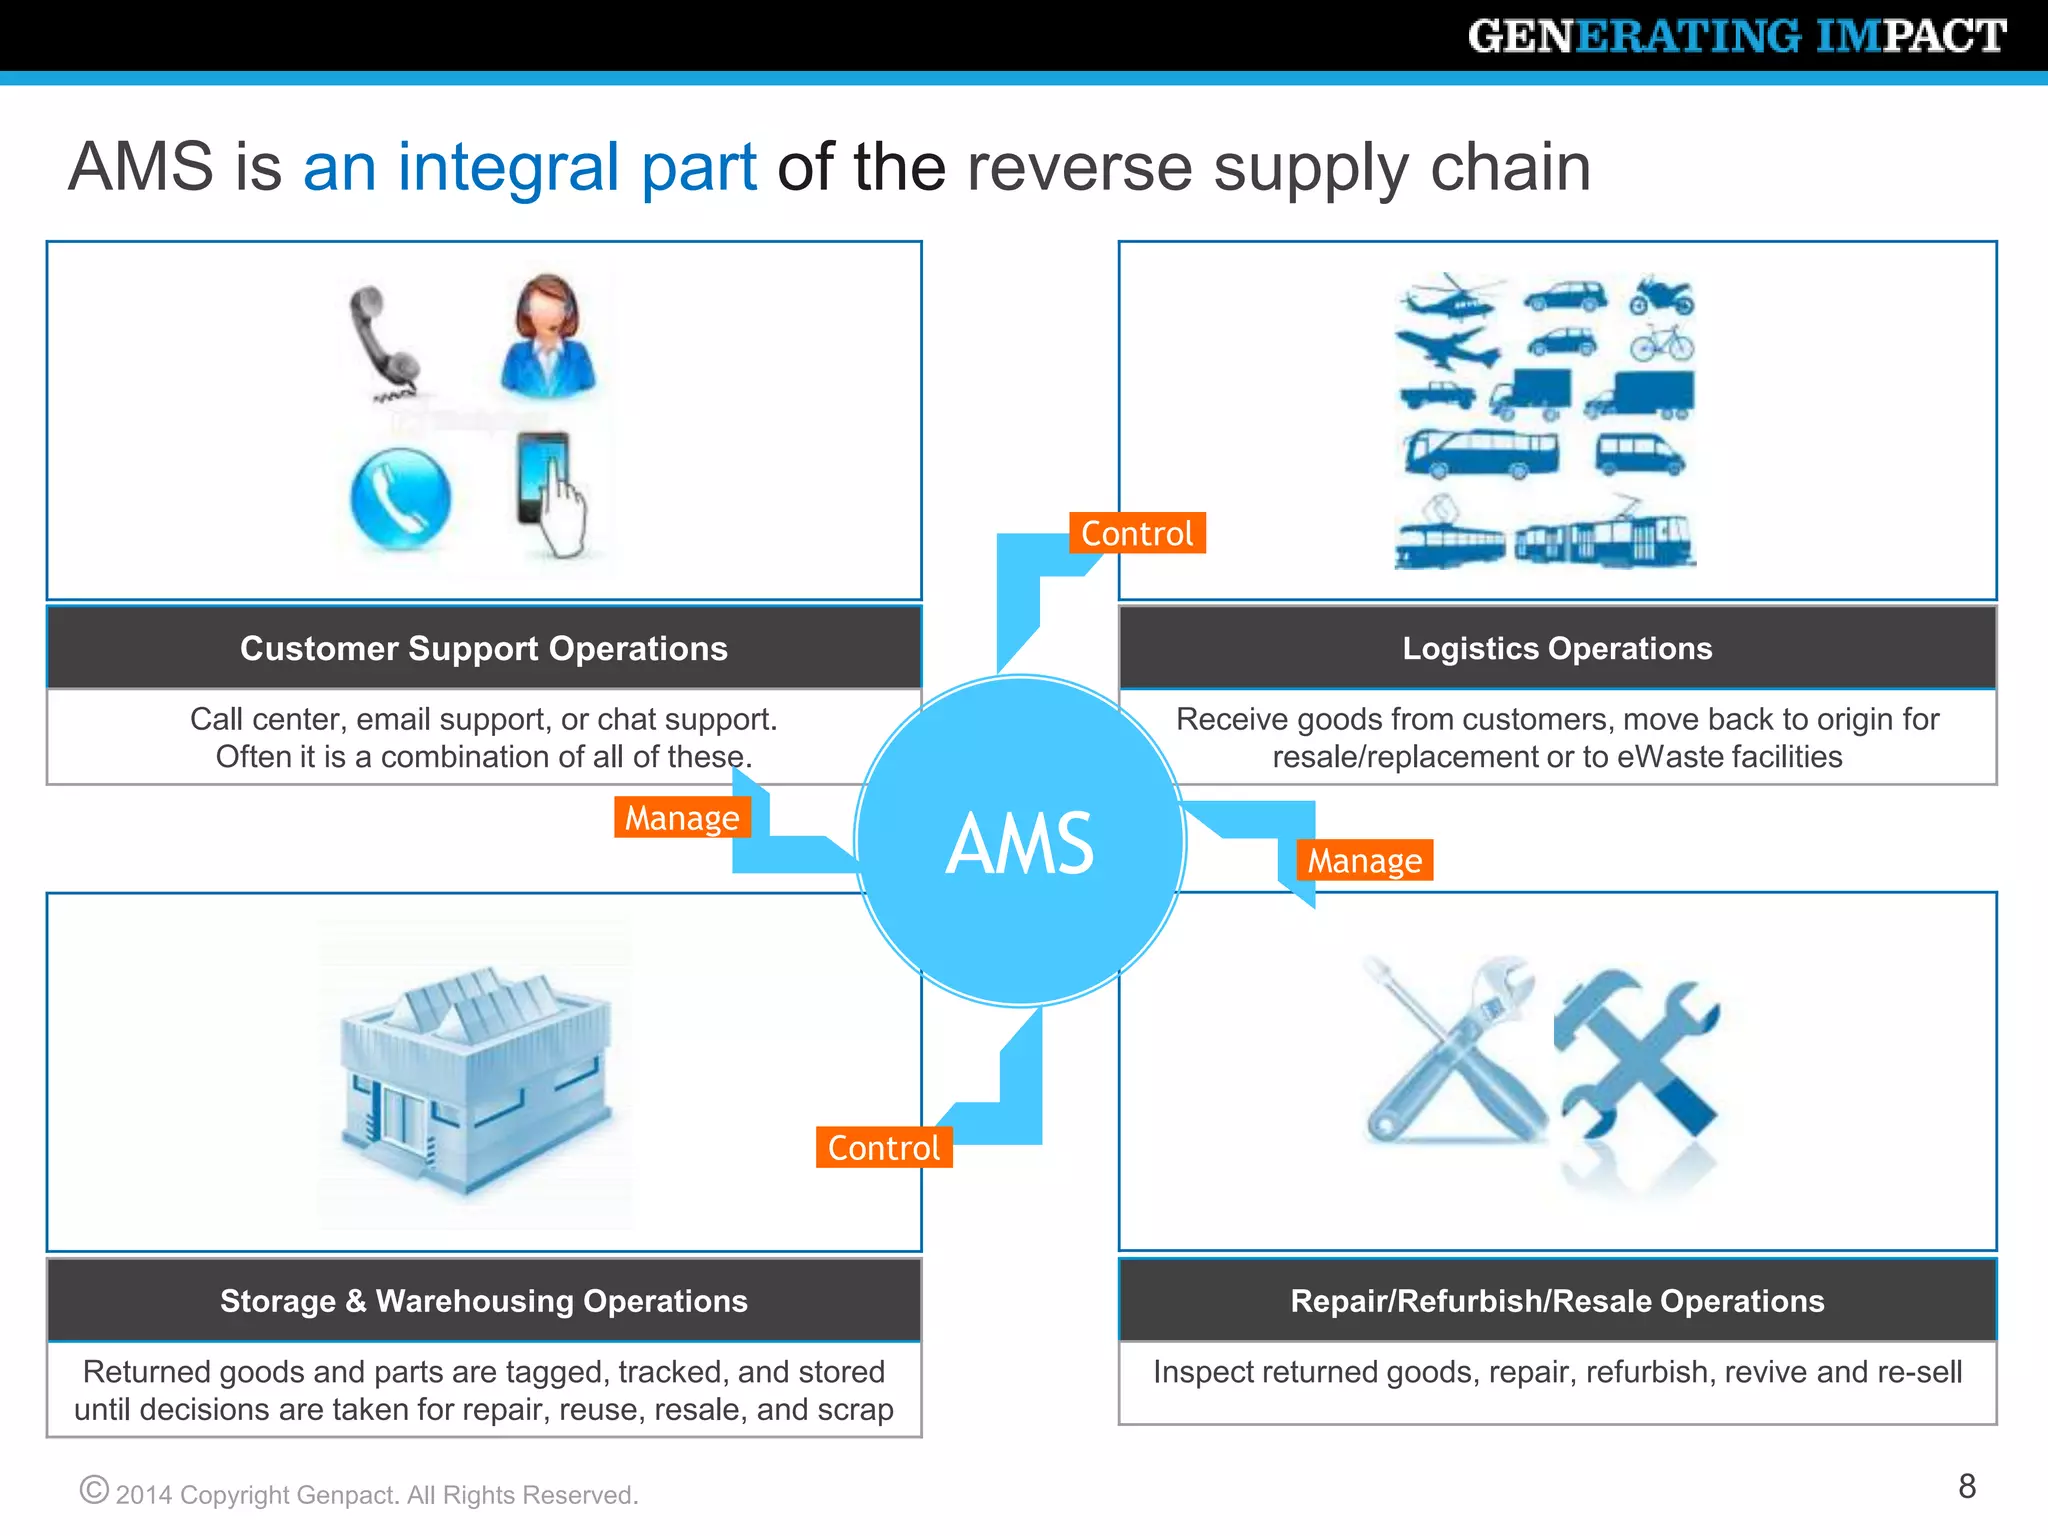
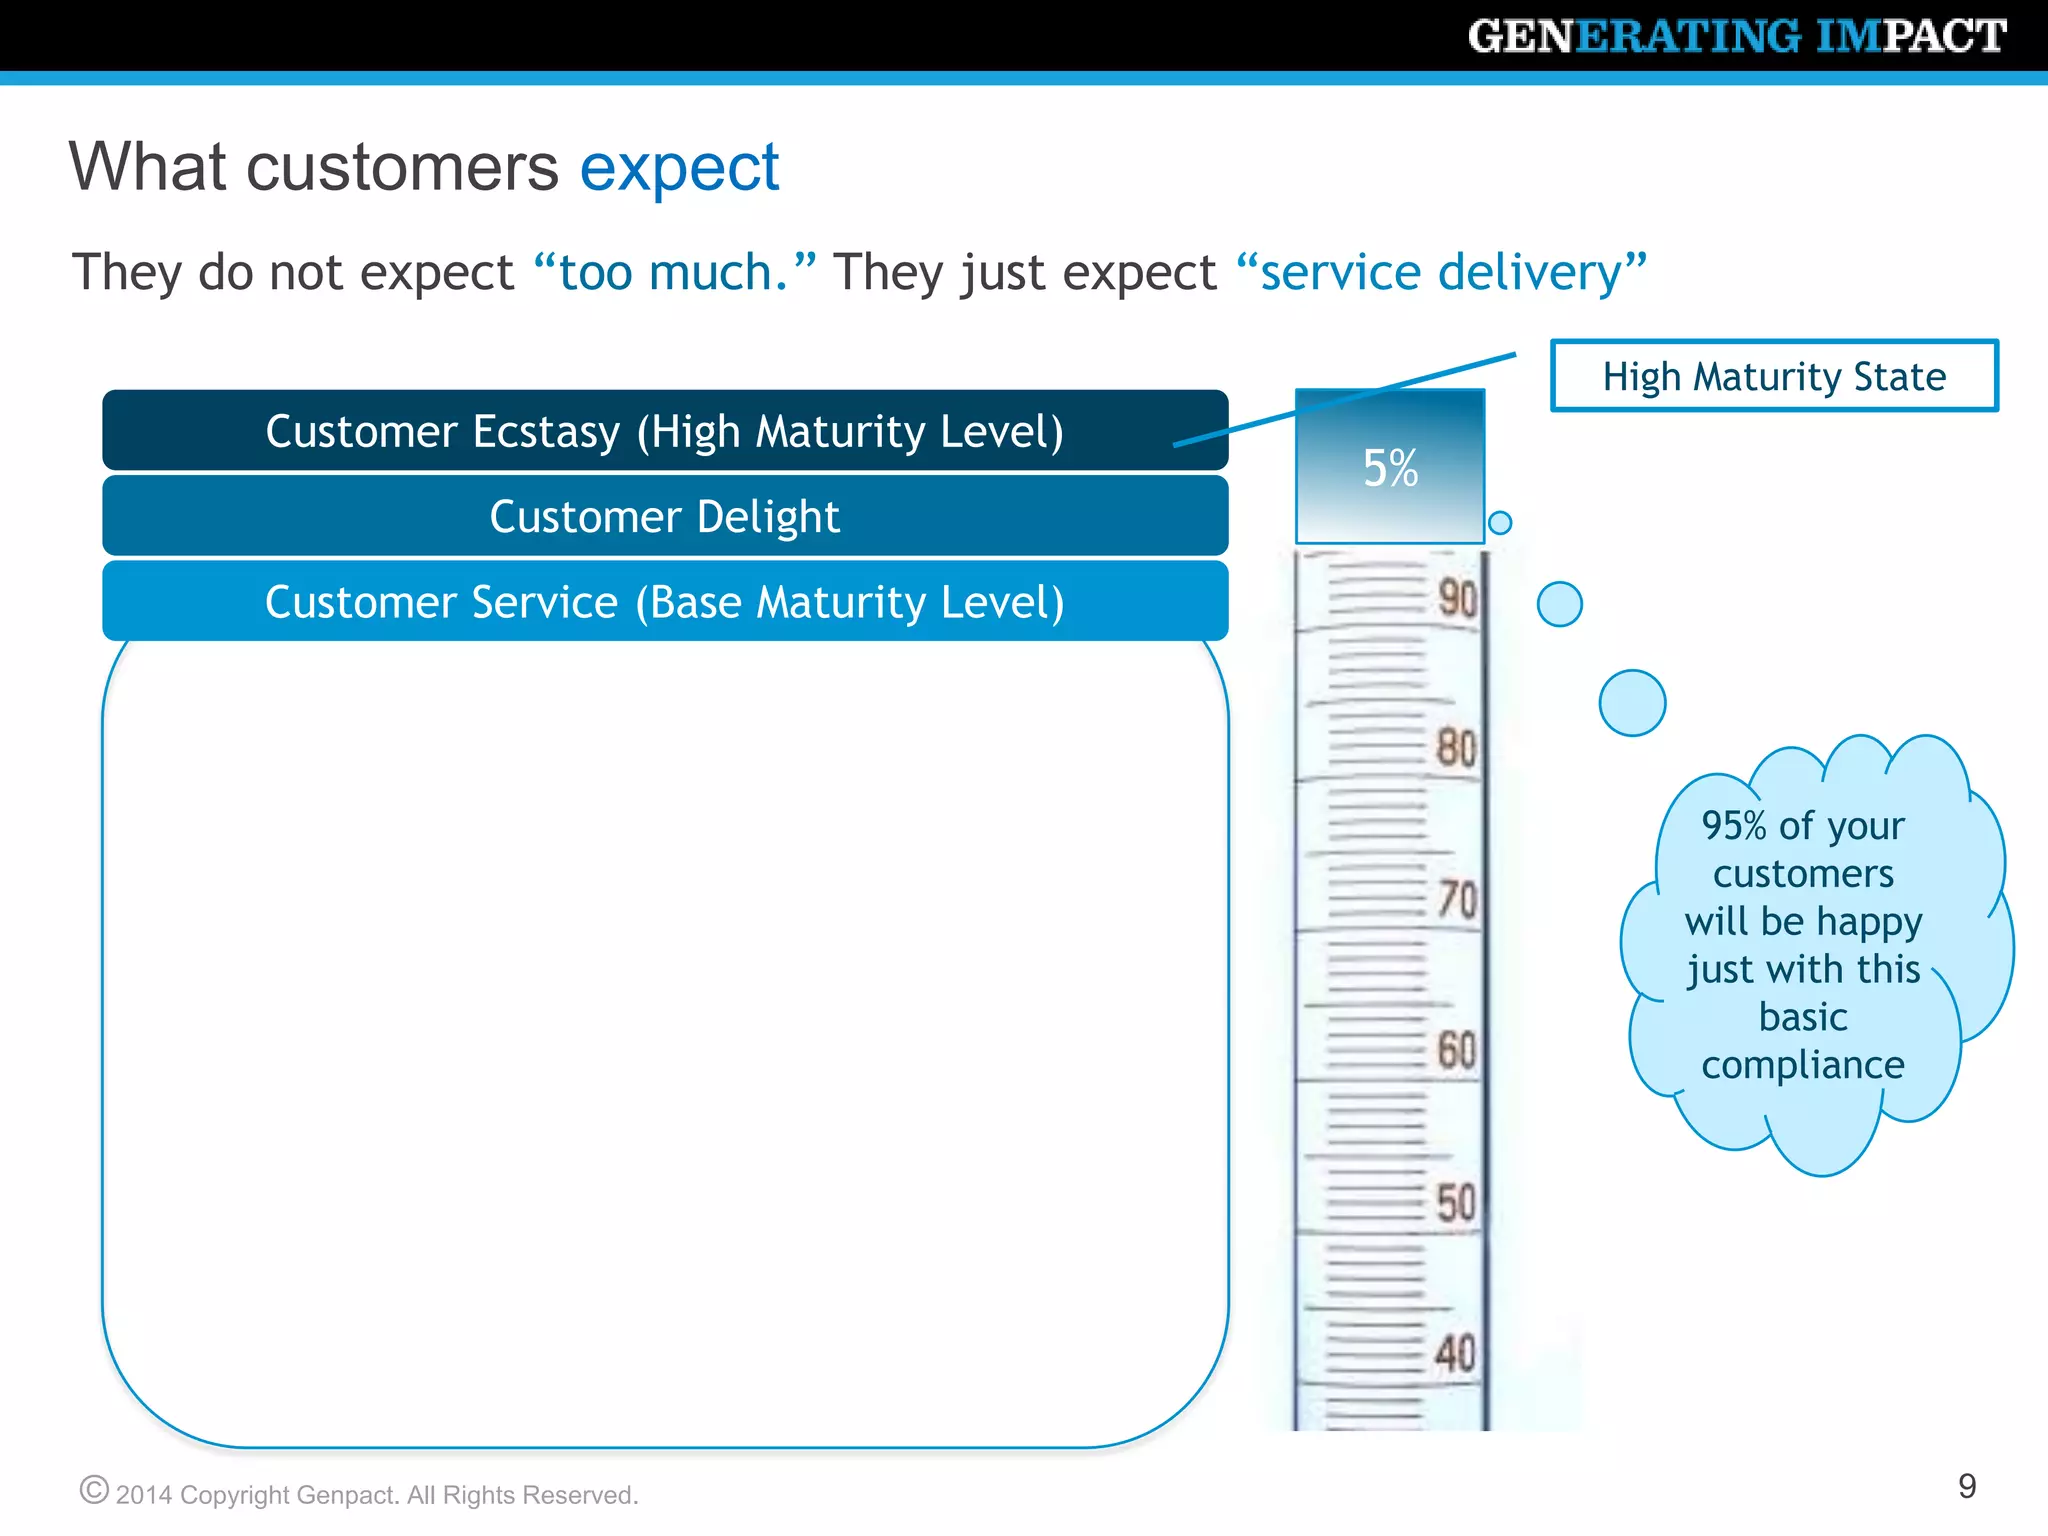
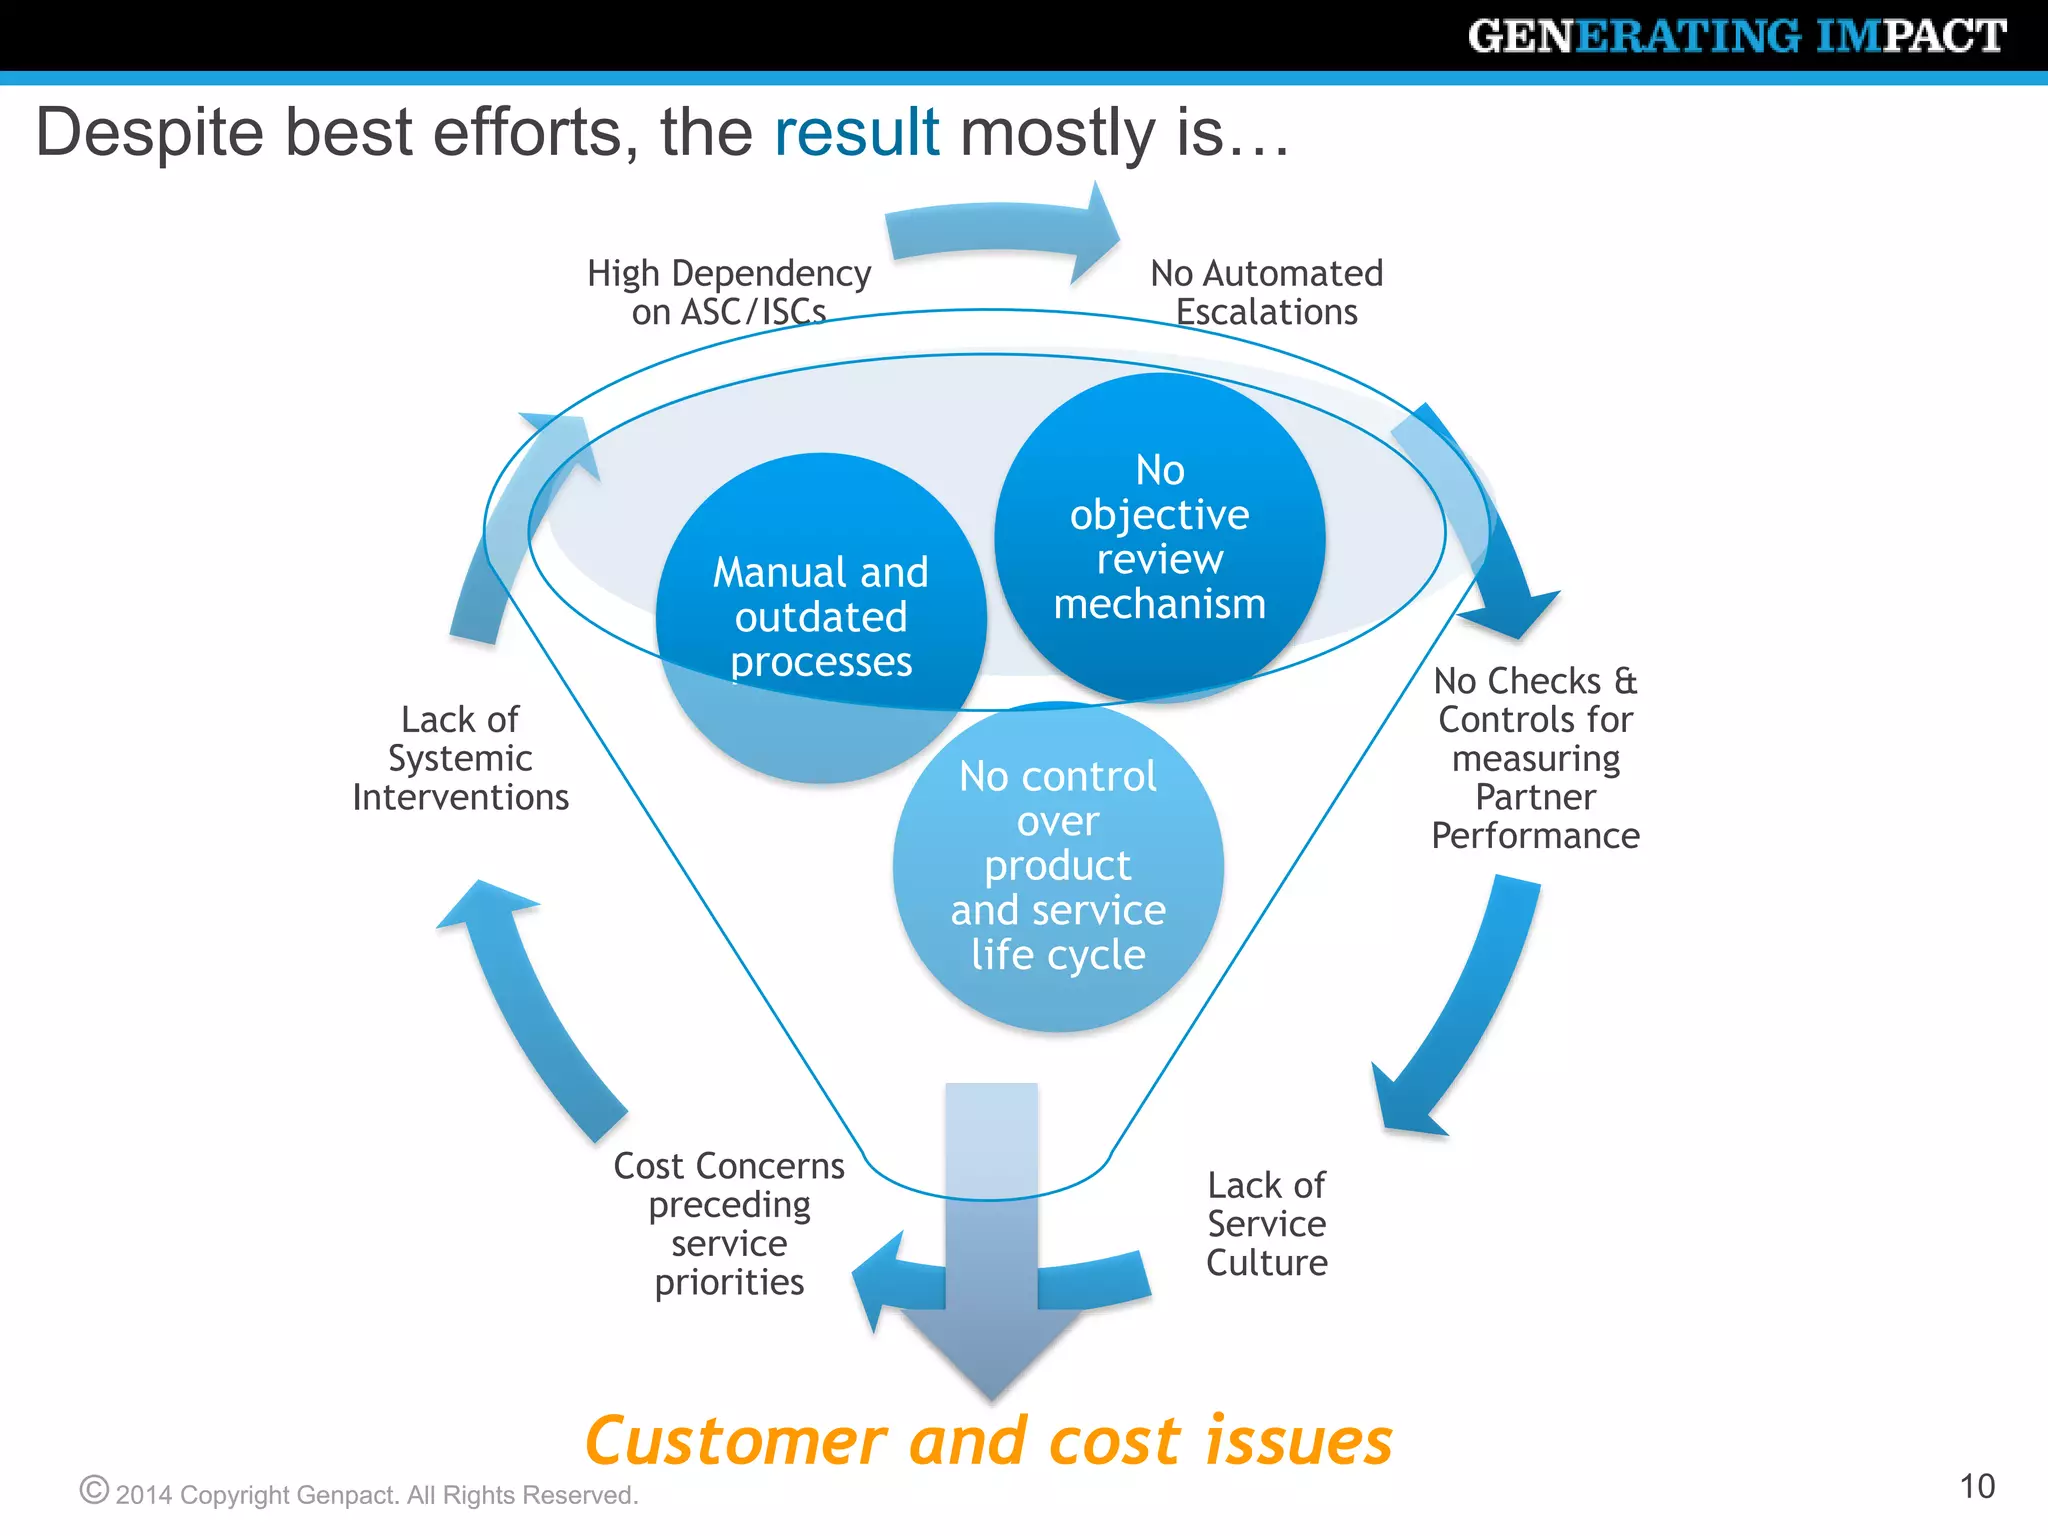
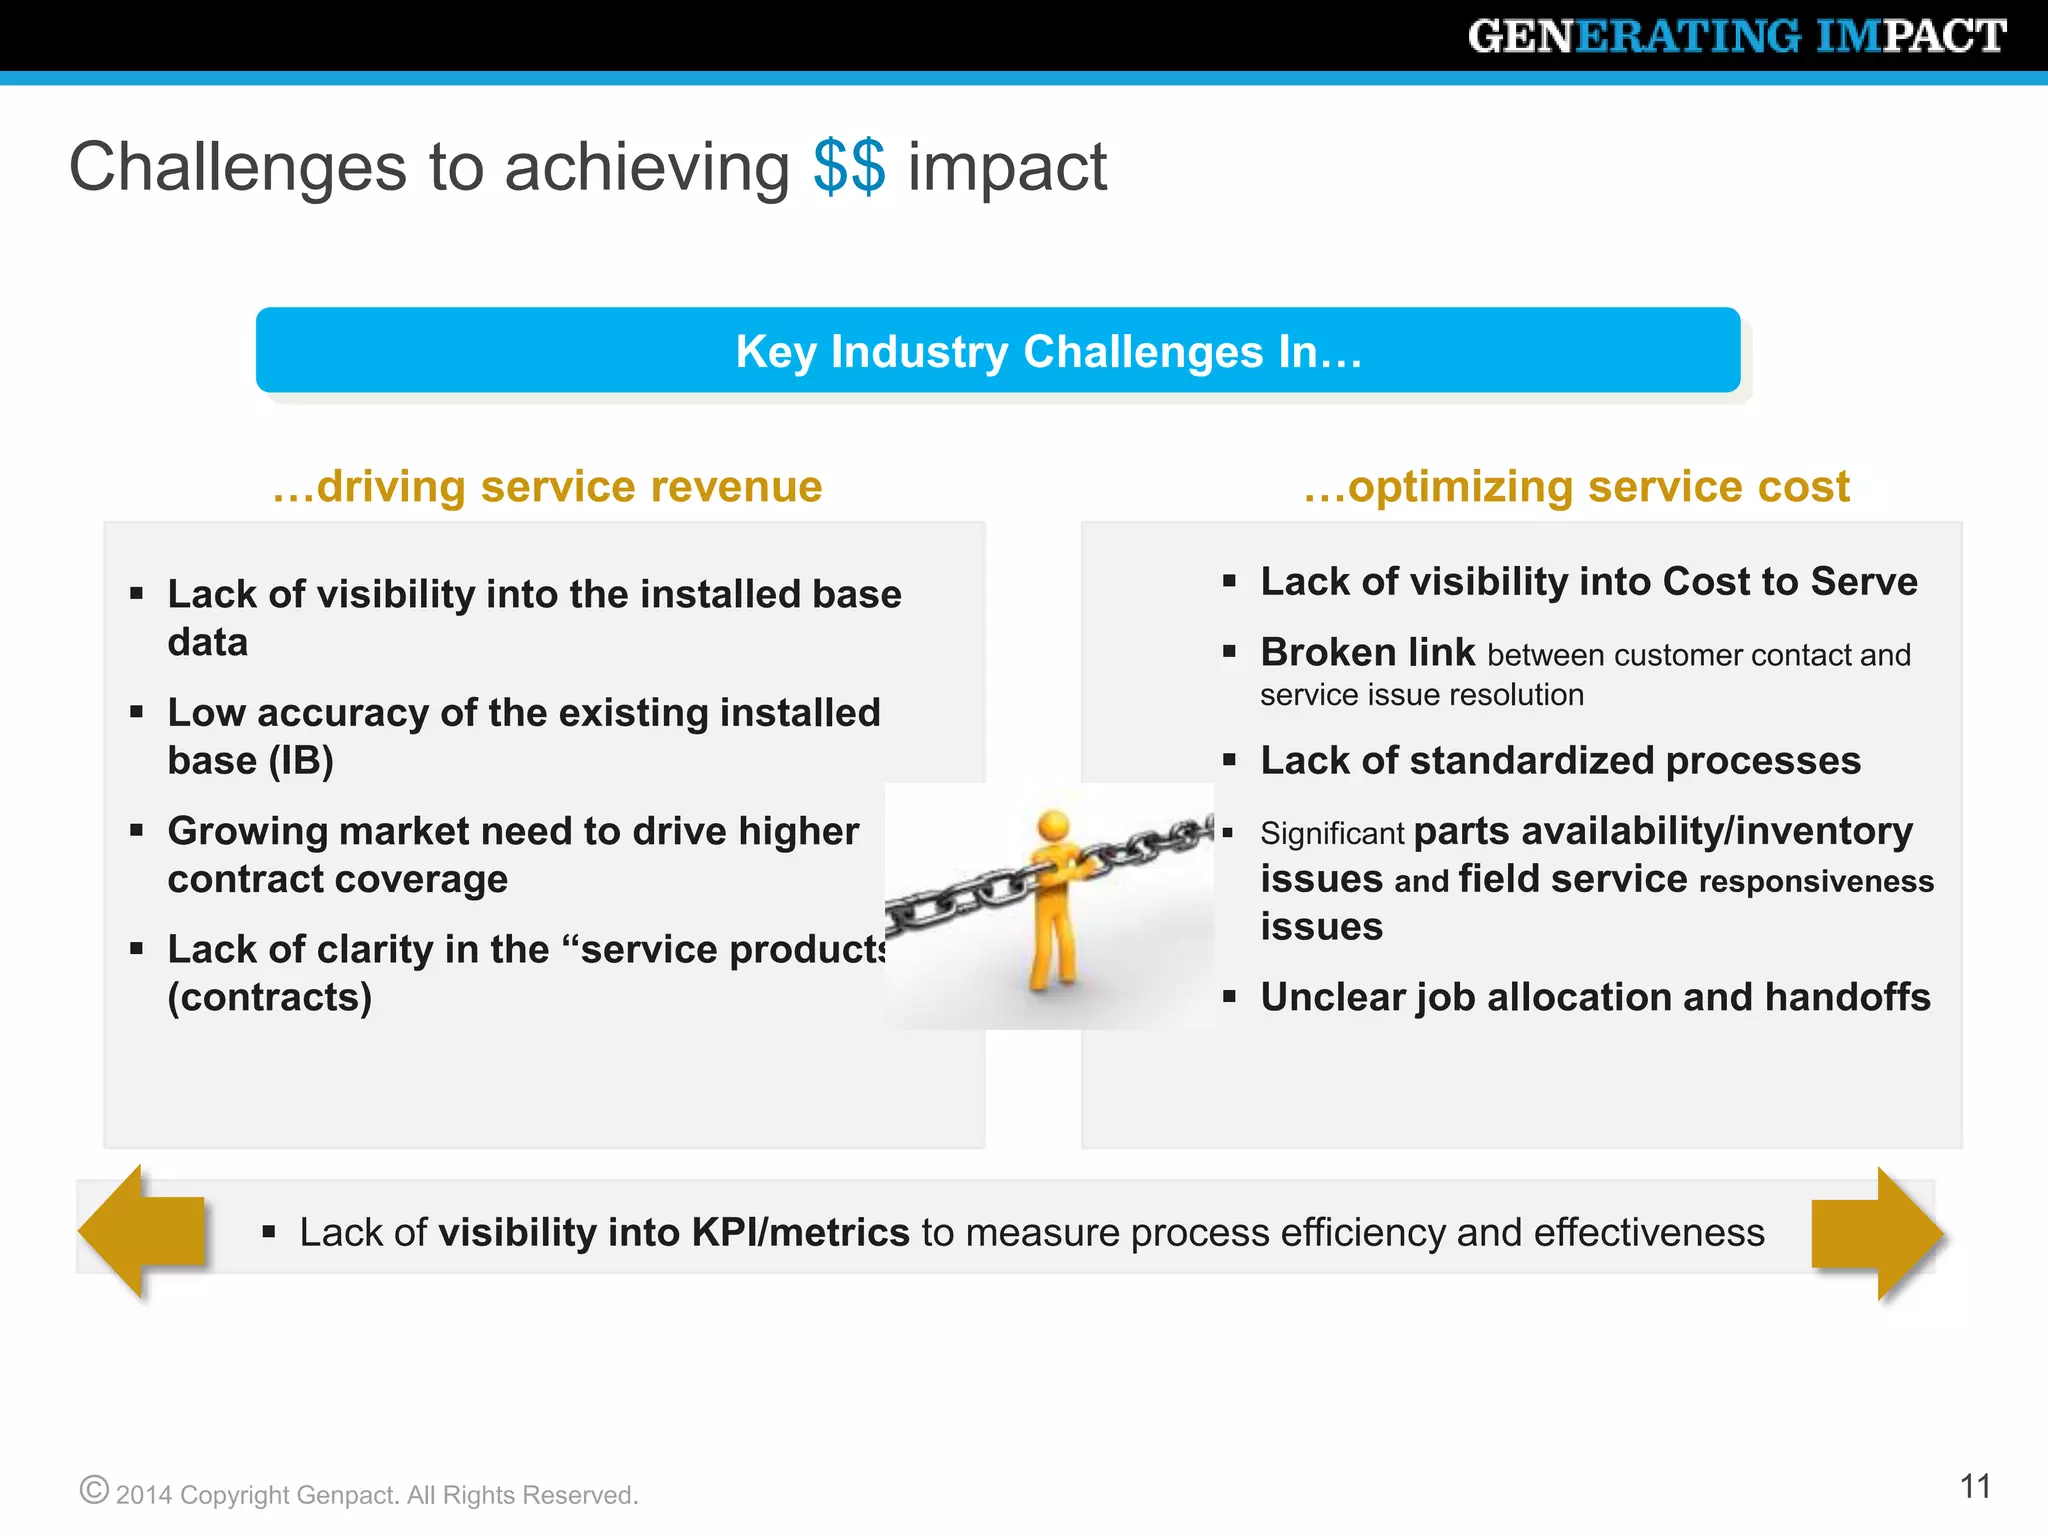
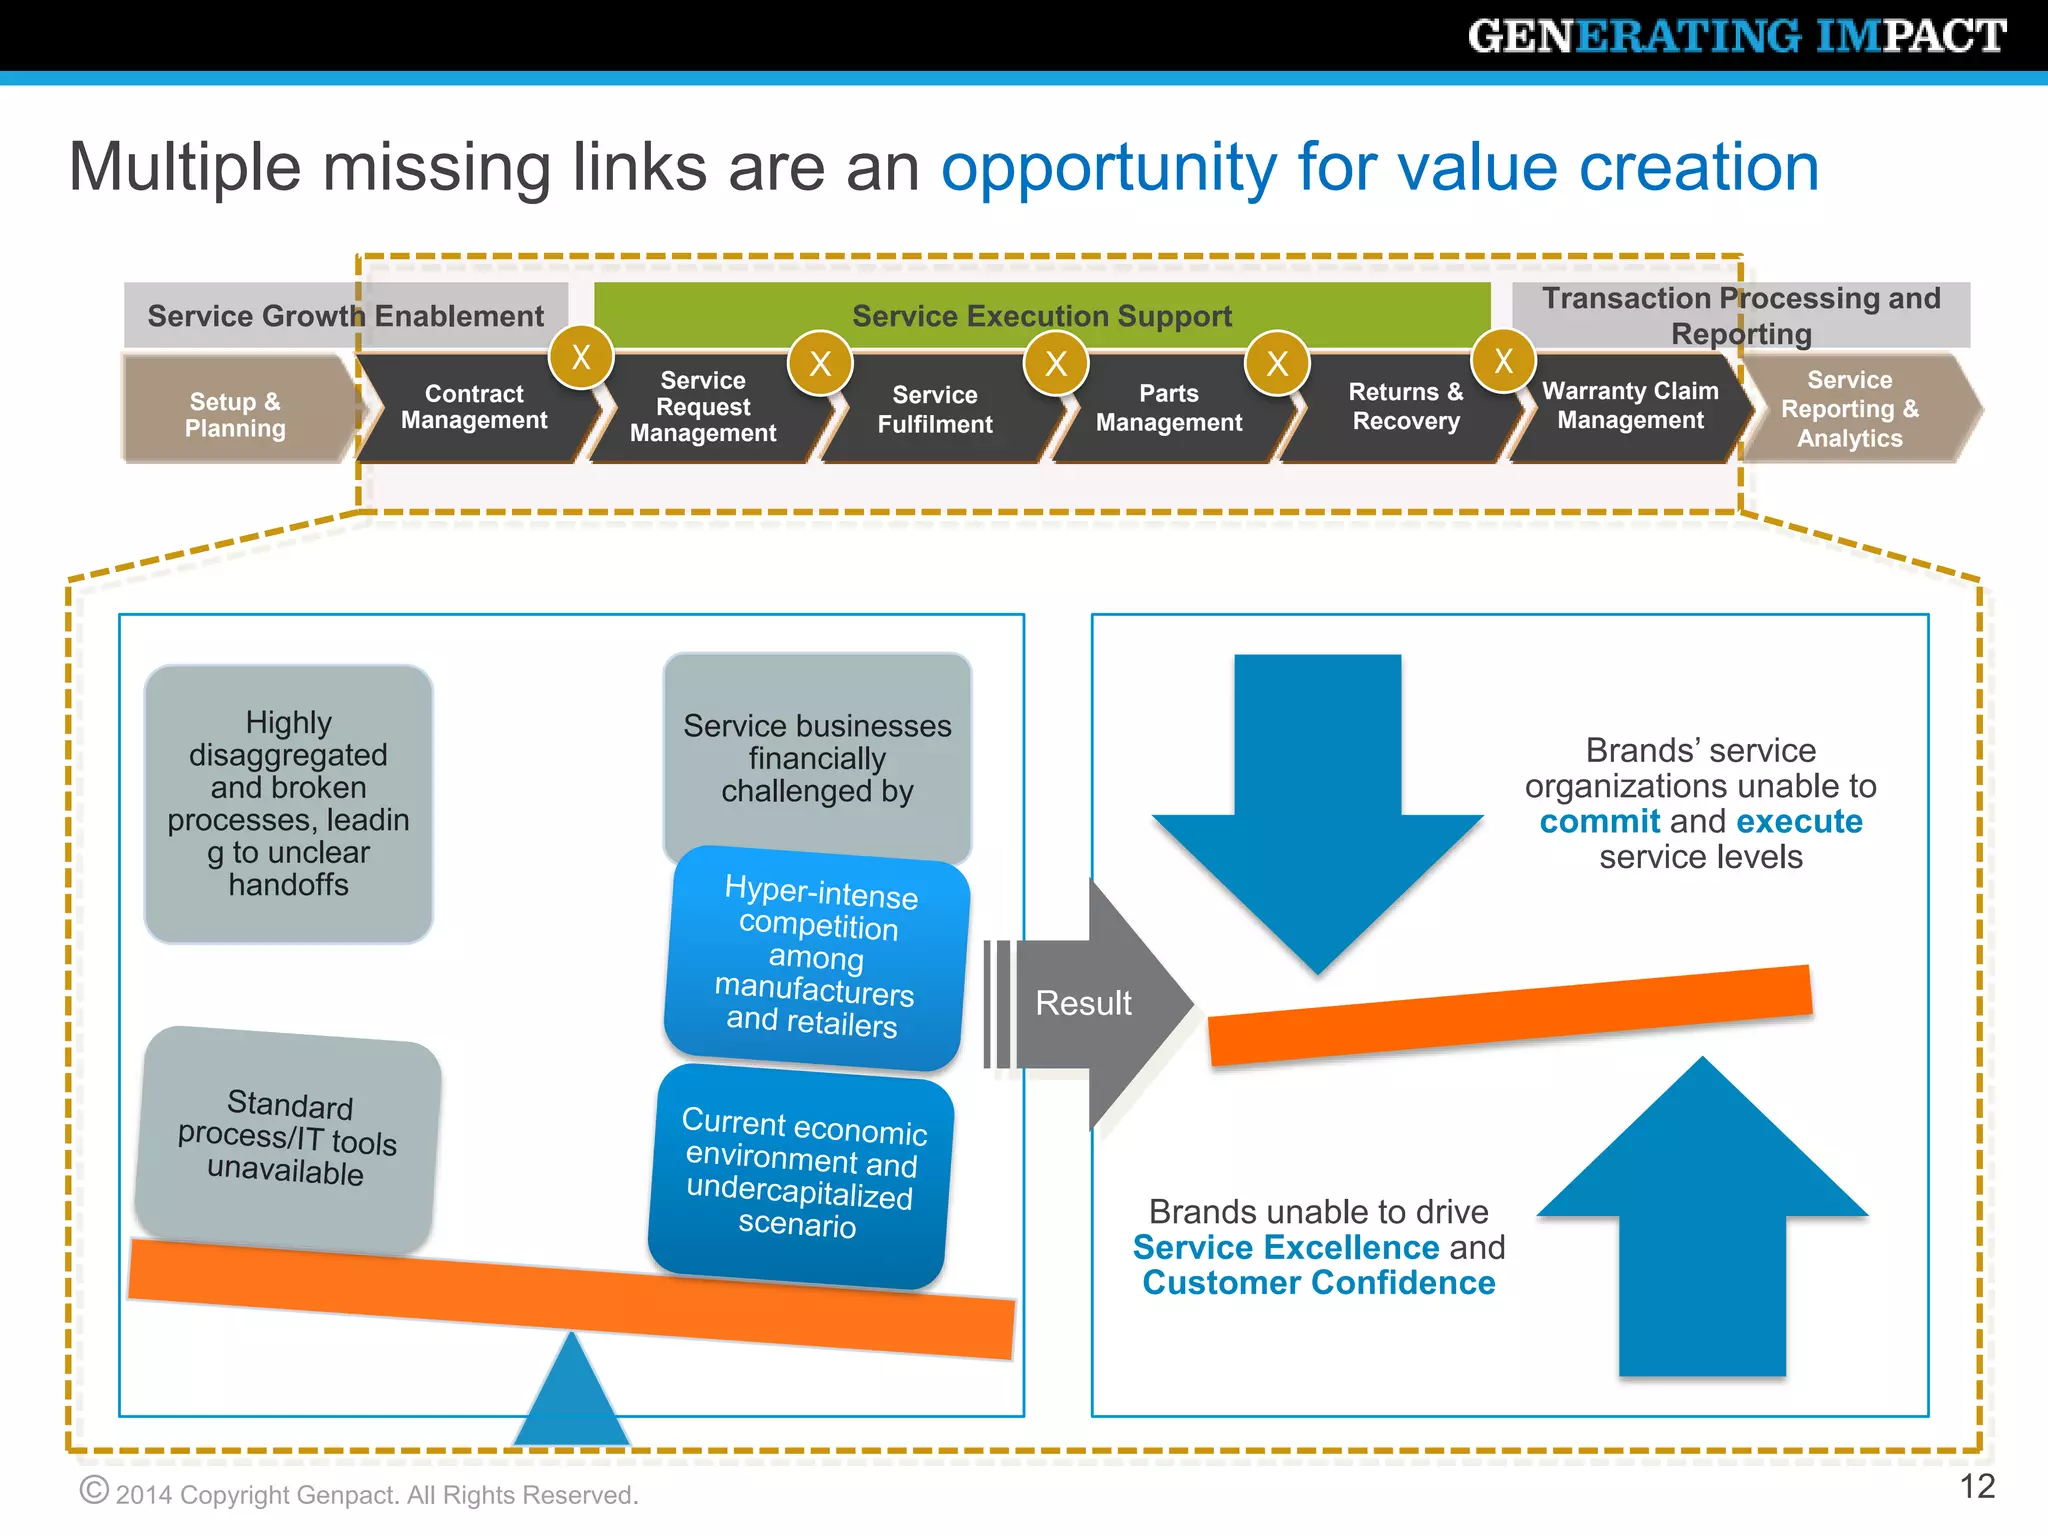
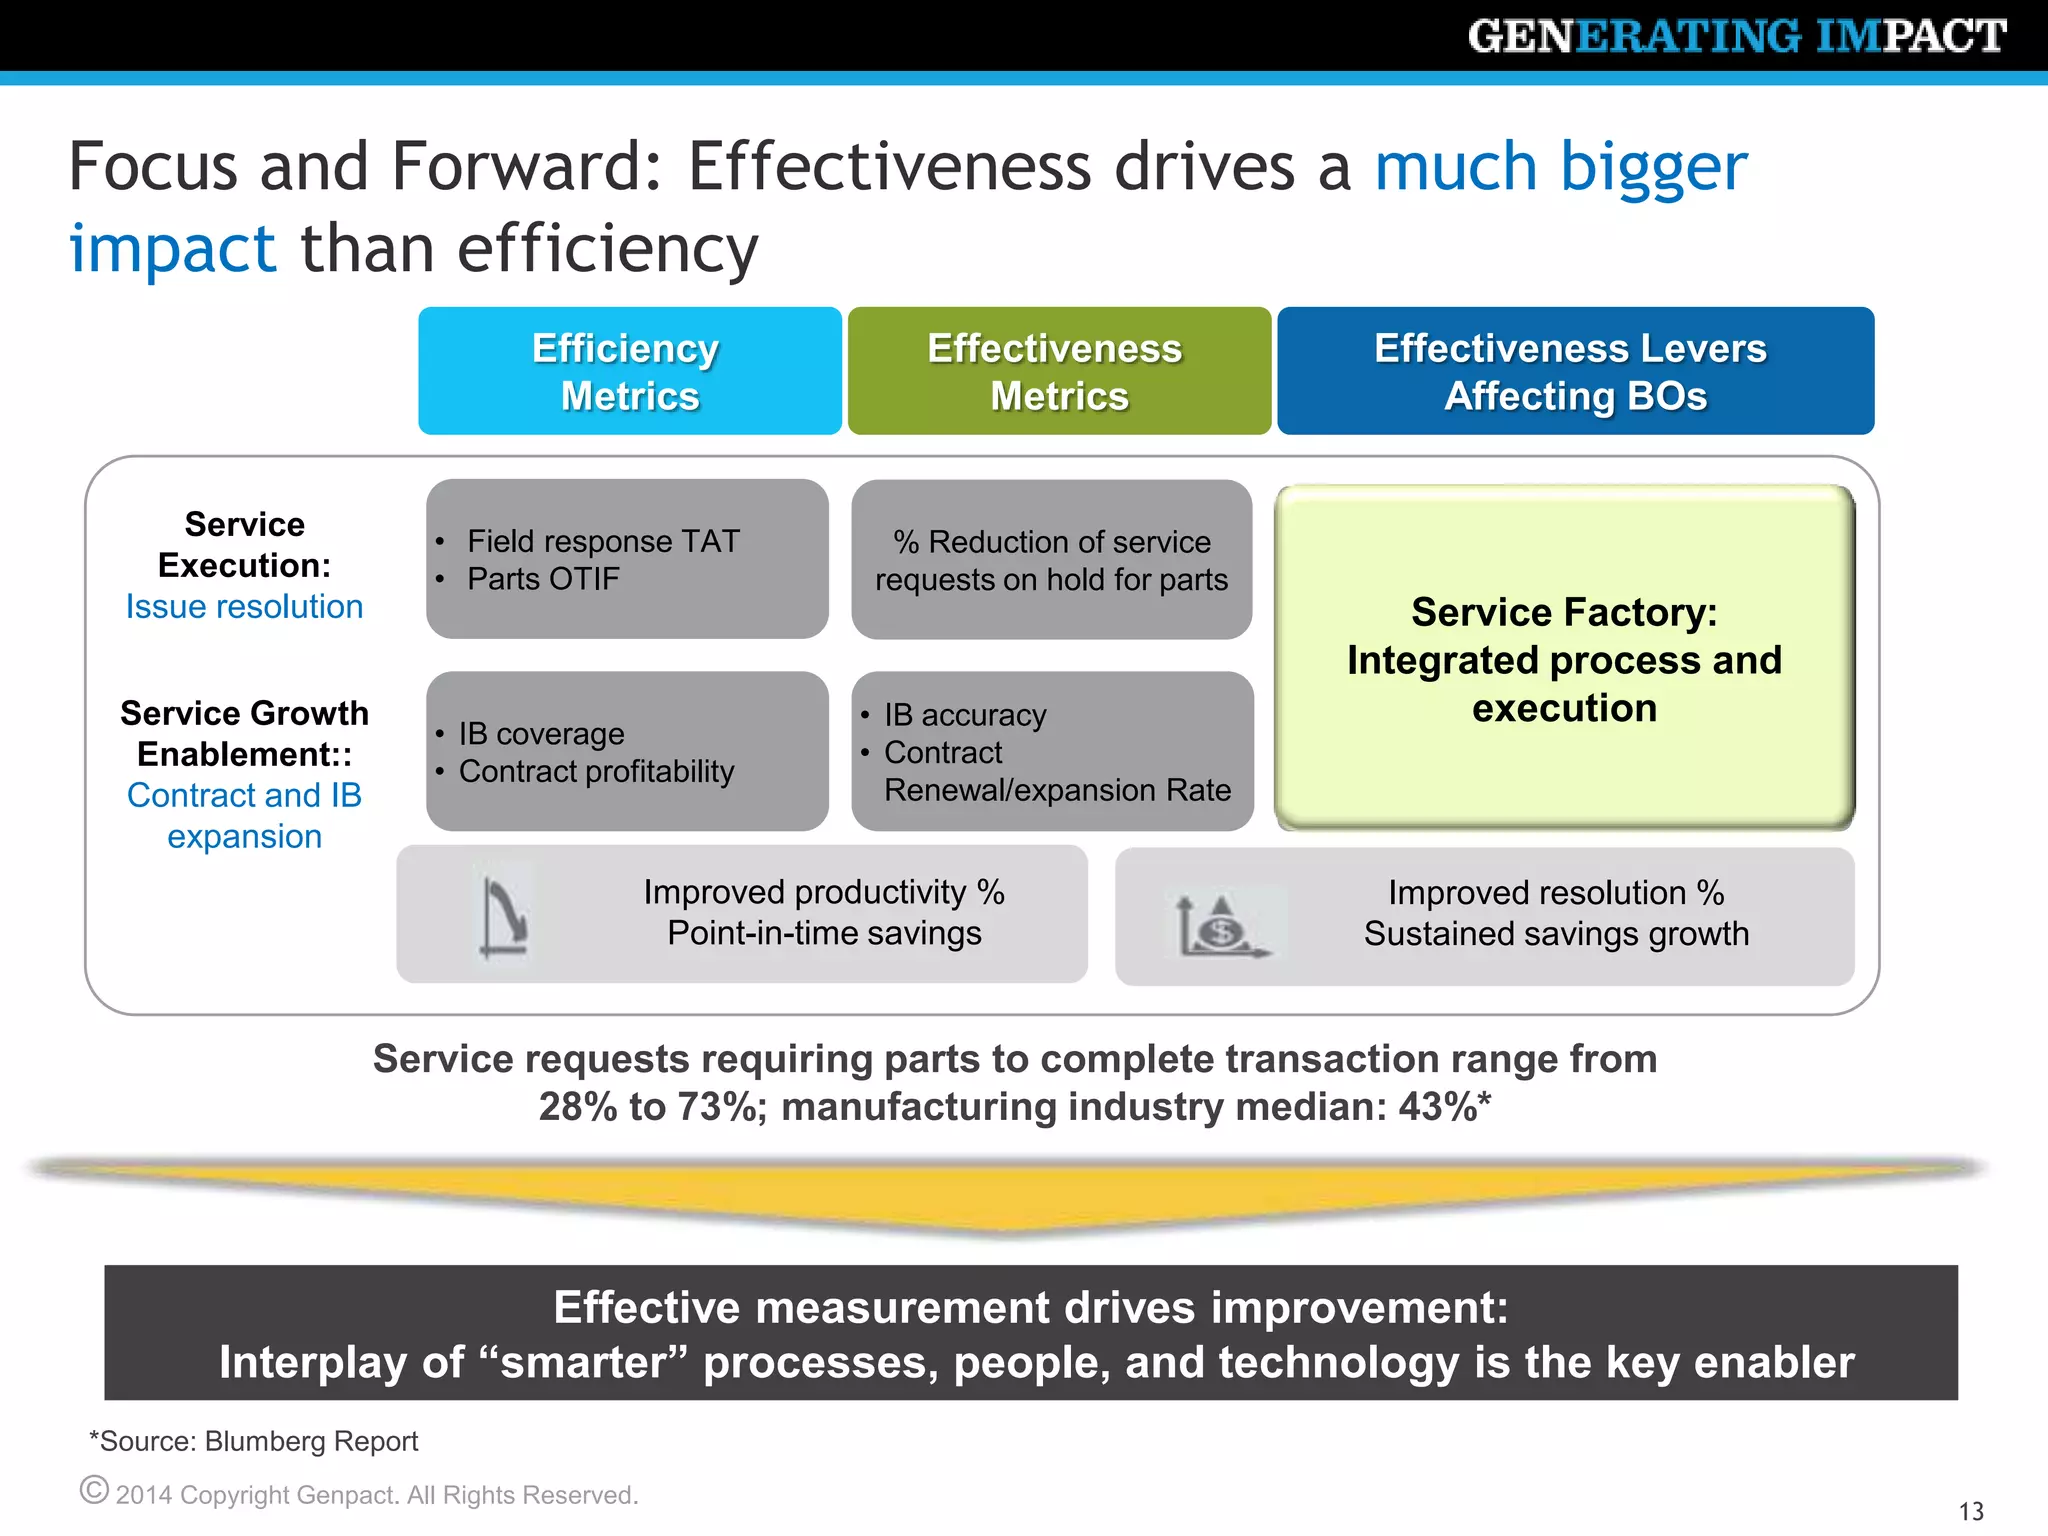
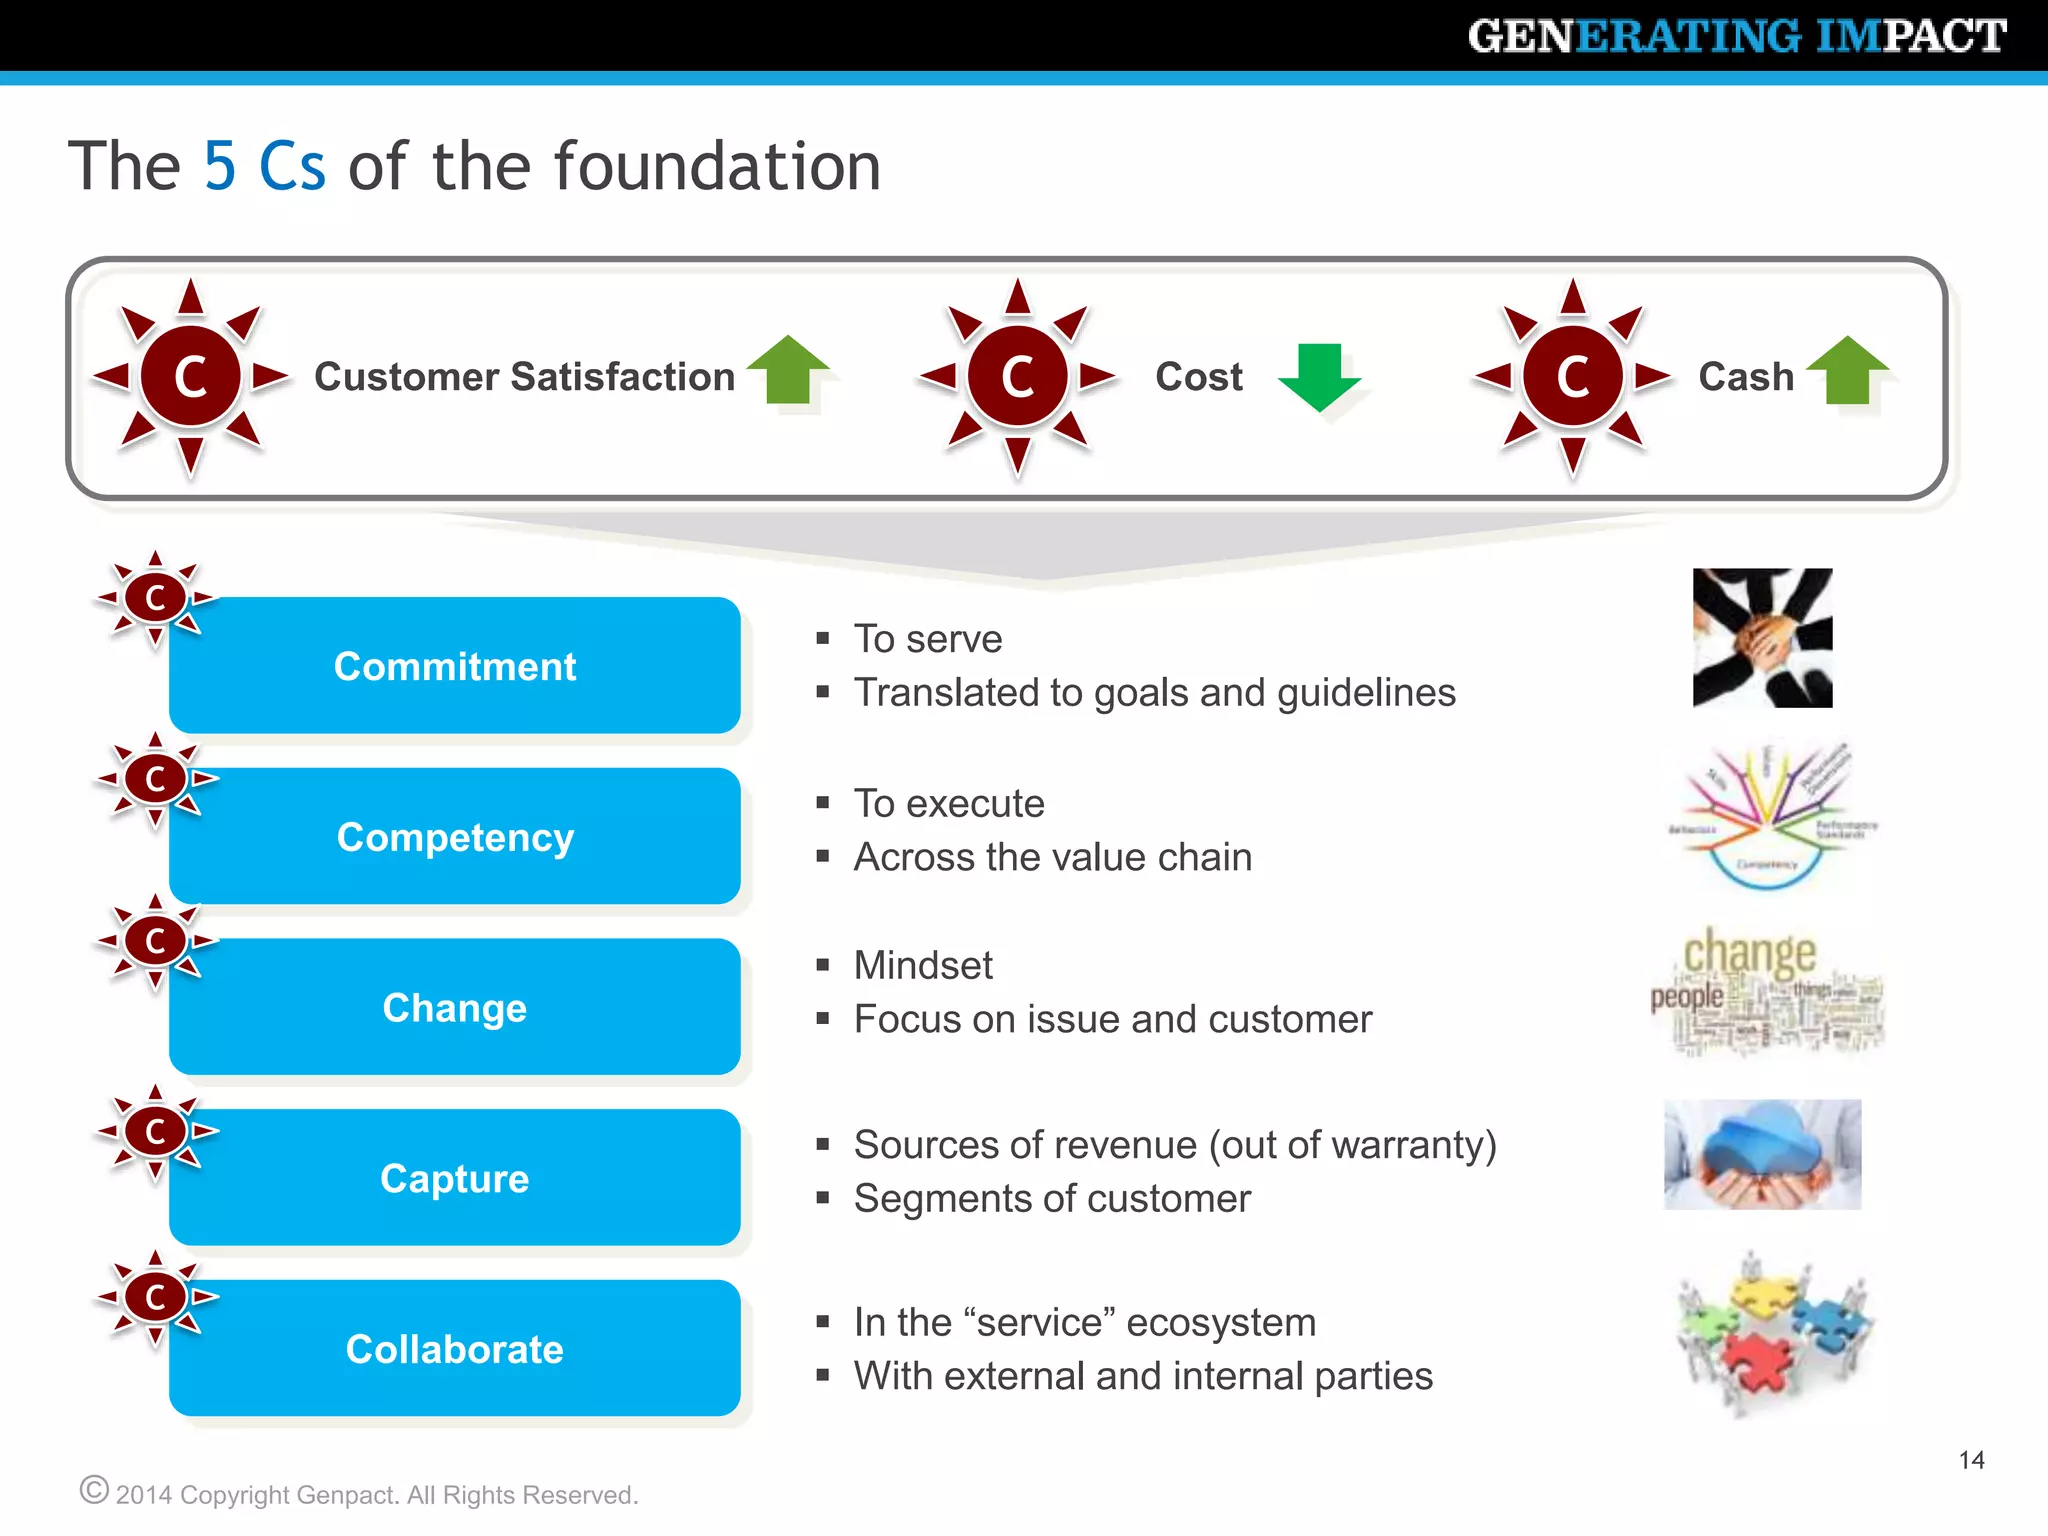
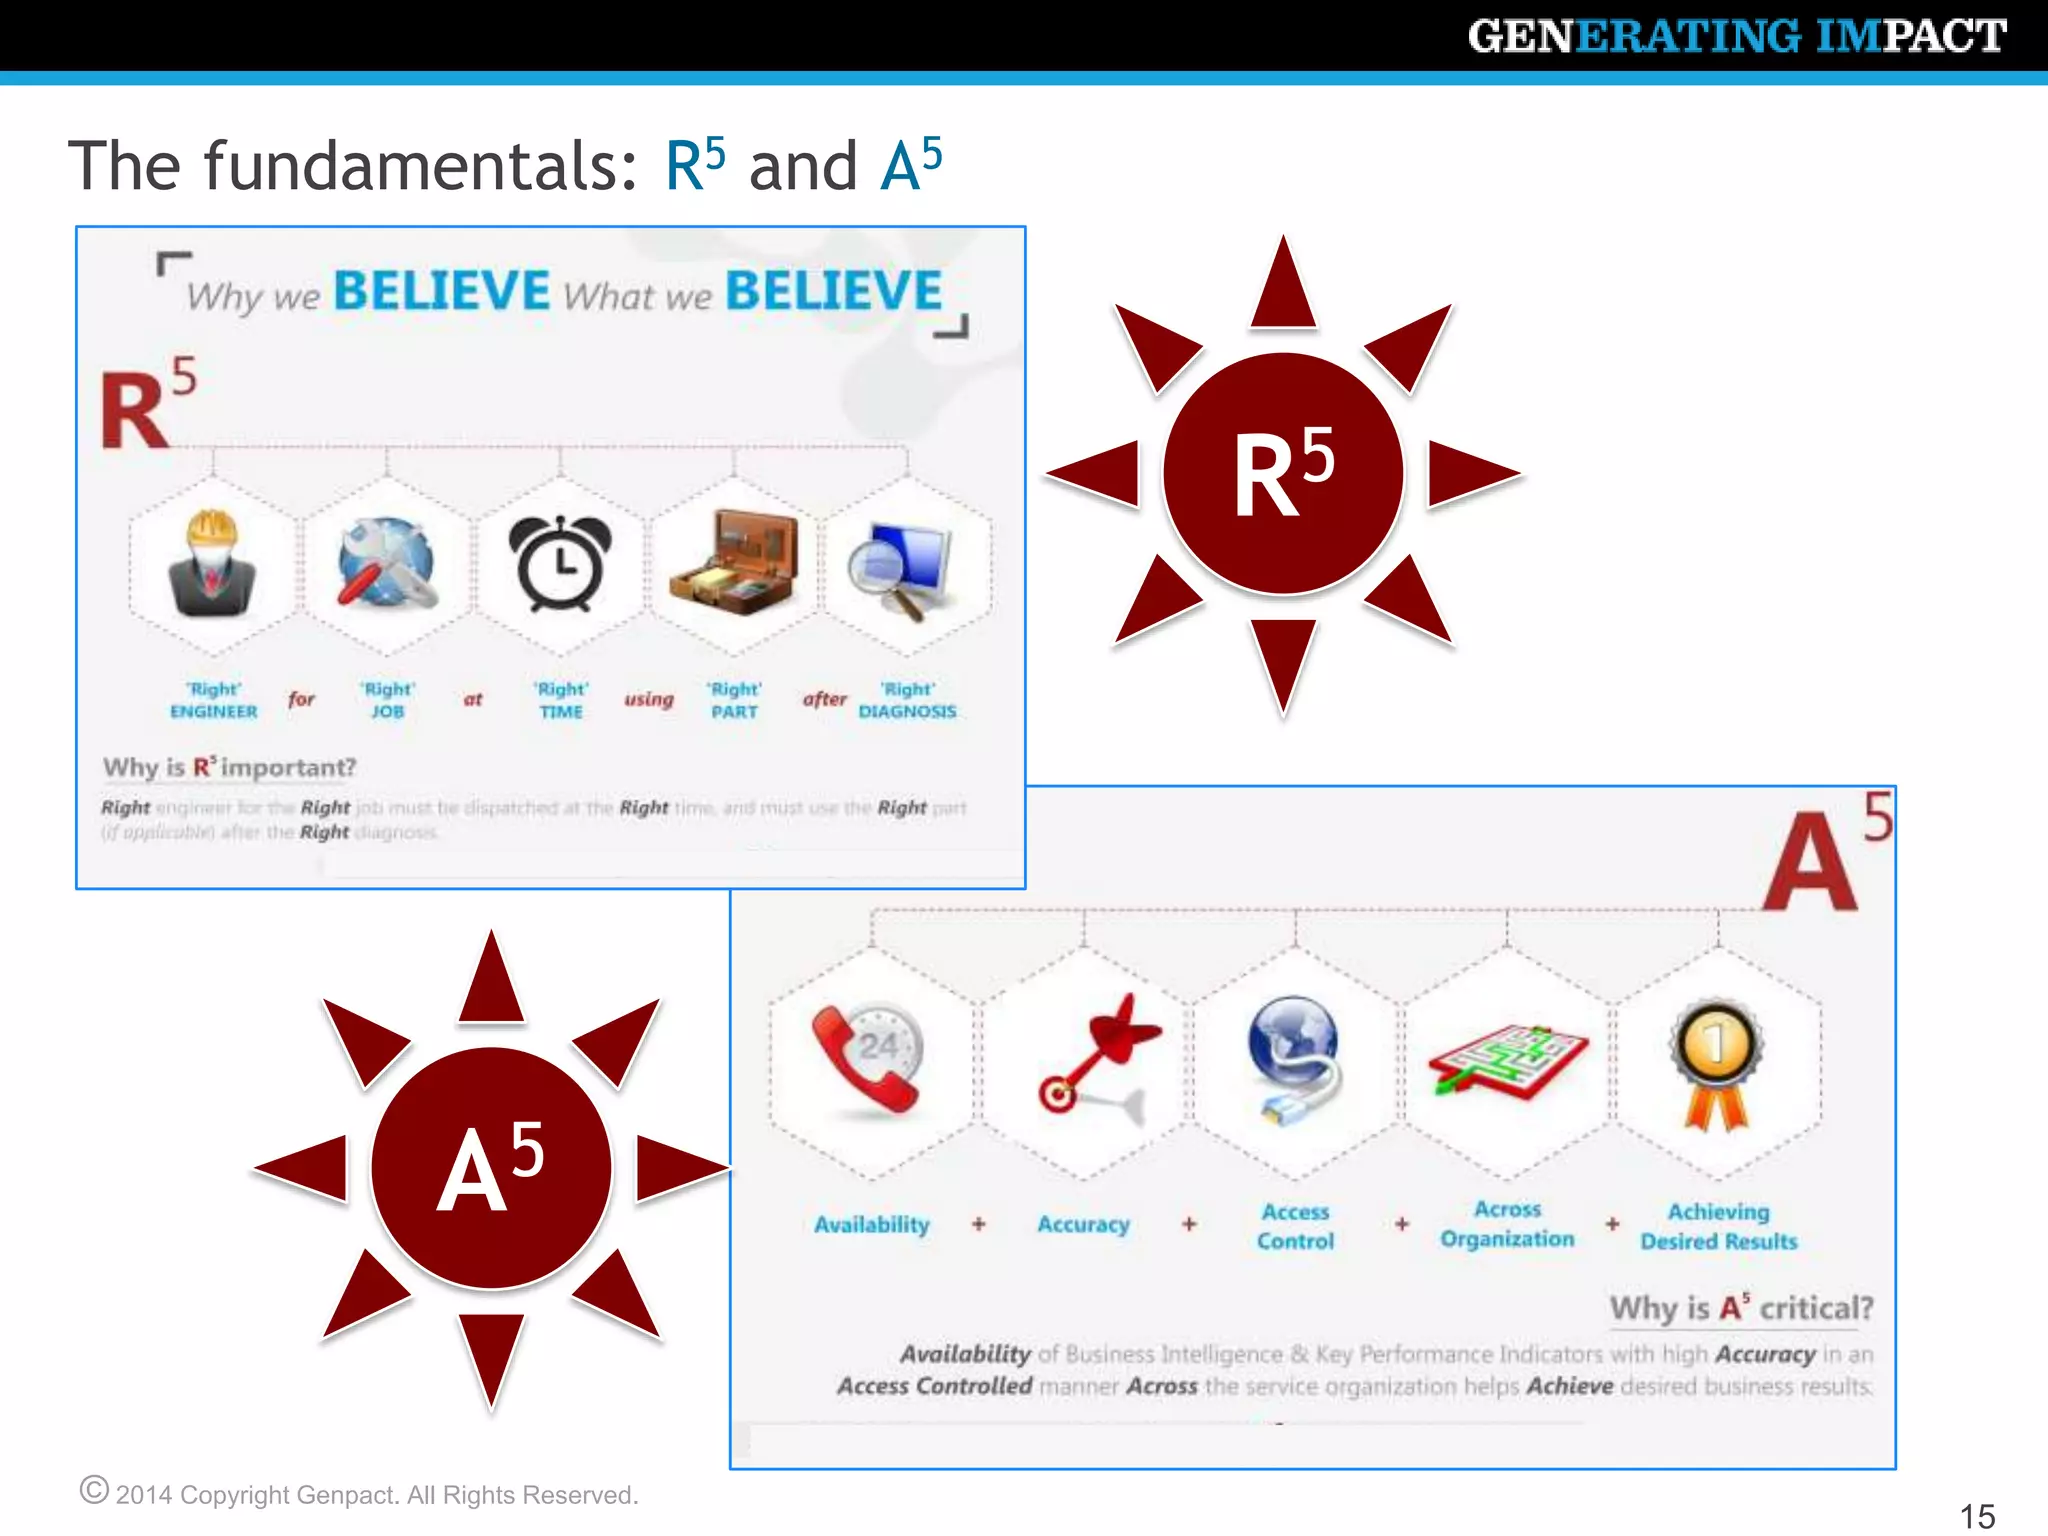
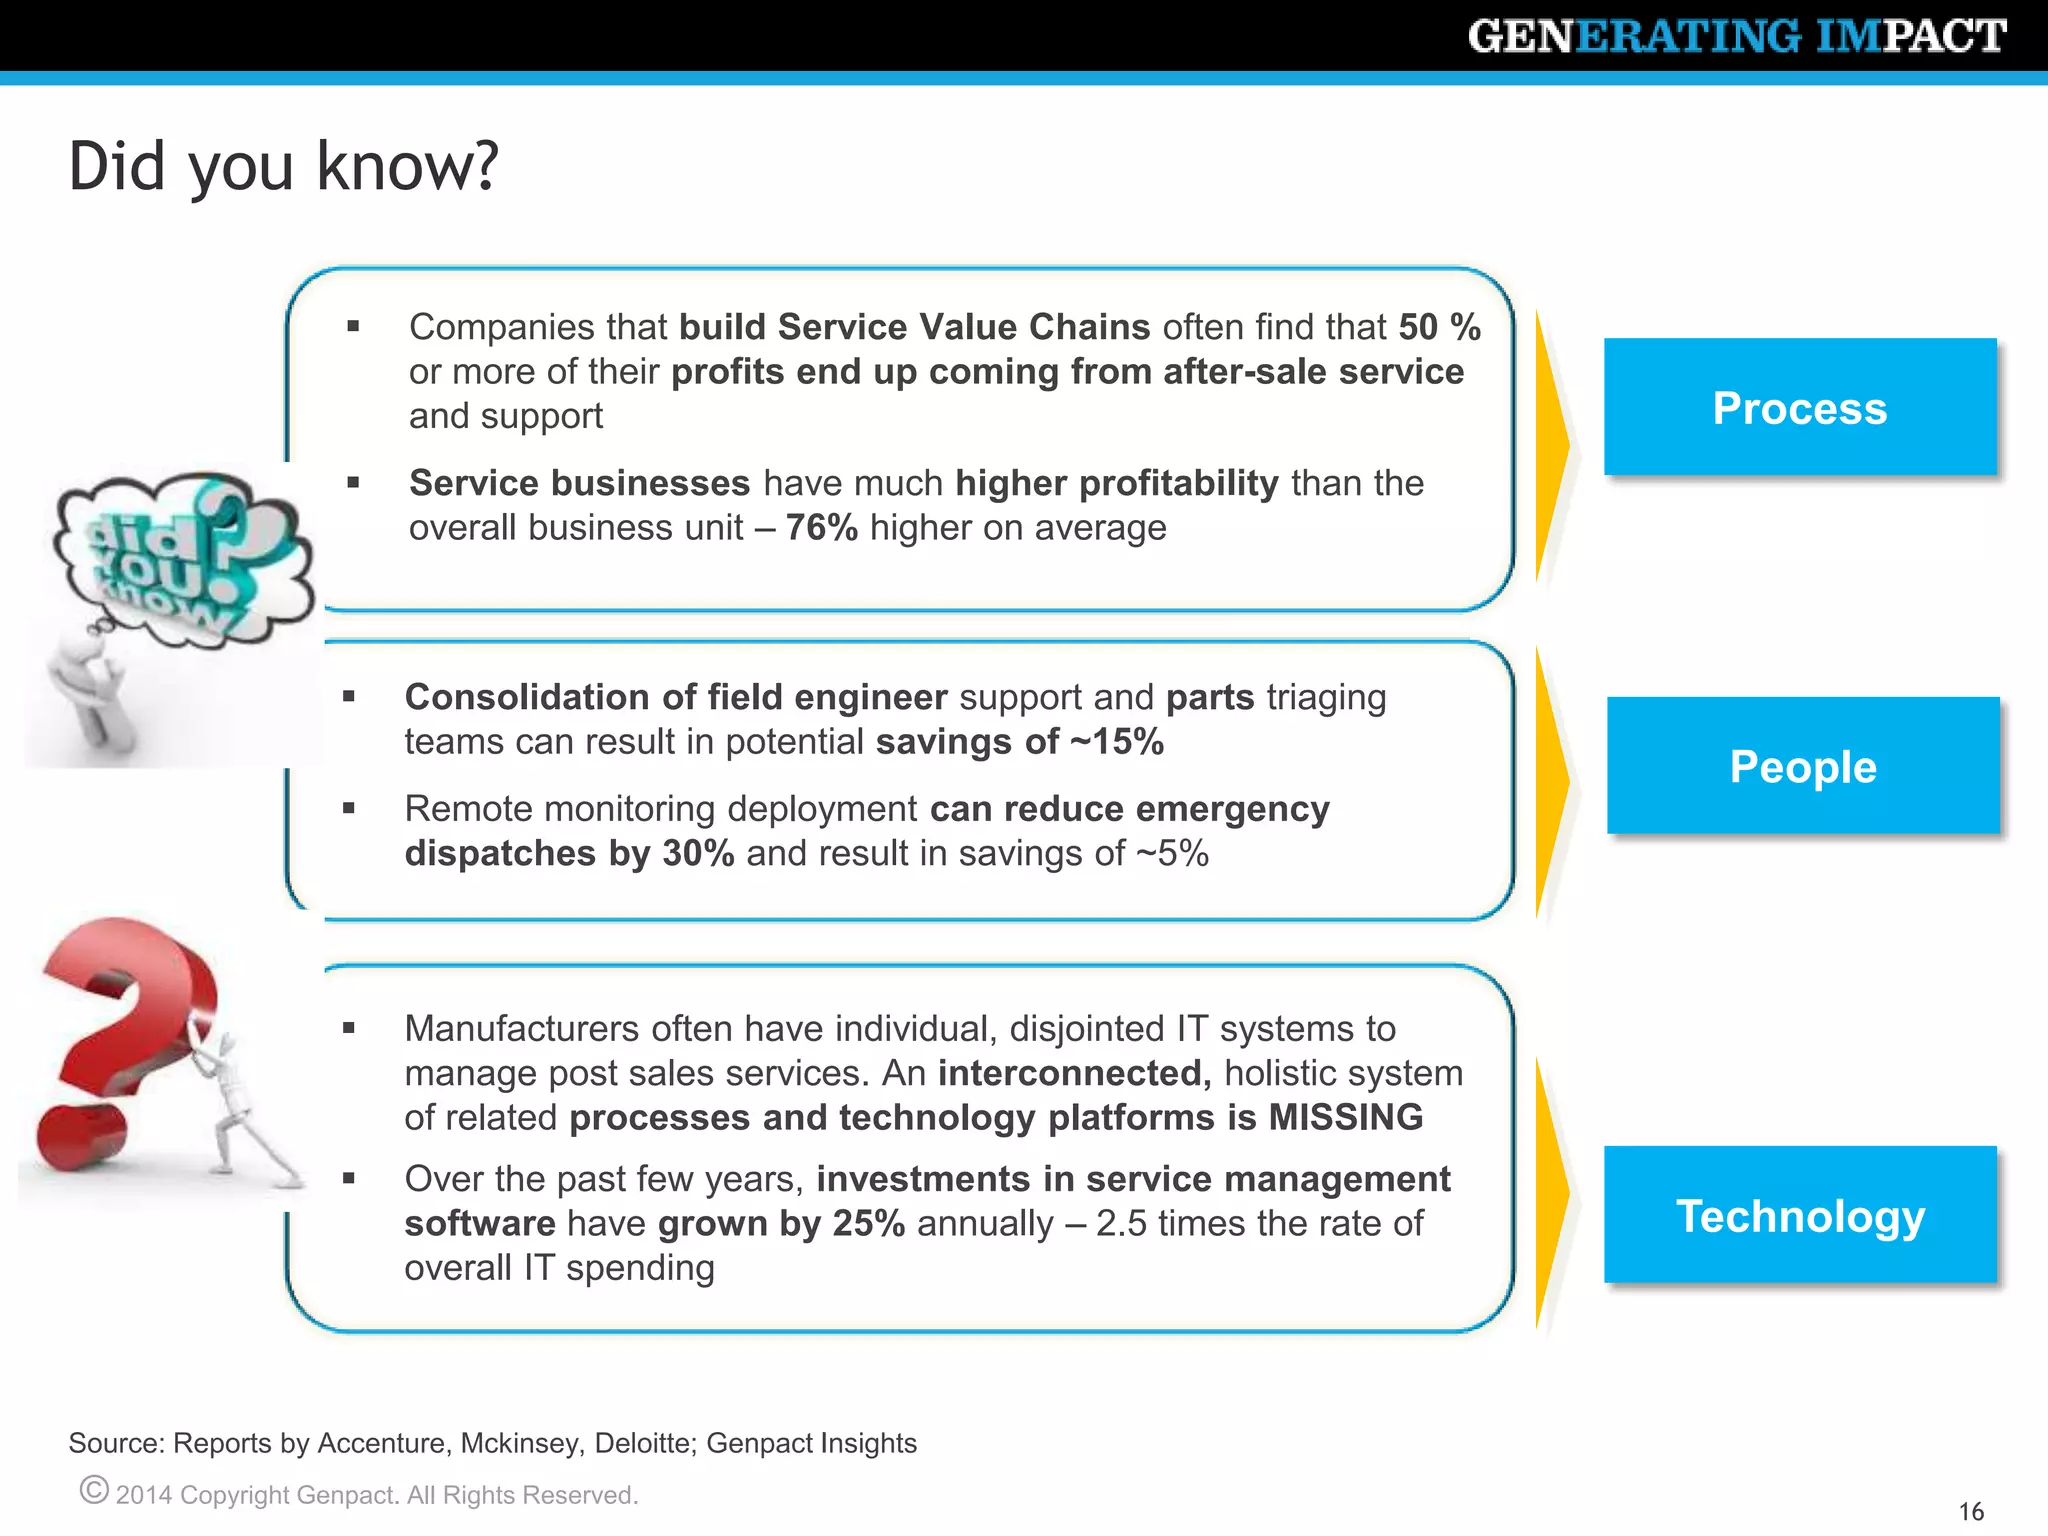
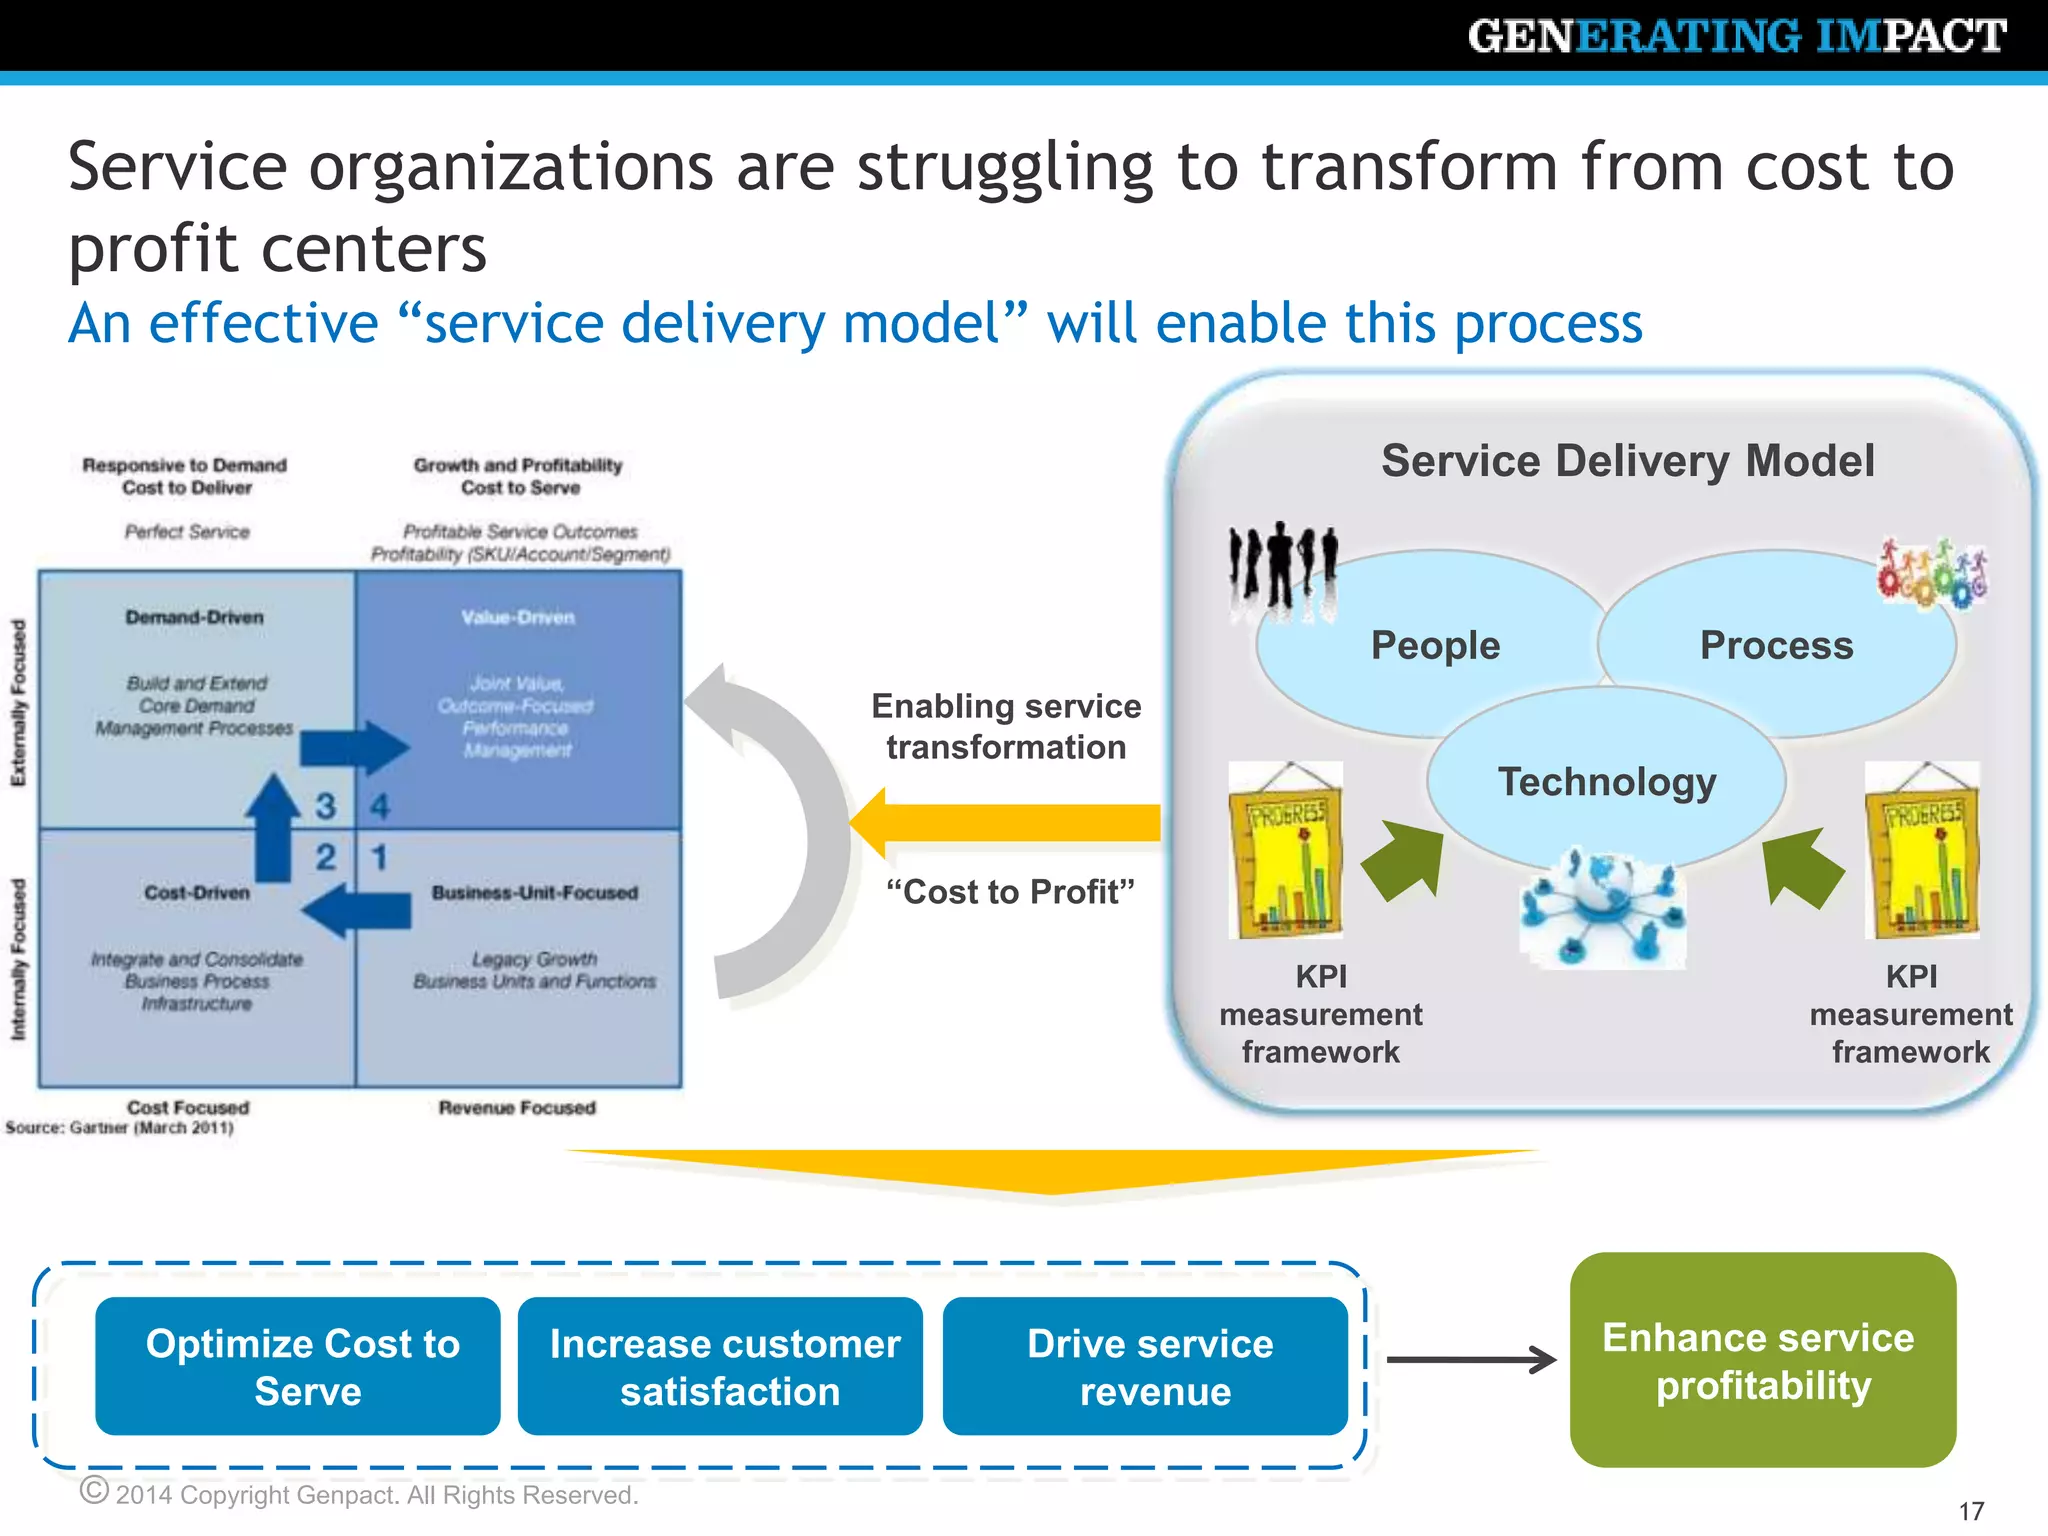
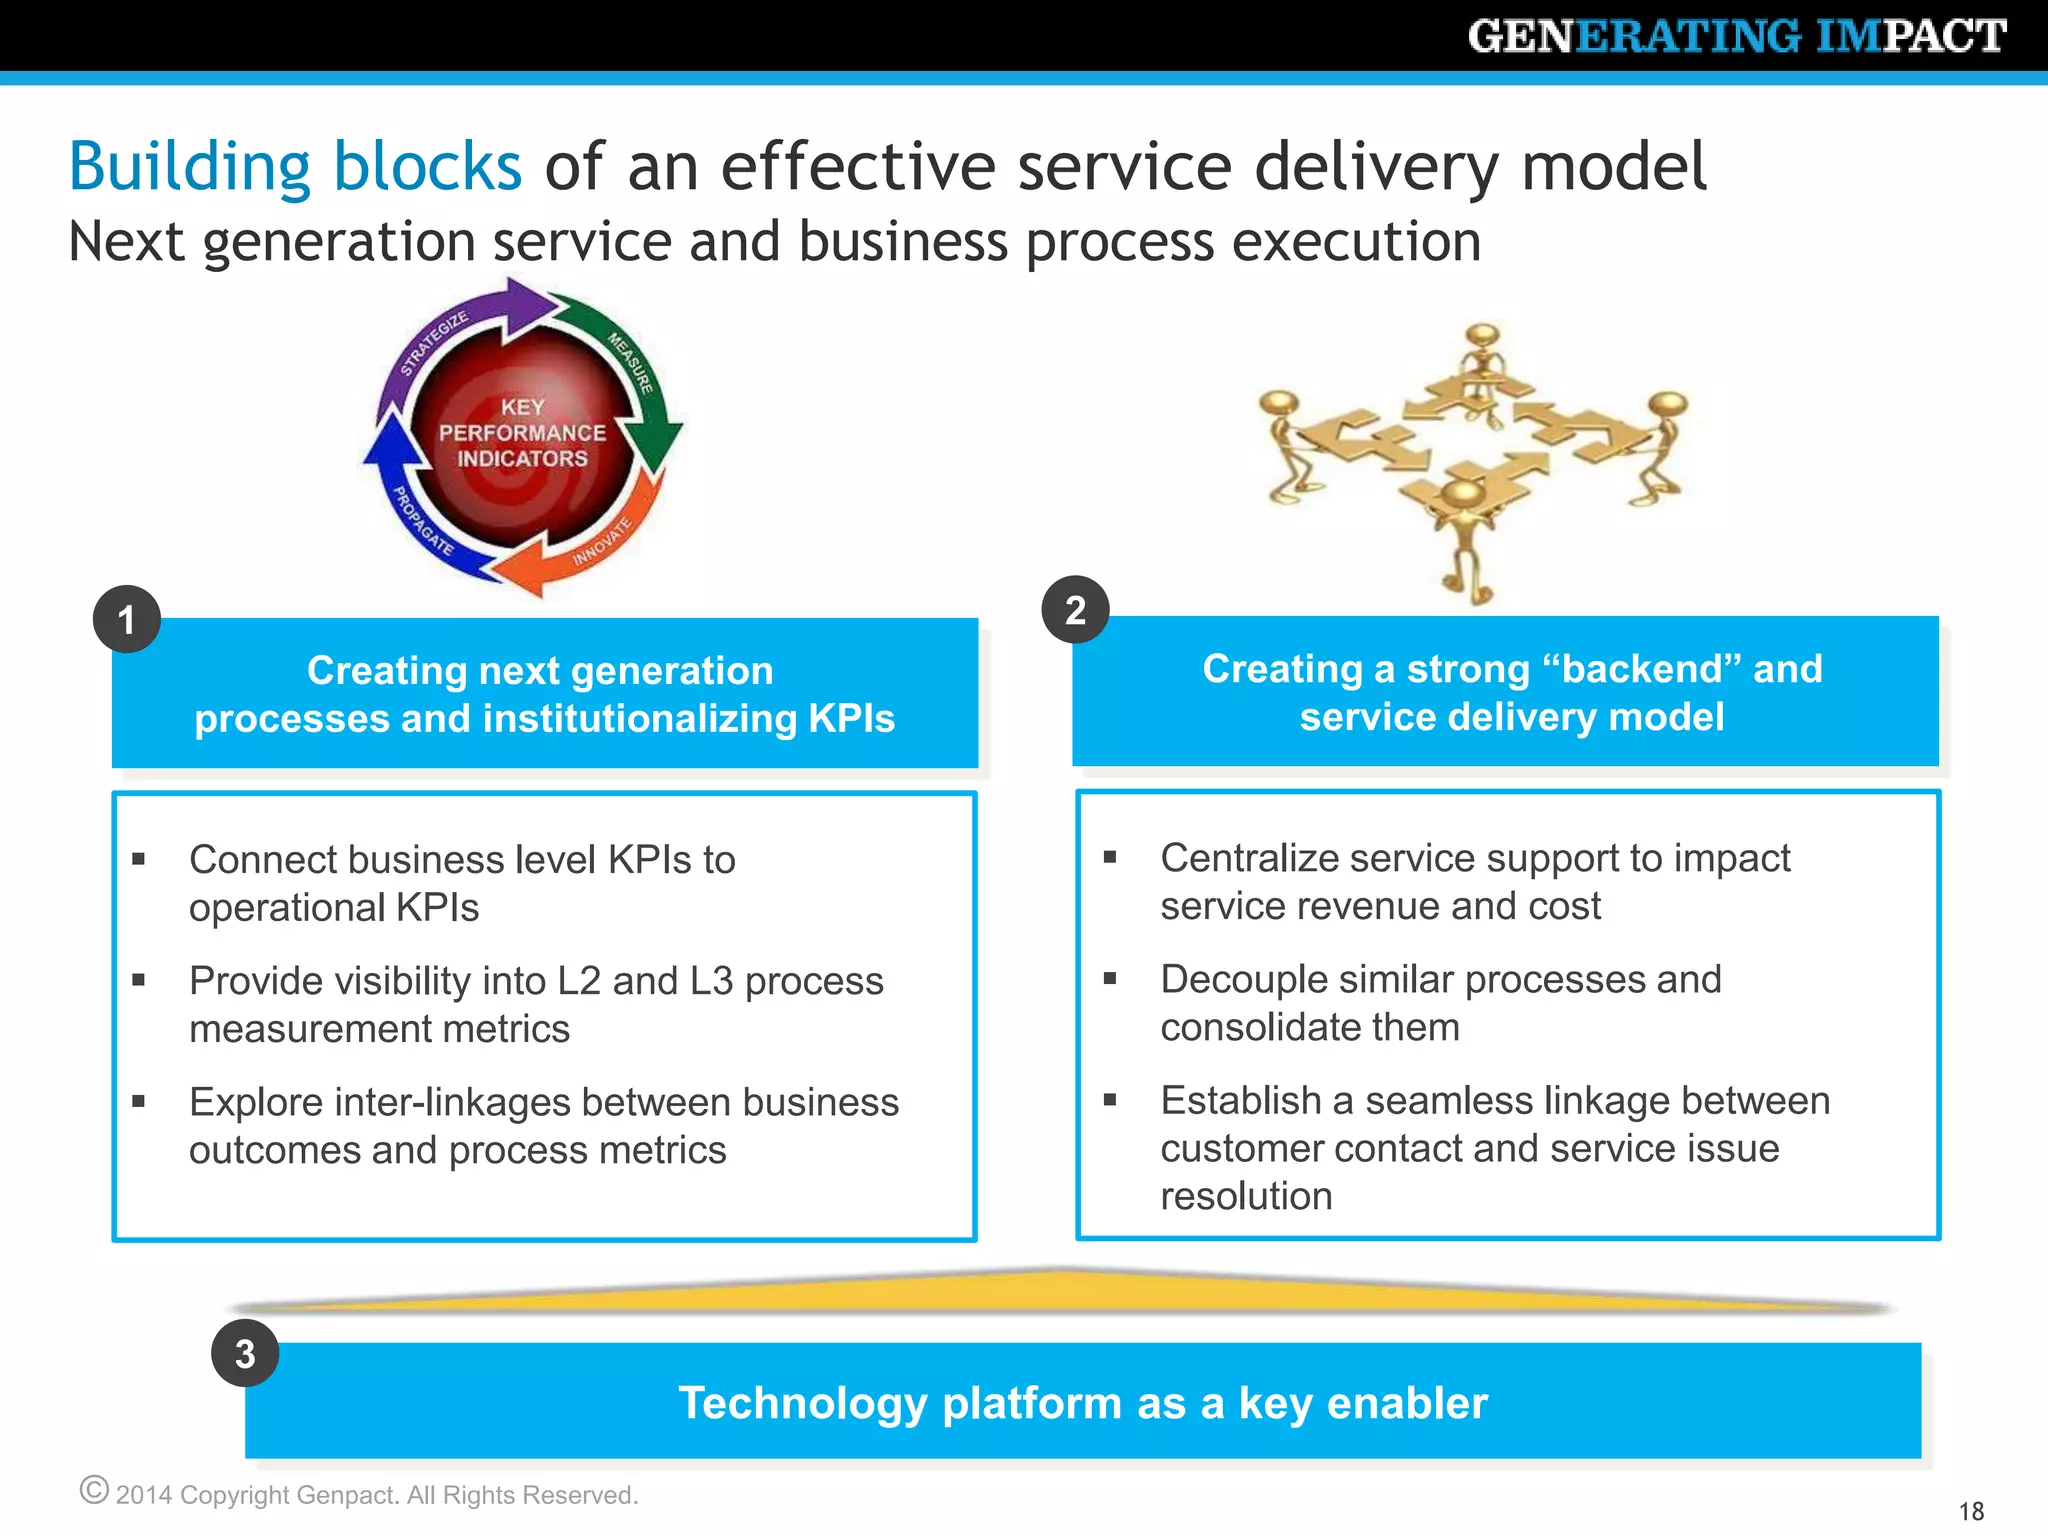
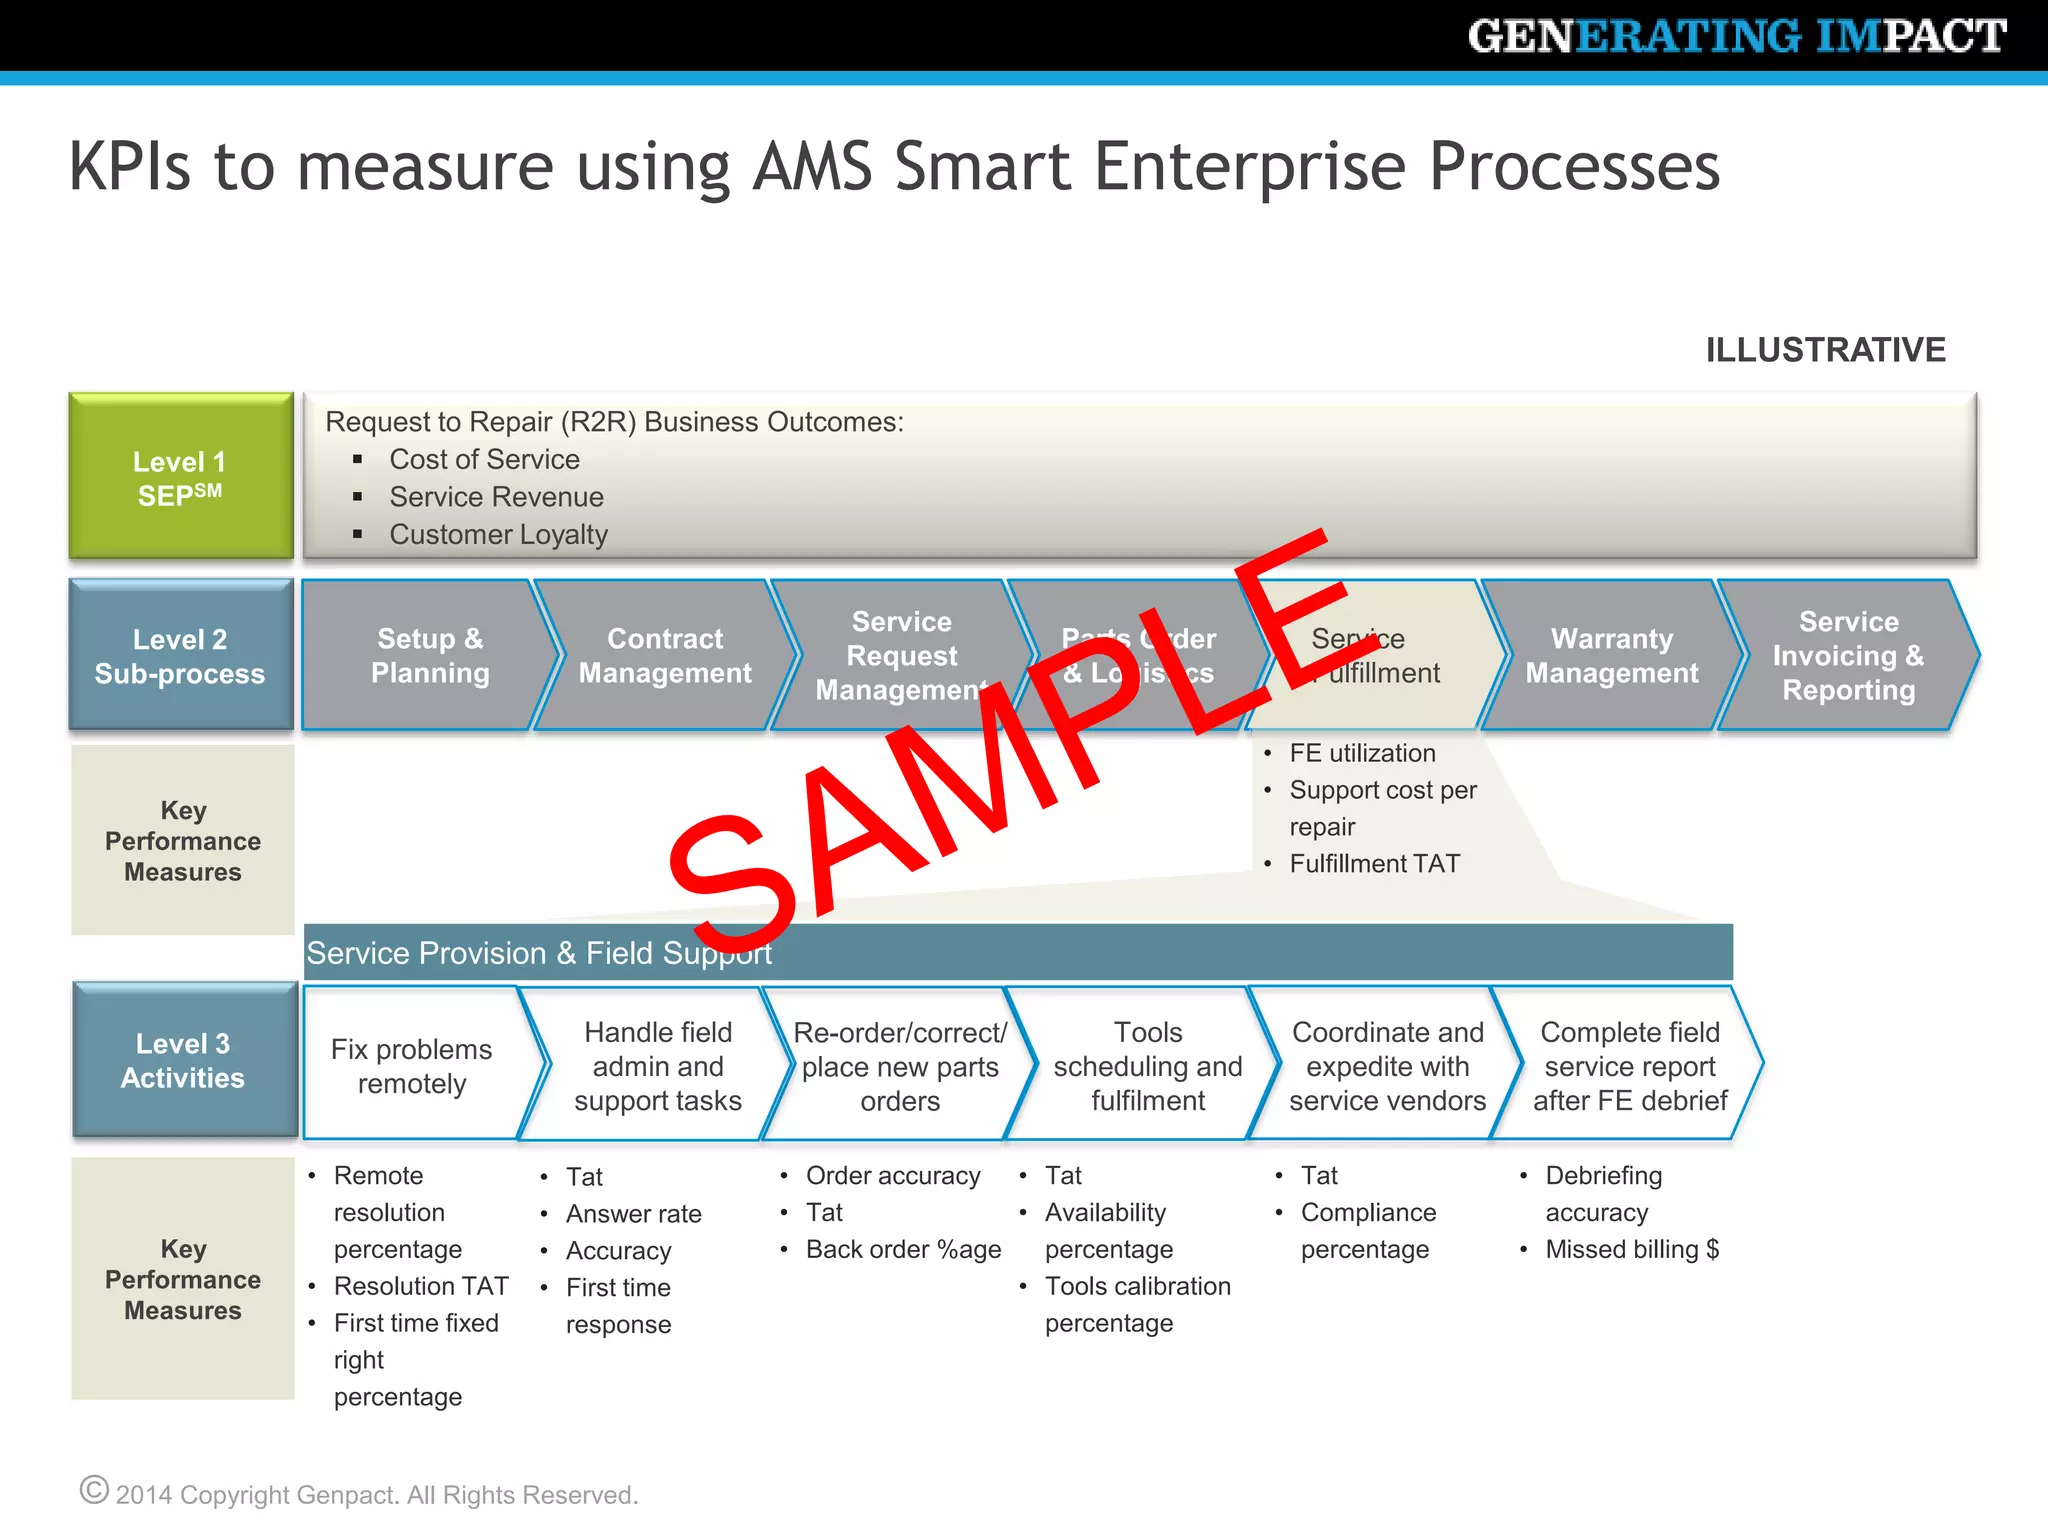
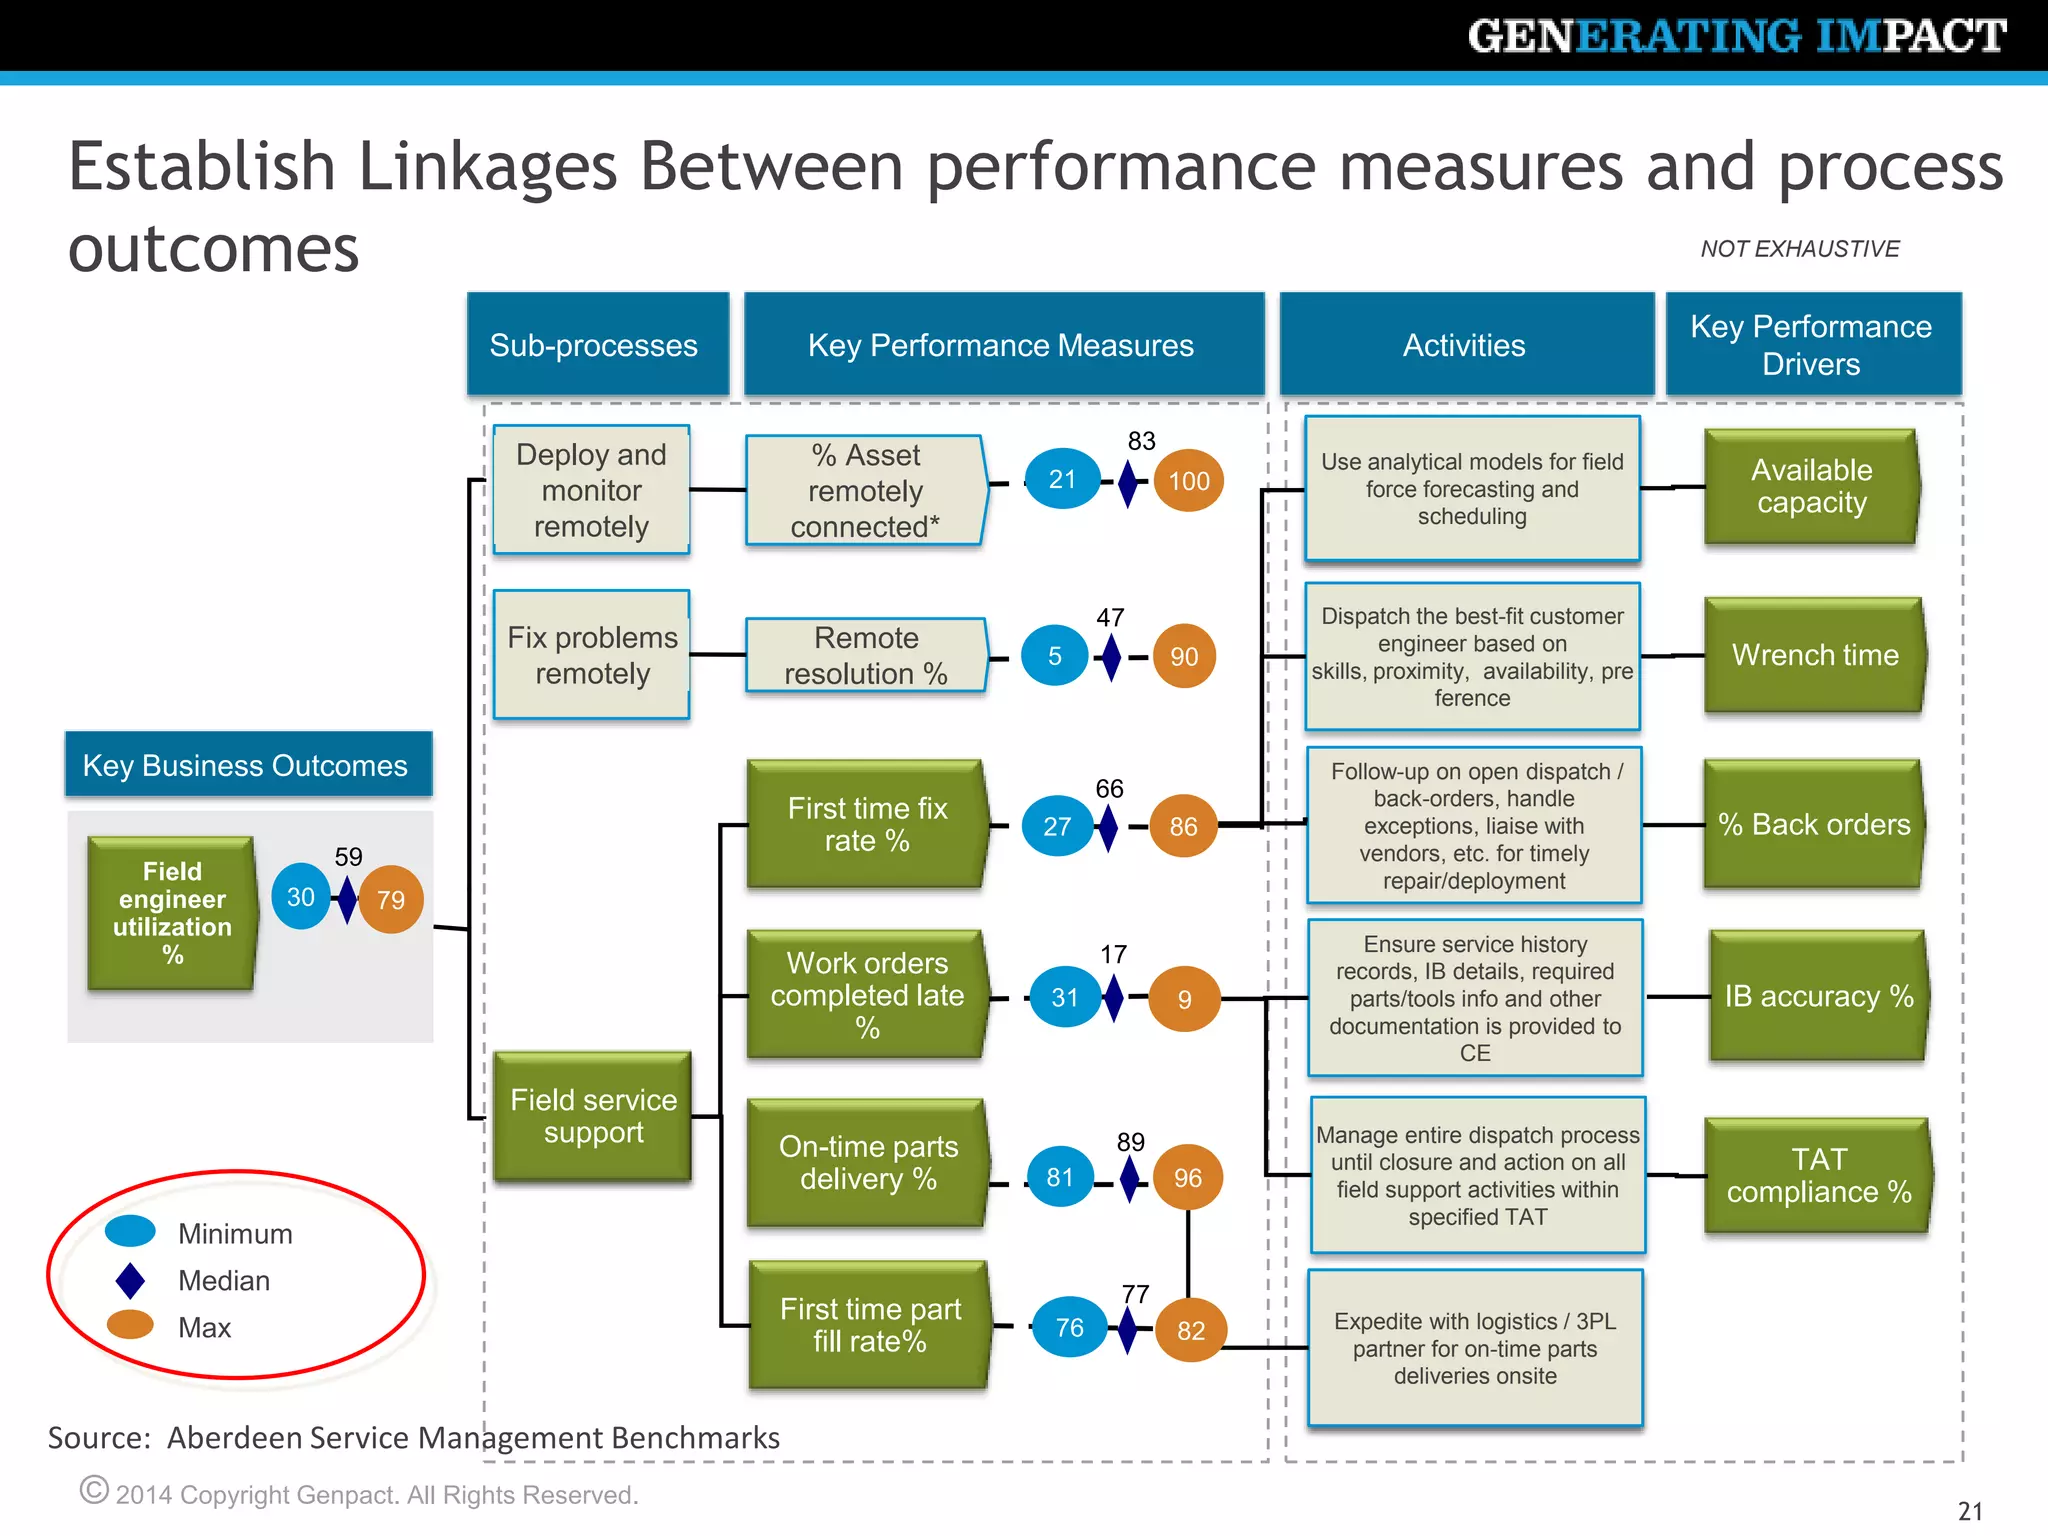
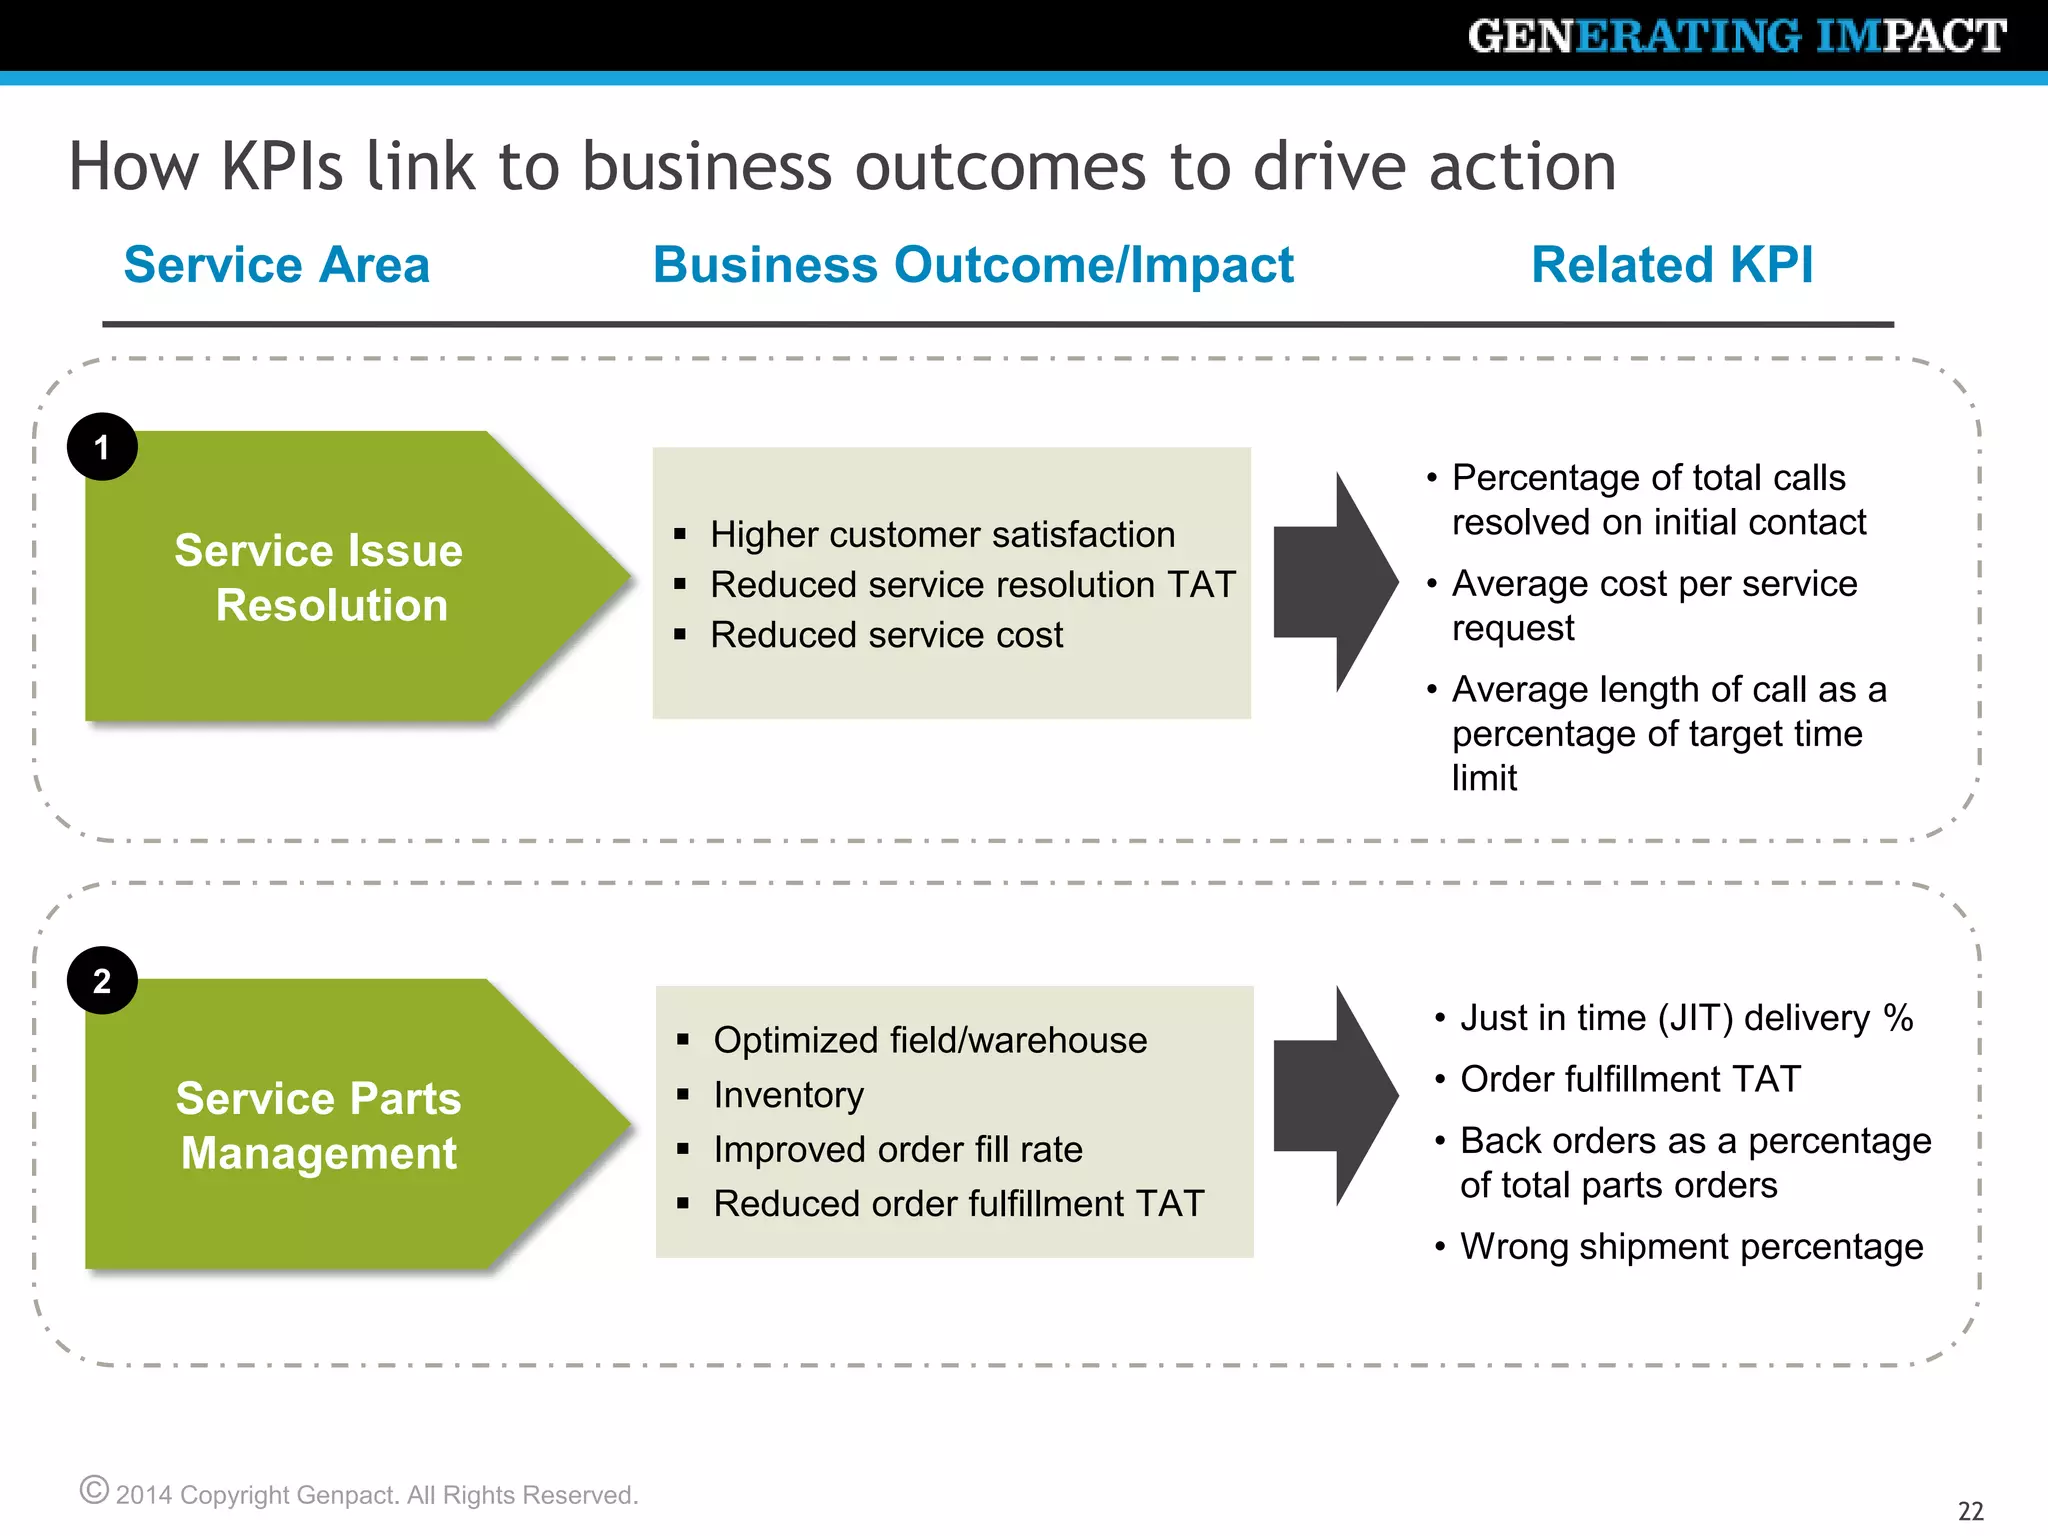
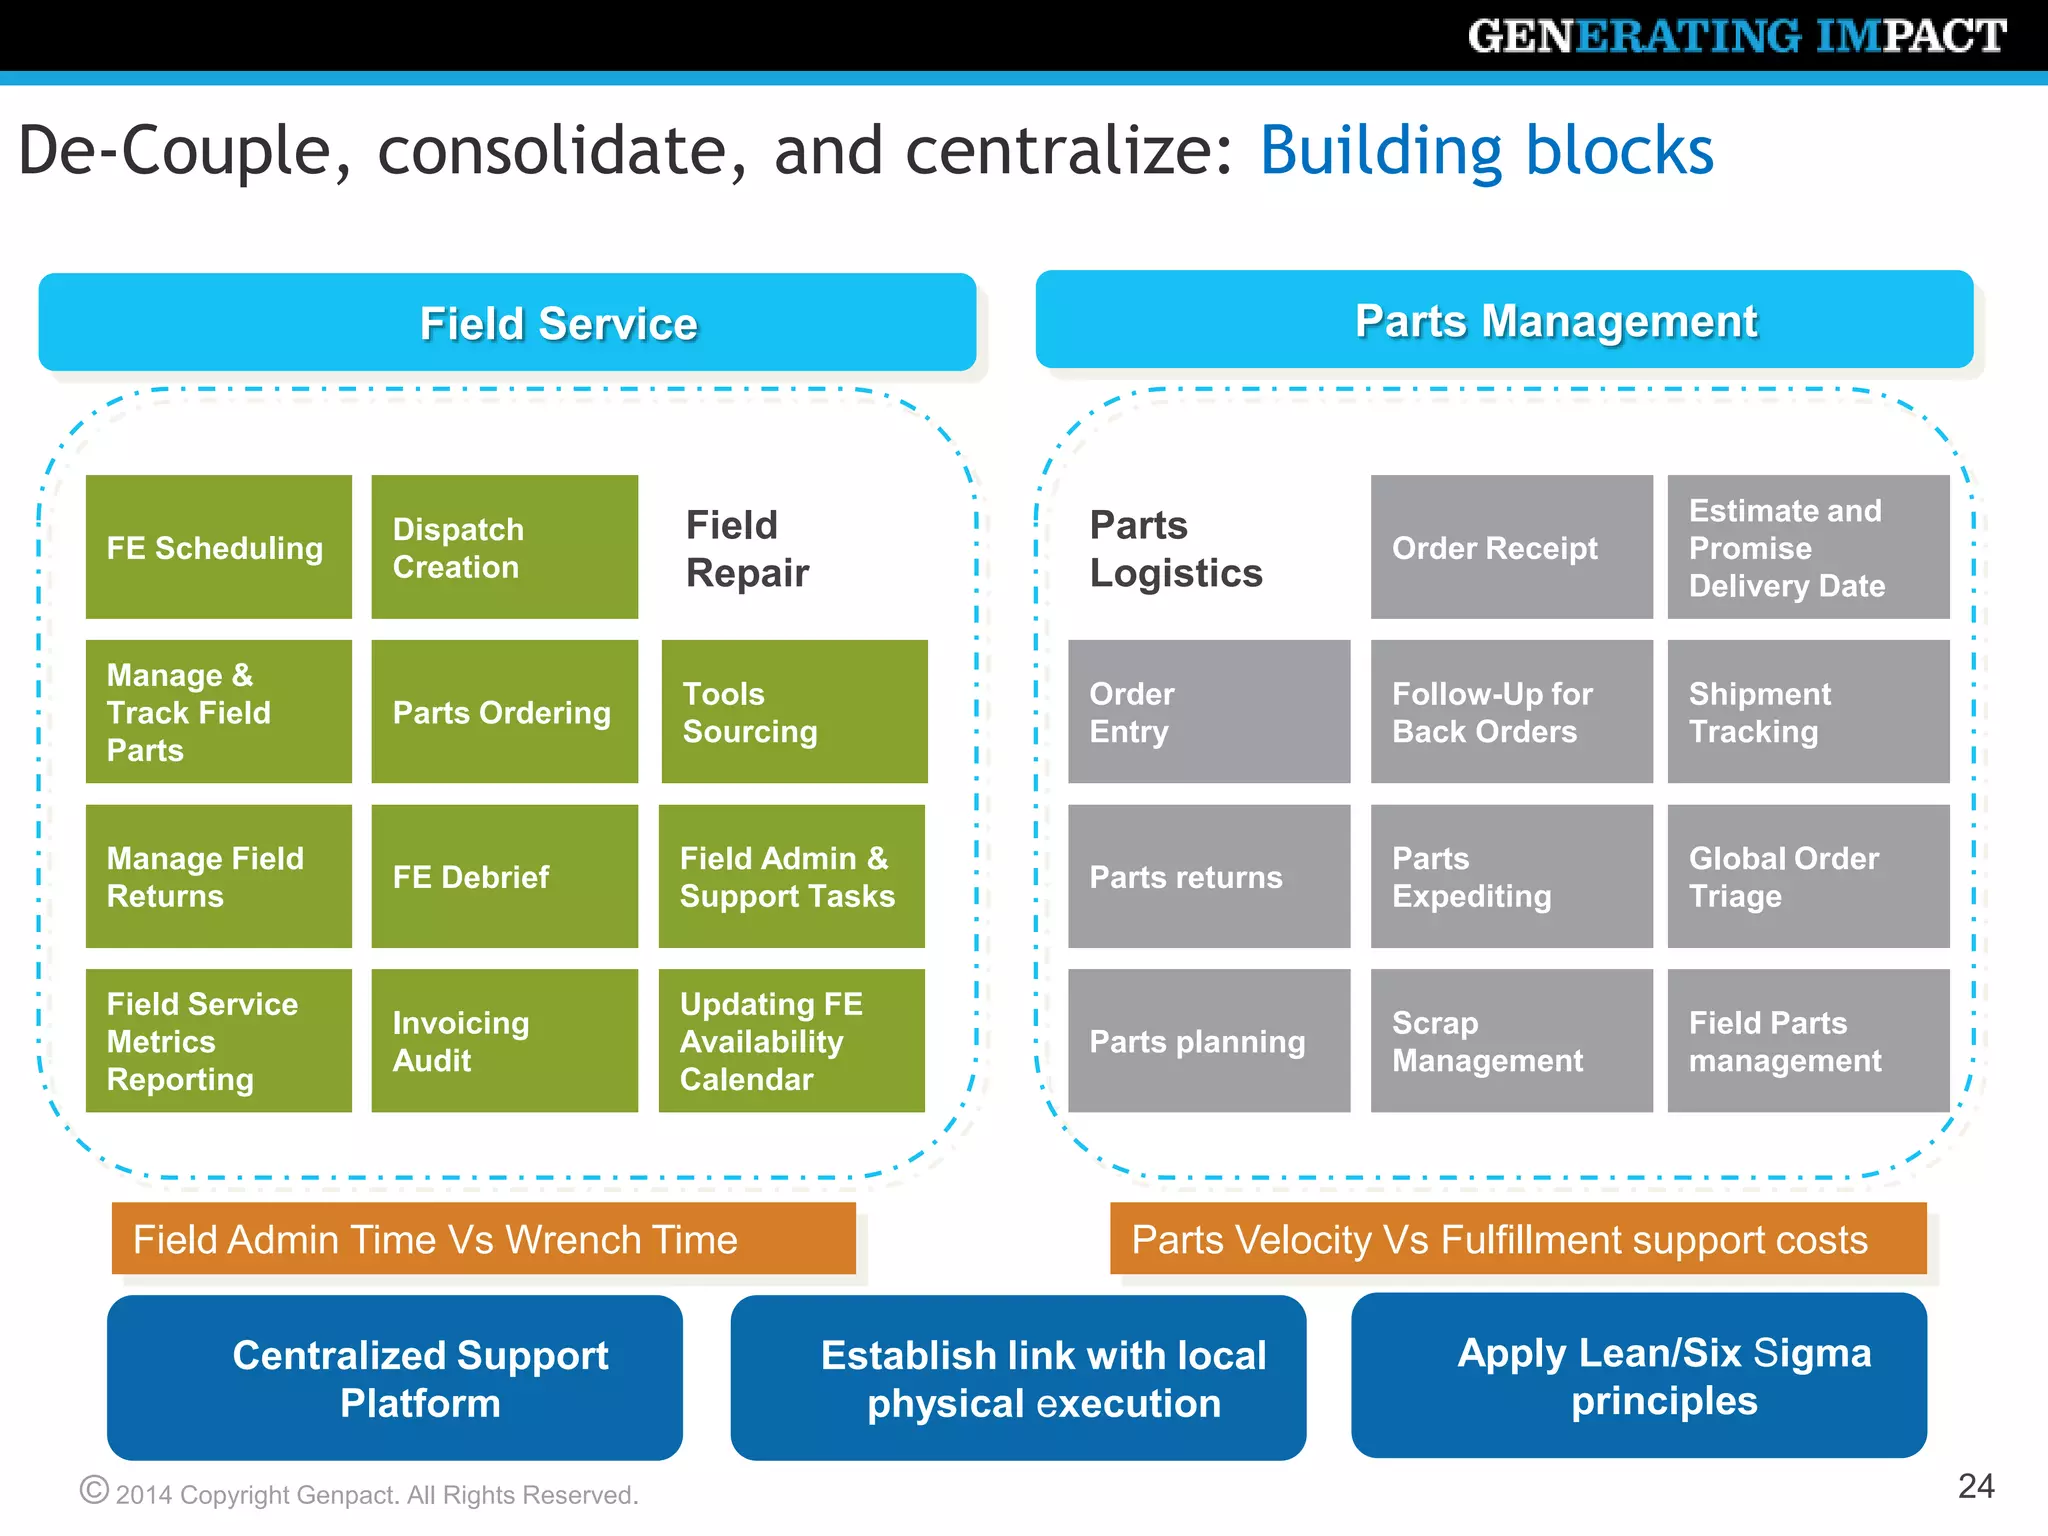
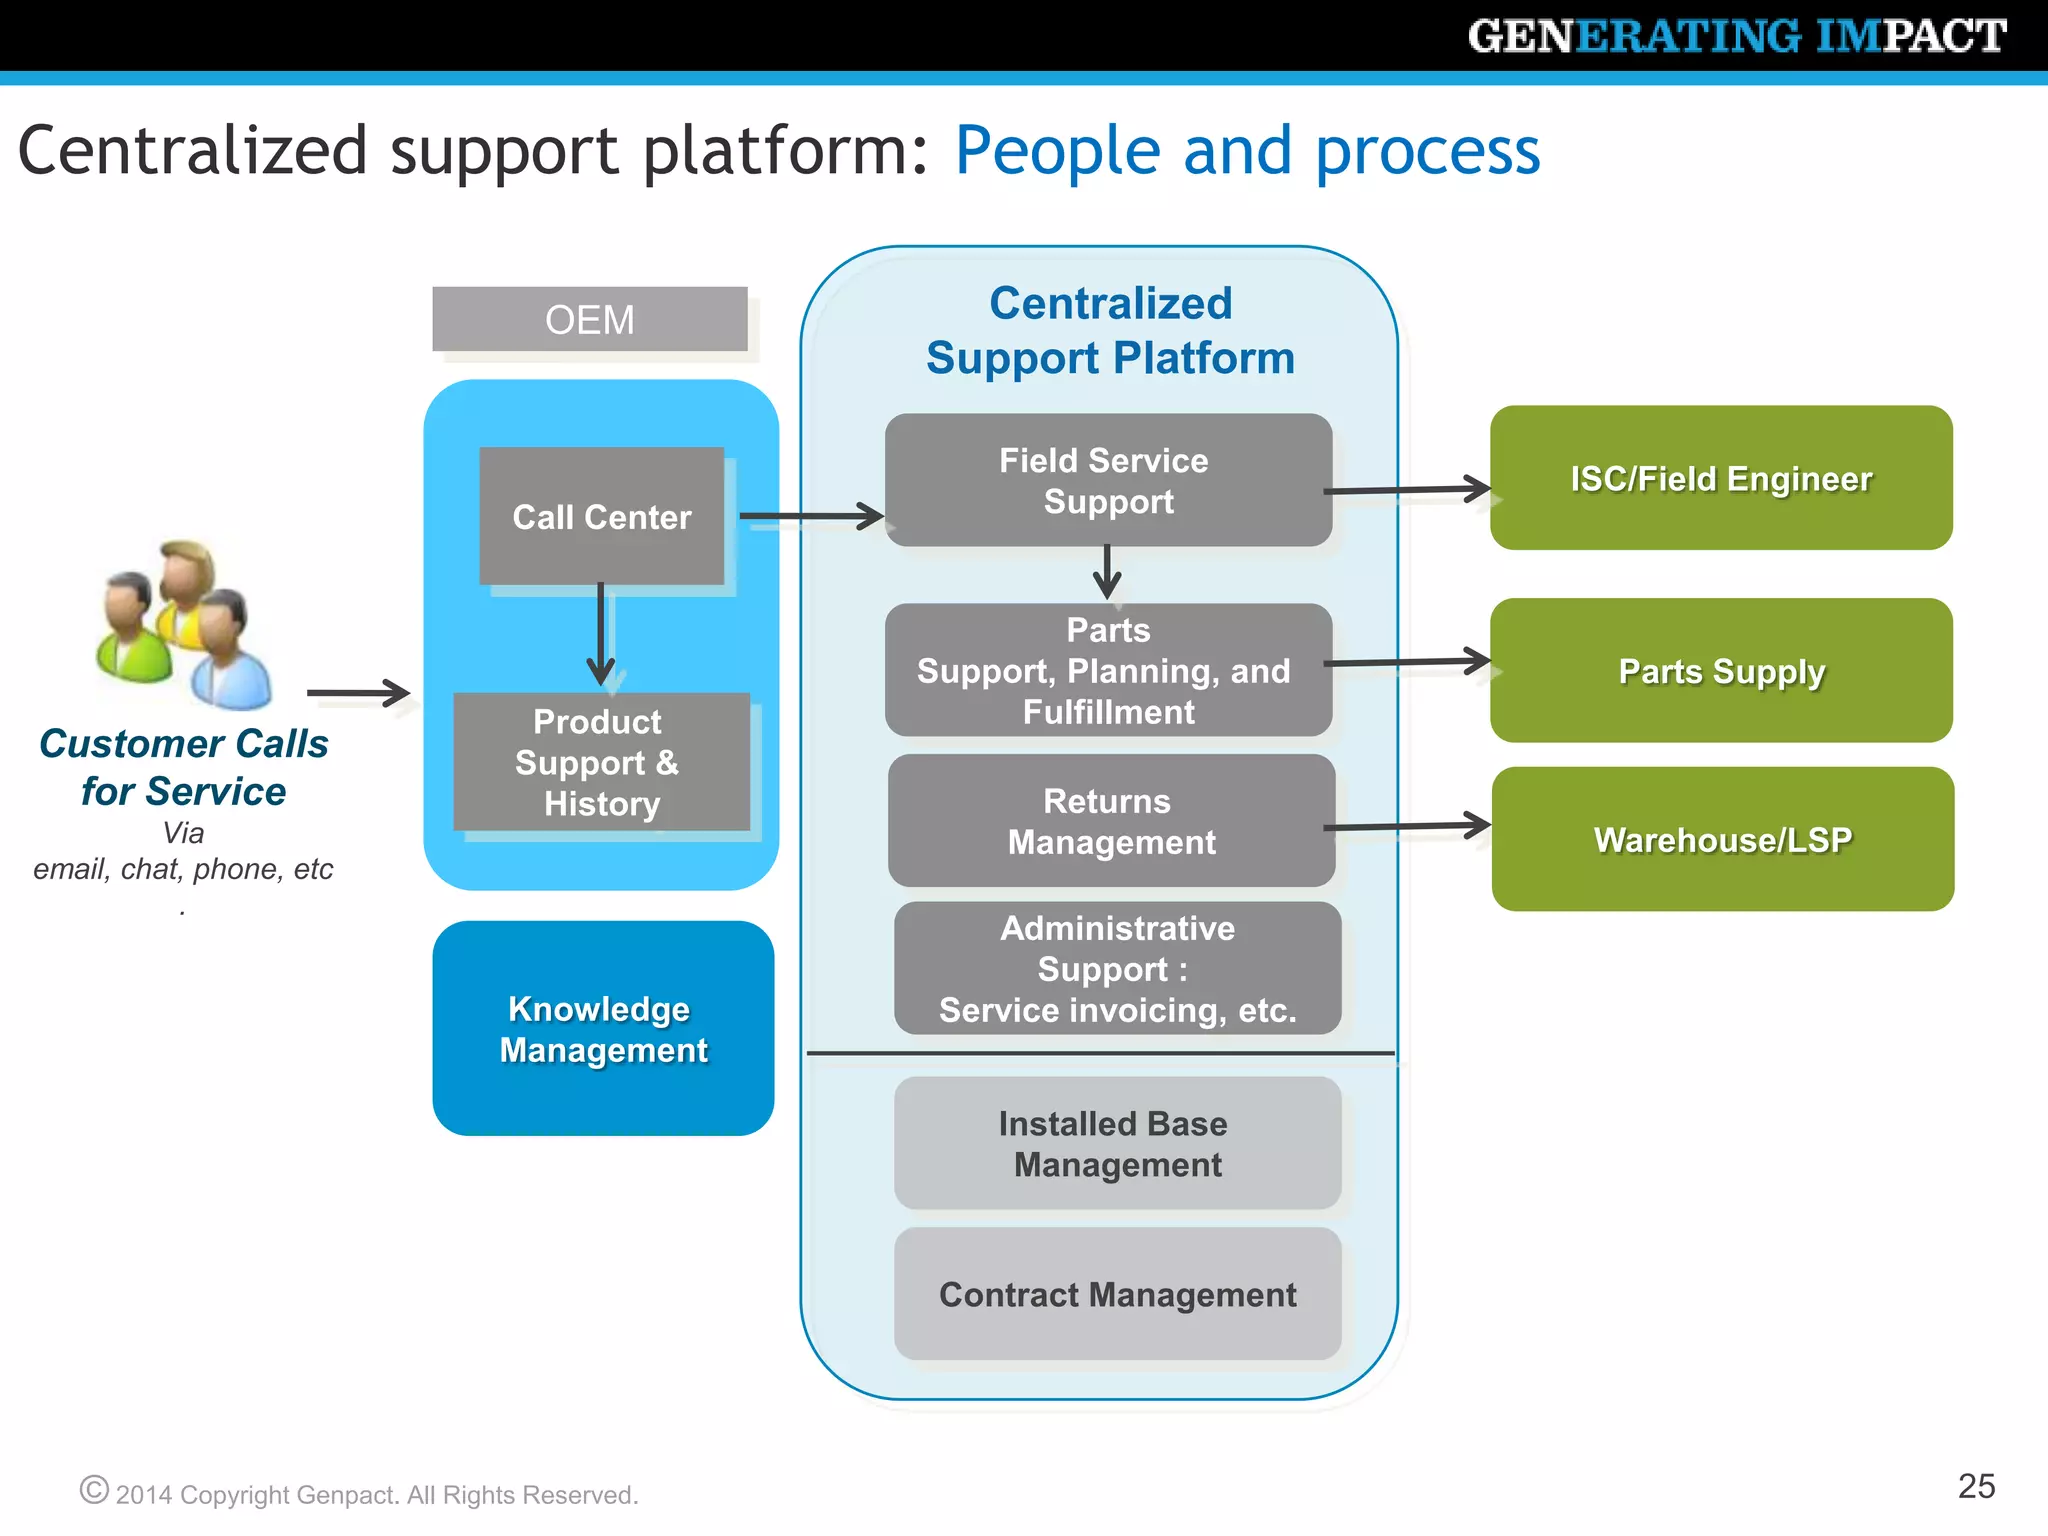
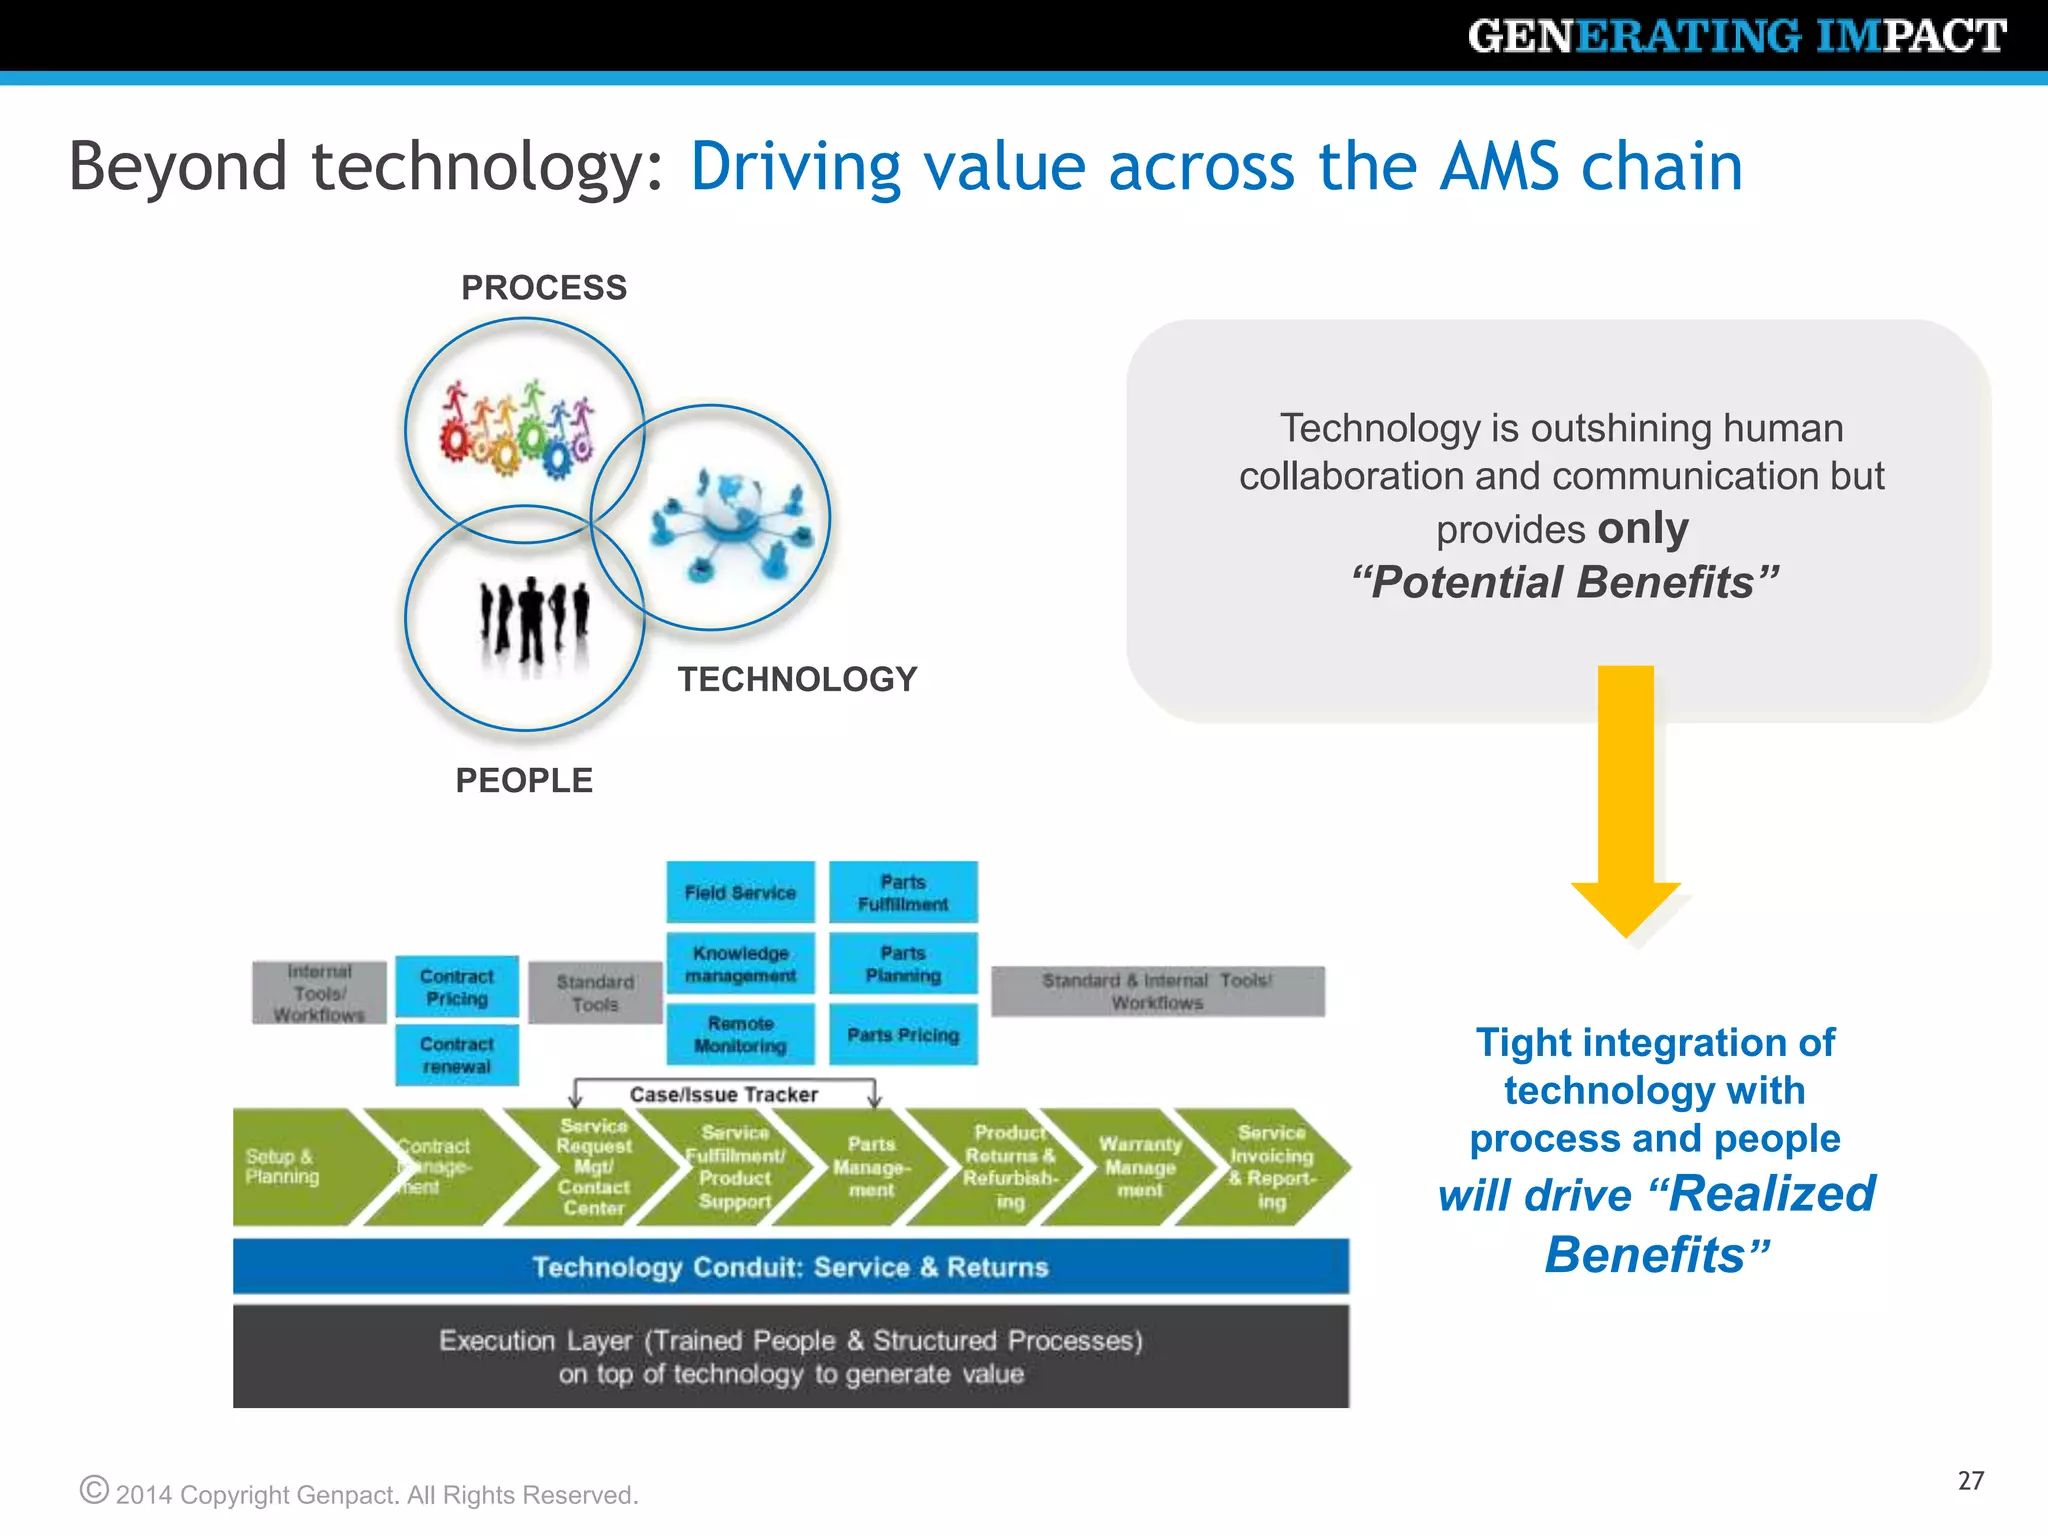
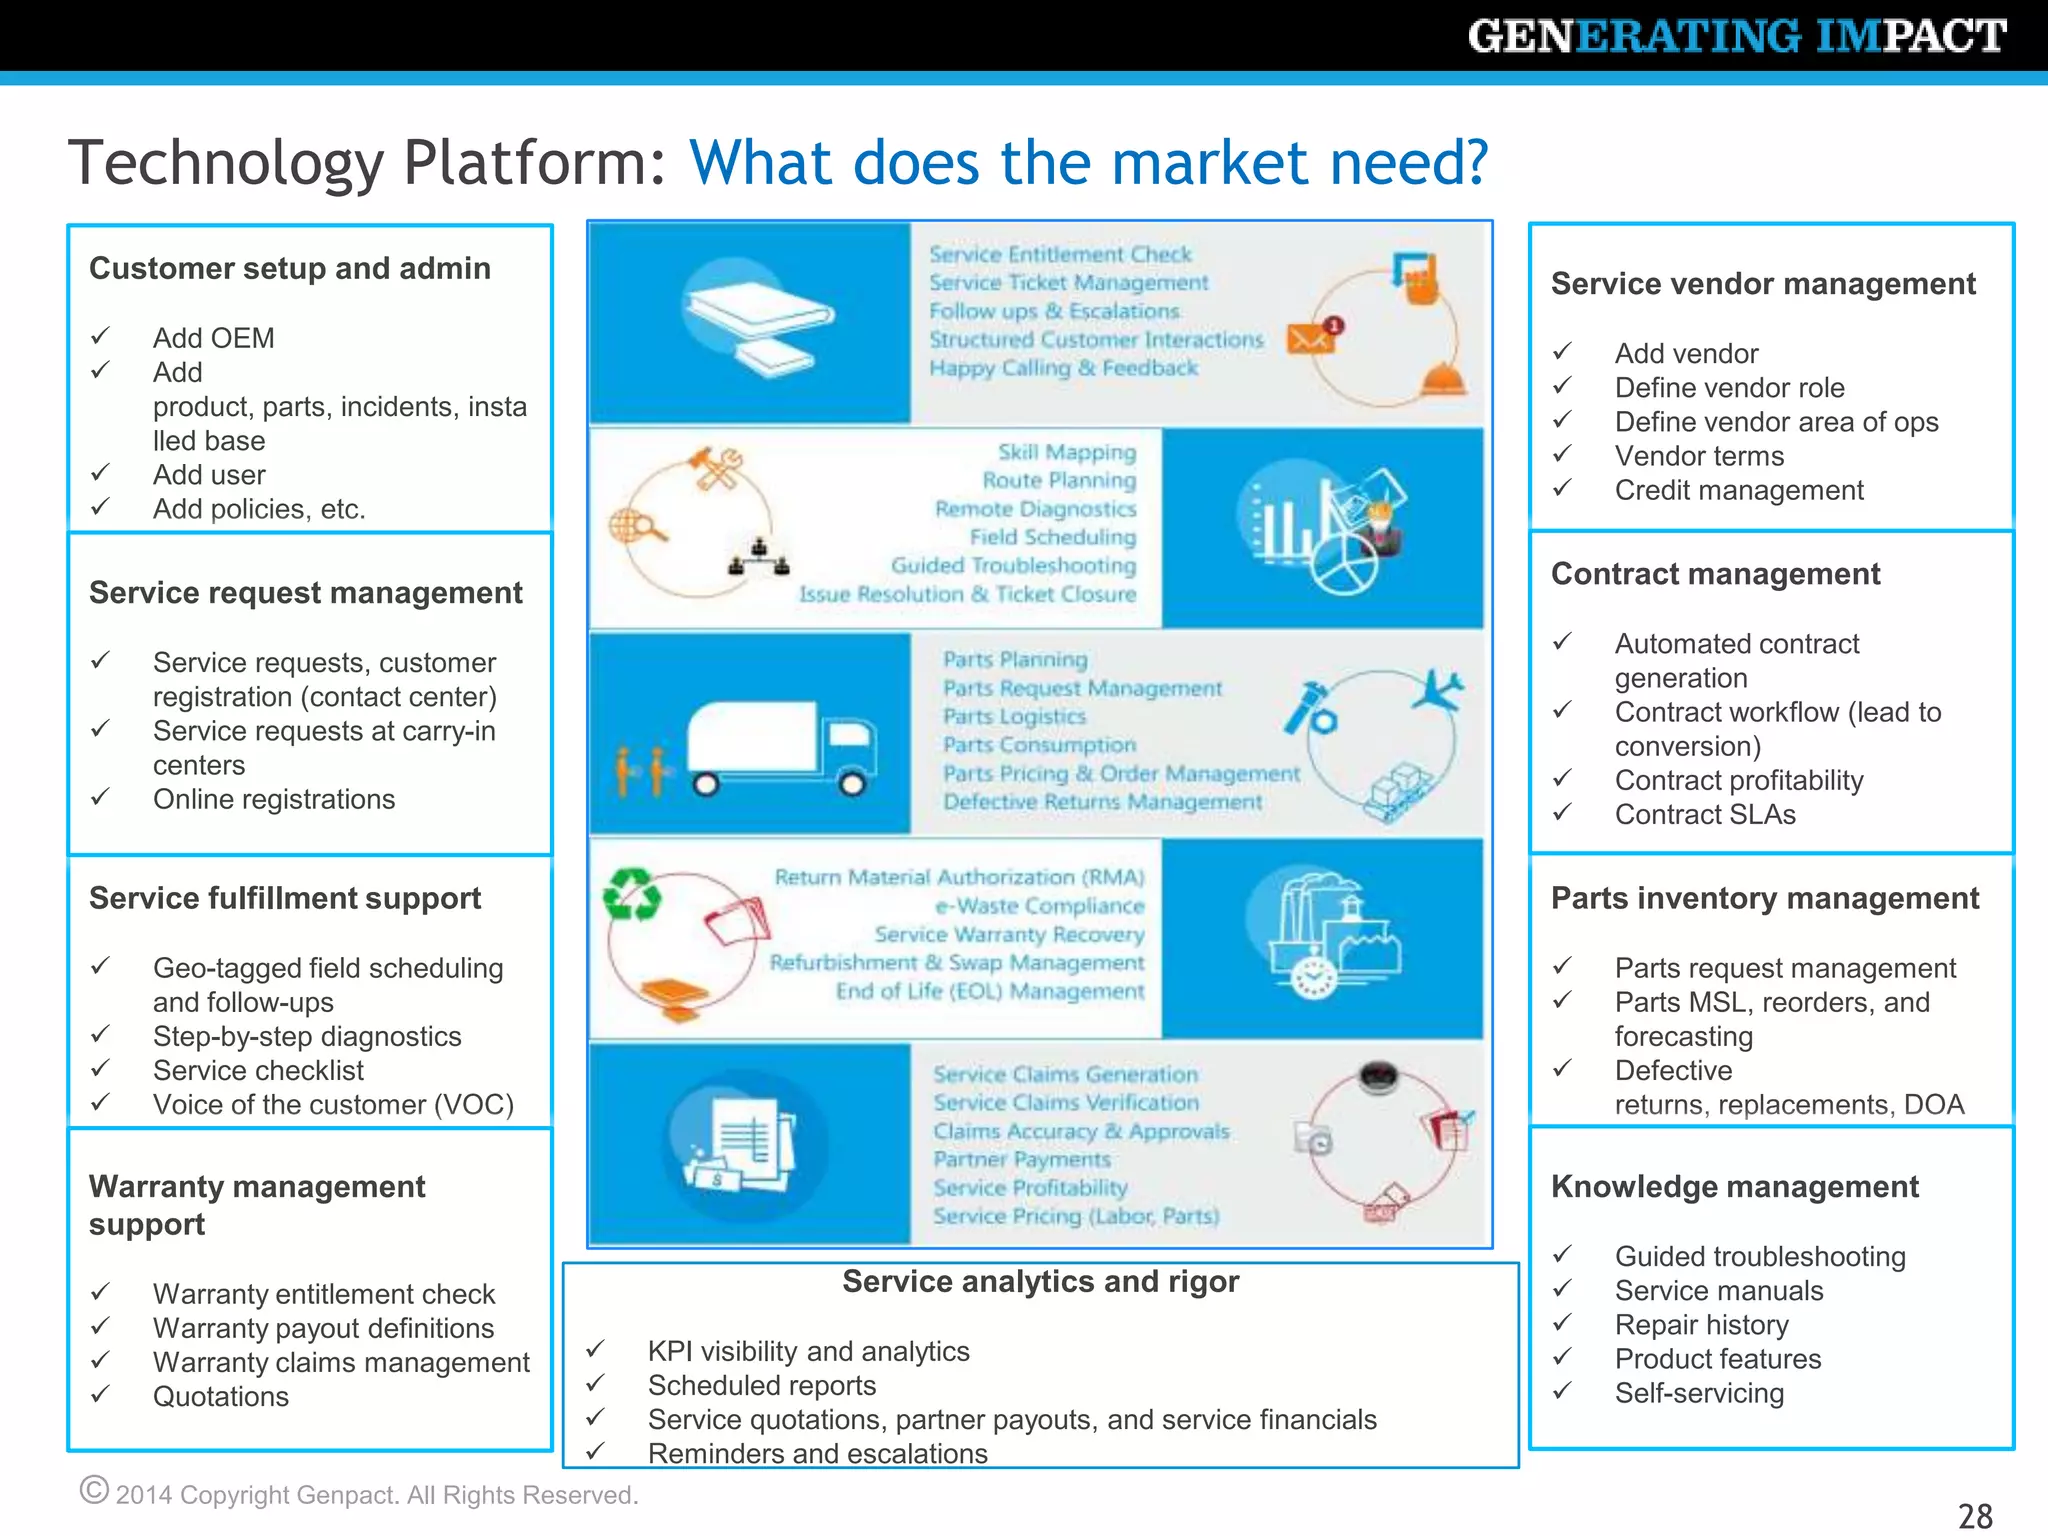
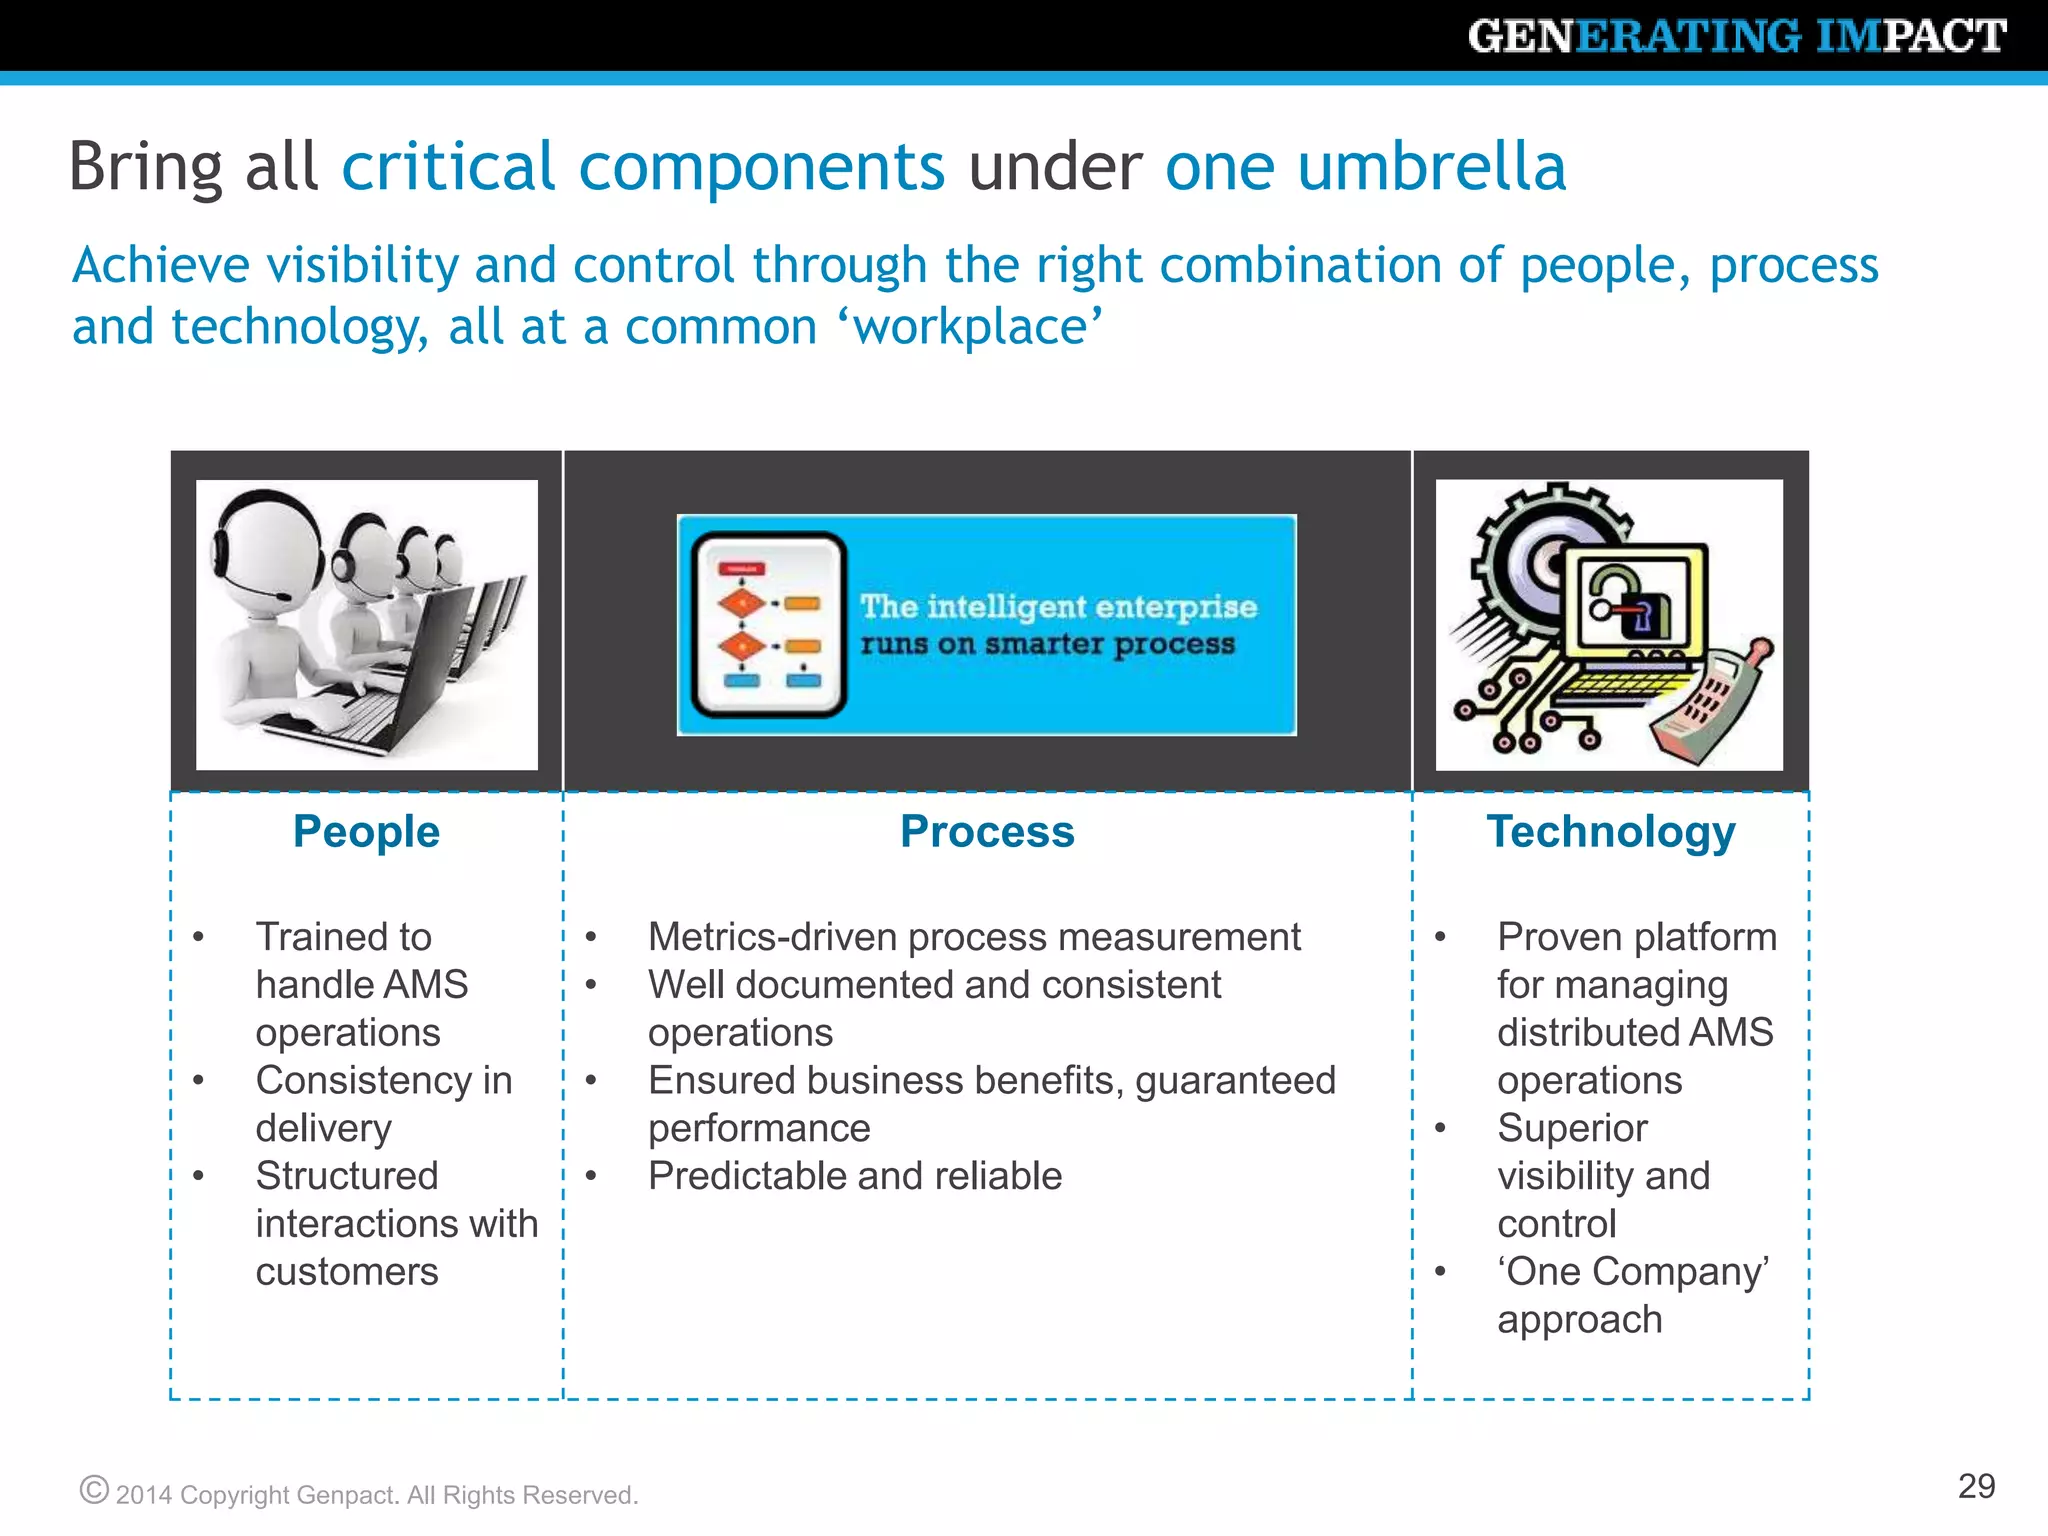
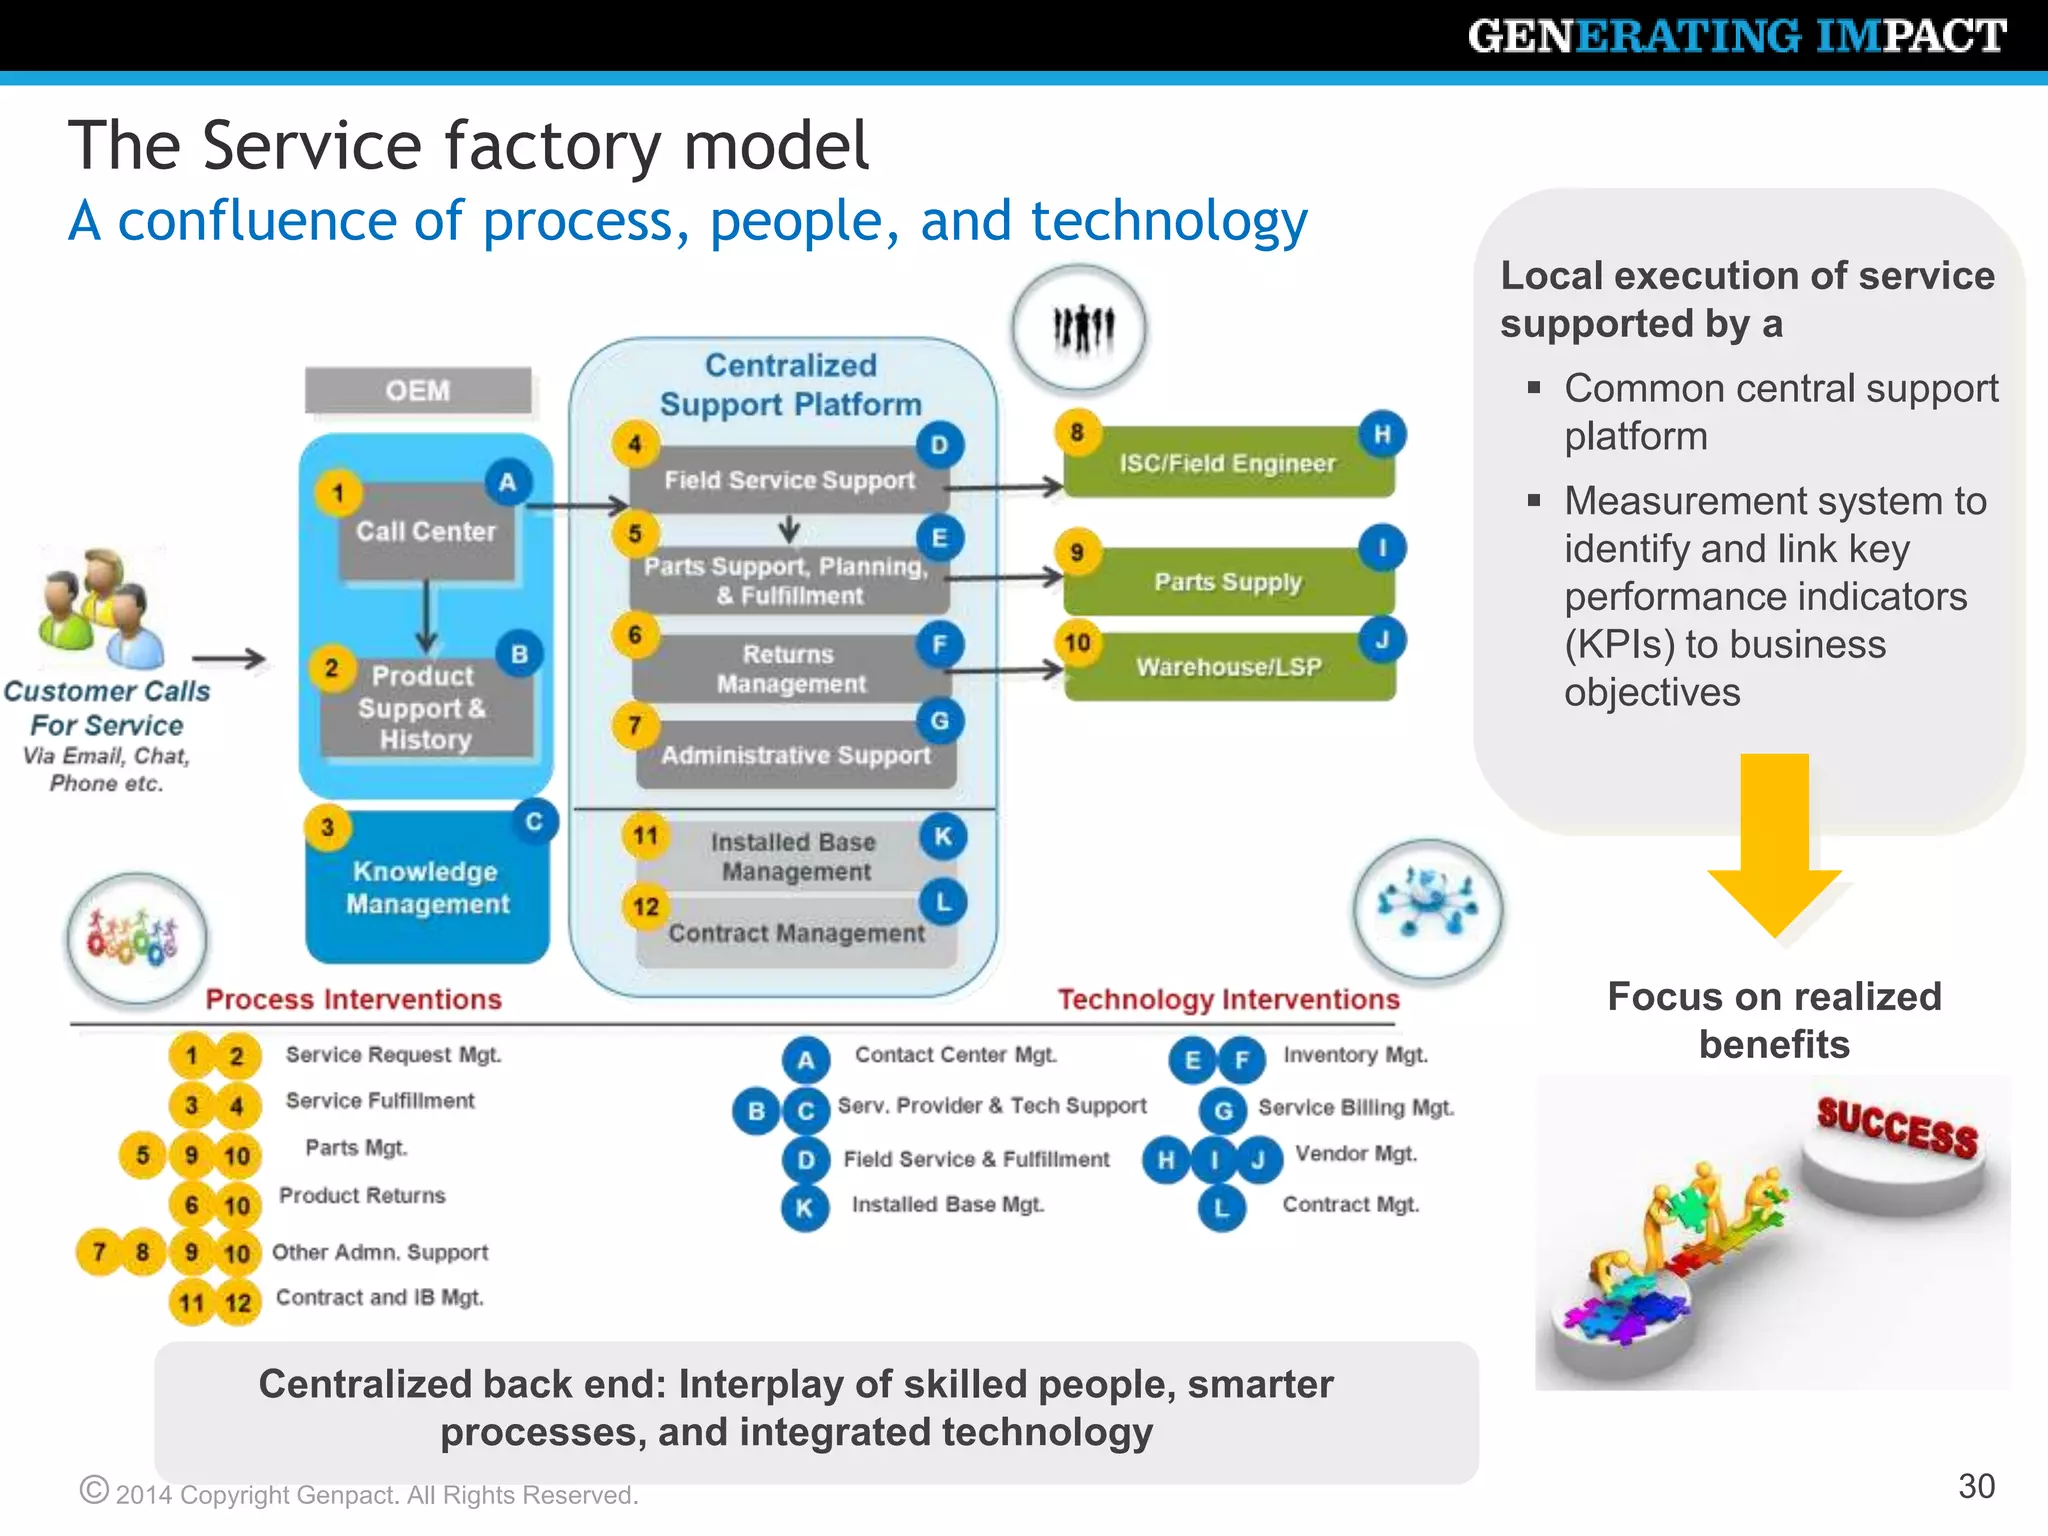
© 2014 Copyright Genpact. All Rights Reserved.
Maximizing service profitability at optimized cost to serve:
Next generation service process execution
aftermarket.services@genpact.com
© 2014 Copyright Genpact. All Rights Reserved.
A Global Business Process Services Leader: Process
Transformation and Outsourcing, Analytics, Technology
We help leaders of some
of the largest enterprises
transform and run
their processes and
operations, including
the very complex and
industry-specific
What
we do
Unbiased, agile combination
of process science, related
technology and analytics limits
upfront costs and enhances
future adaptability
Right critical mass:
• we are large (64,000+ global
staff) but our solutions
appropriately flexible
• our top management is
directly involved in our client
partnerships
How
we do it
Our
impact
We help enterprises to be
more competitive by
becoming more
intelligent: adaptive,
innovative, globally
effective and connected…
…by enabling tighter
management of costs,
risks, regulations,
and supporting growth
The results: US$22B* of impact for 800+ global clients
© 2014 Copyright Genpact. All Rights Reserved.
“A business absolutely devoted to service will have only
one worry about profits. They will be embarrassingly
large.”
3
Henry Ford
“An excellent product no longer guarantees business
success. Finding new sources of income and growth has
become a matter of competitive necessity for traditionally
product-oriented companies”
© 2014 Copyright Genpact. All Rights Reserved.
4
Organizations with higher “services” than “product” revenue
growth see their stocks rising!!!
Source: Report by Mckinsey - 2011
© 2014 Copyright Genpact. All Rights Reserved.
Are companies heeding the advice and FOCUSING well?
5
The real struggle lies in “FOCUS”
© 2014 Copyright Genpact. All Rights Reserved.
The Aftermarket Services (AMS) value chain
6
• Contract
monitoring
• Contract
renewals
• Contact center
• Product
support
/helpdesk
• Service parts
planning and
pricing
• Parts fulfillment
support
• Field service
support
• Remote
monitoring
• Warranty
claims
processing
• Warranty
supplier
recovery
• Operations
dashboard and
service / cost
analytics
• Installed base
management,
including IB
analytics
• Product
returns
support
Process
Interventions
ValueDriven
• IB service
coverage %
• Cost per sale /
renewal
• Contract
profitability
• Response time
• First call
resolution
• On-time
delivery
• Back orders
• Claim to
recovery TAT
• Analysis
accuracy
Service Growth Focus Service Execution Focus
Transaction Processing
and Reporting
Setup and
Planning
Service
Request
Management
Warranty
Management
Service
Fulfilment
Parts
Management
Service
Invoicing and
Reporting
Contract
Management
Product
Returns and
Refurbishing
GenpactAMS
Offerings
• Remote
resolution %
• FE utilization
• Cost of
reverse
logistics
• Repair TAT
© 2014 Copyright Genpact. All Rights Reserved.
A close look at the AMS space
If 100 units go the ‘Forward’ route
FORWARD via dealer or direct to home
REVERSE: Reuse, repair, recall, recycle
At least two units take the ‘Return’ route
© 2014 Copyright Genpact. All Rights Reserved.
AMS is an integral part of the reverse supply chain
Customer Support Operations
Call center, email support, or chat support.
Often it is a combination of all of these.
Logistics Operations
Receive goods from customers, move back to origin for
resale/replacement or to eWaste facilities
Storage & Warehousing Operations
Returned goods and parts are tagged, tracked, and stored
until decisions are taken for repair, reuse, resale, and scrap
Repair/Refurbish/Resale Operations
Inspect returned goods, repair, refurbish, revive and re-sell
AMS
Control
Control
Manage
Manage
8
© 2014 Copyright Genpact. All Rights Reserved.
What customers expect
They do not expect “too much.” They just expect “service delivery”
Customer Delight
Customer Ecstasy (High Maturity Level)
Customer Service (Base Maturity Level)
5%
95% of your
customers
will be happy
just with this
basic
compliance
High Maturity State
9
© 2014 Copyright Genpact. All Rights Reserved.© 2014 Copyright Genpact. All Rights Reserved.
No Automated
Escalations
No Checks &
Controls for
measuring
Partner
Performance
Lack of
Service
Culture
Cost Concerns
preceding
service
priorities
Lack of
Systemic
Interventions
High Dependency
on ASC/ISCs
No control
over
product
and service
life cycle
Manual and
outdated
processes
No
objective
review
mechanism
Despite best efforts, the result mostly is…
Customer and cost issues 10
© 2014 Copyright Genpact. All Rights Reserved.
Challenges to achieving $$ impact
11
 Lack of visibility into the installed base
data
 Low accuracy of the existing installed
base (IB)
 Growing market need to drive higher
contract coverage
 Lack of clarity in the “service products”
(contracts)
…driving service revenue …optimizing service cost
 Lack of visibility into Cost to Serve
 Broken link between customer contact and
service issue resolution
 Lack of standardized processes
 Significant parts availability/inventory
issues and field service responsiveness
issues
 Unclear job allocation and handoffs
 Lack of visibility into KPI/metrics to measure process efficiency and effectiveness
Key Industry Challenges In…
© 2014 Copyright Genpact. All Rights Reserved.
Multiple missing links are an opportunity for value creation
Highly
disaggregated
and broken
processes,
leading to unclear
handoffs
Service businesses
financially
challenged by
Brands’ service
organizations unable to
commit and execute
service levels
Brands unable to drive
Service Excellence and
Customer Confidence
Result
Service Growth Enablement Service Execution Support
Transaction Processing and
Reporting
Setup &
Planning
Service
Request
Management
Warranty Claim
Management
Parts
Management
Service
Fulfilment
Service
Reporting &
Analytics
Contract
Management
Returns &
Recovery
XX X XX
12
© 2014 Copyright Genpact. All Rights Reserved.
13
Focus and Forward: Effectiveness drives a much bigger
impact than efficiency
Effective measurement drives improvement:
Interplay of “smarter” processes, people, and technology is the key enabler
*Source: Blumberg Report
Efficiency
Metrics
Effectiveness
Metrics
Effectiveness Levers
Affecting BOs
• Field response TAT
• Parts OTIF
Service
Execution:
Issue resolution
% Reduction of service
requests on hold for parts
Improved productivity %
Point-in-time savings
Improved resolution %
Sustained savings growth
Integrated call field parts
Process & Execution
• IB coverage
• Contract profitability
Integrated IB and Contracts
Process & Execution
Service Growth
Enablement::
Contract and IB
expansion
• IB accuracy
• Contract
Renewal/expansion Rate
Service requests requiring parts to complete transaction range from
28% to 73%; manufacturing industry median: 43%*
Service Factory:
Integrated process and
execution
© 2014 Copyright Genpact. All Rights Reserved.
14
The 5 Cs of the foundation
C C CCustomer Satisfaction Cost Cash
Commitment
Competency
Change
Capture
Collaborate
 To serve
 Translated to goals and guidelines
 To execute
 Across the value chain
 Mindset
 Focus on issue and customer
C
C
C
C
C
 Sources of revenue (out of warranty)
 Segments of customer
 In the “service” ecosystem
 With external and internal parties
© 2014 Copyright Genpact. All Rights Reserved.
15
The fundamentals: R5 and A5
A5
R5
© 2014 Copyright Genpact. All Rights Reserved.
16
Did you know?
Process
People
Technology
 Companies that build Service Value Chains often find that 50 %
or more of their profits end up coming from after-sale service
and support
 Service businesses have much higher profitability than the
overall business unit – 76% higher on average
 Consolidation of field engineer support and parts triaging
teams can result in potential savings of ~15%
 Remote monitoring deployment can reduce emergency
dispatches by 30% and result in savings of ~5%
 Manufacturers often have individual, disjointed IT systems to
manage post sales services. An interconnected, holistic system
of related processes and technology platforms is MISSING
 Over the past few years, investments in service management
software have grown by 25% annually – 2.5 times the rate of
overall IT spending
Source: Reports by Accenture, Mckinsey, Deloitte; Genpact Insights
© 2014 Copyright Genpact. All Rights Reserved.
17
Service organizations are struggling to transform from cost to
profit centers
An effective “service delivery model” will enable this process
Enabling service
transformation
“Cost to Profit”
Optimize Cost to
Serve
Increase customer
satisfaction
Drive service
revenue
Enhance service
profitability
People Process
Technology
Service Delivery Model
KPI
measurement
framework
KPI
measurement
framework
© 2014 Copyright Genpact. All Rights Reserved.
18
Building blocks of an effective service delivery model
Next generation service and business process execution
Creating next generation
processes and institutionalizing KPIs
1
Technology platform as a key enabler
 Connect business level KPIs to
operational KPIs
 Provide visibility into L2 and L3 process
measurement metrics
 Explore inter-linkages between business
outcomes and process metrics
Creating a strong “backend” and
service delivery model
2
 Centralize service support to impact
service revenue and cost
 Decouple similar processes and
consolidate them
 Establish a seamless linkage between
customer contact and service issue
resolution
3
© 2014 Copyright Genpact. All Rights Reserved.
Presentation Title Goes Here
© 2014 Copyright Genpact. All Rights Reserved.
Intervention 1:
Institute KPIs centrally and create next
generation processes
© 2014 Copyright Genpact. All Rights Reserved.
KPIs to measure using AMS Smart Enterprise Processes
ILLUSTRATIVE
Request to Repair (R2R) Business Outcomes:
 Cost of Service
 Service Revenue
 Customer Loyalty
Service
Fulfillment
Warranty
Management
Parts Order
& Logistics
Setup &
Planning
Service
Invoicing &
Reporting
Service
Request
Management
Contract
Management
Level 2
Sub-process
Key
Performance
Measures
Level 3
Activities
Key
Performance
Measures
Level 1
SEPSM
Handle field
admin and
support tasks
Fix problems
remotely
Re-order/correct/
place new parts
orders
Tools
scheduling and
fulfilment
Service Provision & Field Support
Coordinate and
expedite with
service vendors
Complete field
service report
after FE debrief
• FE utilization
• Support cost per
repair
• Fulfillment TAT
• Remote
resolution
percentage
• Resolution TAT
• First time fixed
right
percentage
• Tat
• Answer rate
• Accuracy
• First time
response
• Order accuracy
• Tat
• Back order %age
• Tat
• Availability
percentage
• Tools calibration
percentage
• Tat
• Compliance
percentage
• Debriefing
accuracy
• Missed billing $
© 2014 Copyright Genpact. All Rights Reserved.
21
Establish Linkages Between performance measures and process
outcomes NOT EXHAUSTIVE
Max
Minimum
Median
Key Business Outcomes
Field
engineer
utilization
%
30 79
59
Key Performance
Drivers
% Asset
remotely
connected*
21 100
83
First time fix
rate %
27 86
66
On-time parts
delivery % 81 96
89
First time part
fill rate%
Work orders
completed late
%
% Back orders
TAT
compliance %
76
77
31 9
17
Deploy and
monitor
remotely
Field service
support
Key Performance MeasuresSub-processes Activities
Remote
resolution %
5 90
47
Fix problems
remotely
Available
capacity
Use analytical models for field
force forecasting and
scheduling
Wrench time
Dispatch the best-fit customer
engineer based on skills,
proximity, availability,
preference
Ensure service history records,
IB details, required parts/tools
info and other documentation is
provided to CE
Manage entire dispatch process
until closure and action on all
field support activities within
specified TAT
Expedite with logistics / 3PL
partner for on-time parts
deliveries onsite
Follow-up on open dispatch /
back-orders, handle exceptions,
liaise with vendors, etc. for
timely repair/deployment
82
IB accuracy %
Source: Aberdeen Service Management Benchmarks
© 2014 Copyright Genpact. All Rights Reserved.
22
How KPIs link to business outcomes to drive action
Service Parts
Management
2
Service Issue
Resolution
 Higher customer satisfaction
 Reduced service resolution TAT
 Reduced service cost
 Optimized field/warehouse
 Inventory
 Improved order fill rate
 Reduced order fulfillment TAT
1
• Percentage of total calls
resolved on initial contact
• Average cost per service
request
• Average length of call as a
percentage of target time
limit
• Just in time (JIT) delivery %
• Order fulfillment TAT
• Back orders as a percentage
of total parts orders
• Wrong shipment percentage
Business Outcome/ImpactService Area Related KPI
© 2014 Copyright Genpact. All Rights Reserved.
Presentation Title Goes Here
© 2014 Copyright Genpact. All Rights Reserved.
Intervention 2:
Creating a strong “backend” and
service delivery model
© 2014 Copyright Genpact. All Rights Reserved.
De-Couple, consolidate, and centralize: Building blocks
24
Field Service Parts Management
FE Scheduling
Dispatch
Creation
Field
Repair
Manage &
Track Field
Parts
Parts Ordering
Tools
Sourcing
Manage Field
Returns
FE Debrief
Field Admin &
Support Tasks
Field Service
Metrics
Reporting
Invoicing
Audit
Updating FE
Availability
Calendar
Parts
Logistics
Order Receipt
Estimate and
Promise
Delivery Date
Order
Entry
Follow-Up for
Back Orders
Shipment
Tracking
Parts returns
Parts
Expediting
Global Order
Triage
Parts planning
Scrap
Management
Field Parts
management
Centralized Support
Platform
Apply Lean/Six Sigma
principles
Establish link with local
physical execution
Field Admin Time Vs Wrench Time Parts Velocity Vs Fulfillment support costs
© 2014 Copyright Genpact. All Rights Reserved.
Centralized support platform: People and process
25
Call Center
Product
Support &
History
Field Service
Support
Parts
Support, Planning, and
Fulfillment
Returns
Management
Administrative
Support :
Service invoicing, etc.
ISC/Field Engineer
Parts Supply
Customer Calls
for Service
Via email, chat,
phone, etc.
Knowledge
Management
Centralized
Support Platform
OEM
Warehouse/LSP
Installed Base
Management
Contract Management
© 2014 Copyright Genpact. All Rights Reserved.
Presentation Title Goes Here
© 2014 Copyright Genpact. All Rights Reserved.
Intervention 3:
Technology as a key enabler
© 2014 Copyright Genpact. All Rights Reserved.
Beyond technology: Driving value across the AMS chain
27
Tight integration of
technology with
process and people
will drive “Realized
Benefits”
Technology is outshining human
collaboration and communication but
provides only
“Potential Benefits”
PROCESS
TECHNOLOGY
PEOPLE
© 2014 Copyright Genpact. All Rights Reserved.
28
Technology Platform: What does the market need?
Customer setup and admin
 Add OEM
 Add product, parts, incidents,
installed base
 Add user
 Add policies, etc.
Service fulfillment support
 Geo-tagged field scheduling
and follow-ups
 Step-by-step diagnostics
 Service checklist
 Voice of the customer (VOC)
Warranty management
support
 Warranty entitlement check
 Warranty payout definitions
 Warranty claims management
 Quotations
Service request management
 Service requests, customer
registration (contact center)
 Service requests at carry-in
centers
 Online registrations
Parts inventory management
 Parts request management
 Parts MSL, reorders, and
forecasting
 Defective returns,
replacements, DOA
Service vendor management
 Add vendor
 Define vendor role
 Define vendor area of ops
 Vendor terms
 Credit management
Knowledge management
 Guided troubleshooting
 Service manuals
 Repair history
 Product features
 Self-servicing
Contract management
 Automated contract
generation
 Contract workflow (lead to
conversion)
 Contract profitability
 Contract SLAs
Service analytics and rigor
 KPI visibility and analytics
 Scheduled reports
 Service quotations, partner payouts, and service financials
 Reminders and escalations
© 2014 Copyright Genpact. All Rights Reserved.
Bring all critical components under one umbrella
Achieve visibility and control through the right combination of people, process
and technology, all at a common ‘workplace’
People
• Trained to
handle AMS
operations
• Consistency in
delivery
• Structured
interactions with
customers
Process
• Metrics-driven process measurement
• Well documented and consistent
operations
• Ensured business benefits, guaranteed
performance
• Predictable and reliable
Technology
• Proven platform
for managing
distributed AMS
operations
• Superior
visibility and
control
• ‘One Company’
approach
29
© 2014 Copyright Genpact. All Rights Reserved.
The Service factory model
A confluence of process, people, and technology
30
Centralized back end: Interplay of skilled people, smarter
processes, and integrated technology
Local execution of service
supported by a
 Common central support
platform
 Measurement system to
identify and link key
performance indicators
(KPIs) to business
objectives
Focus on realized
benefits
© 2014 Copyright Genpact. All Rights Reserved.
About Genpact
Genpact Limited (NYSE: G) is a global leader in transforming and running business processes and
operations, including those that are complex and industry-specific. Our mission is to help clients become
more competitive by making their enterprises more intelligent through becoming more adaptive,
innovative, globally effective and connected to their own clients.
Genpact stands for Generating Impact – visible in tighter cost management as well as better management
of risk, regulations and growth for hundreds of long-term clients including more than 100 of the Fortune
Global 500. Our approach is distinctive – we offer an unbiased, agile combination of smarter processes,
crystallized in our Smart Enterprise Processes (SEPSM) proprietary framework, along with analytics and
technology, which limits upfront investments and enhances future adaptability.
We have global critical mass – 62,000+ employees in 24 countries with key management and corporate
offices in New York City – while remaining flexible and collaborative, and a management team that drives
client partnerships personally.
Our history is unique – behind our single-minded passion for process and operational excellence is the
Lean and Six Sigma heritage of a former General Electric division that has served GE businesses for
more than 15 years.
For more information, visit www.genpact.com. Follow Genpact on Twitter, Facebook, and LinkedIn.

Maximizing service profitability at optimized cost to serve: Next generation service process execution

  • 1.
    © 2014 CopyrightGenpact. All Rights Reserved. © 2014 Copyright Genpact. All Rights Reserved. Maximizing service profitability at optimized cost to serve: Next generation service process execution aftermarket.services@genpact.com
  • 2.
    © 2014 CopyrightGenpact. All Rights Reserved. A Global Business Process Services Leader: Process Transformation and Outsourcing, Analytics, Technology We help leaders of some of the largest enterprises transform and run their processes and operations, including the very complex and industry-specific What we do Unbiased, agile combination of process science, related technology and analytics limits upfront costs and enhances future adaptability Right critical mass: • we are large (64,000+ global staff) but our solutions appropriately flexible • our top management is directly involved in our client partnerships How we do it Our impact We help enterprises to be more competitive by becoming more intelligent: adaptive, innovative, globally effective and connected… …by enabling tighter management of costs, risks, regulations, and supporting growth The results: US$22B* of impact for 800+ global clients
  • 3.
    © 2014 CopyrightGenpact. All Rights Reserved. “A business absolutely devoted to service will have only one worry about profits. They will be embarrassingly large.” 3 Henry Ford “An excellent product no longer guarantees business success. Finding new sources of income and growth has become a matter of competitive necessity for traditionally product-oriented companies”
  • 4.
    © 2014 CopyrightGenpact. All Rights Reserved. 4 Organizations with higher “services” than “product” revenue growth see their stocks rising!!! Source: Report by Mckinsey - 2011
  • 5.
    © 2014 CopyrightGenpact. All Rights Reserved. Are companies heeding the advice and FOCUSING well? 5 The real struggle lies in “FOCUS”
  • 6.
    © 2014 CopyrightGenpact. All Rights Reserved. The Aftermarket Services (AMS) value chain 6 • Contract monitoring • Contract renewals • Contact center • Product support /helpdesk • Service parts planning and pricing • Parts fulfillment support • Field service support • Remote monitoring • Warranty claims processing • Warranty supplier recovery • Operations dashboard and service / cost analytics • Installed base management, including IB analytics • Product returns support Process Interventions ValueDriven • IB service coverage % • Cost per sale / renewal • Contract profitability • Response time • First call resolution • On-time delivery • Back orders • Claim to recovery TAT • Analysis accuracy Service Growth Focus Service Execution Focus Transaction Processing and Reporting Setup and Planning Service Request Management Warranty Management Service Fulfilment Parts Management Service Invoicing and Reporting Contract Management Product Returns and Refurbishing GenpactAMS Offerings • Remote resolution % • FE utilization • Cost of reverse logistics • Repair TAT
  • 7.
    © 2014 CopyrightGenpact. All Rights Reserved. A close look at the AMS space If 100 units go the ‘Forward’ route FORWARD via dealer or direct to home REVERSE: Reuse, repair, recall, recycle At least two units take the ‘Return’ route
  • 8.
    © 2014 CopyrightGenpact. All Rights Reserved. AMS is an integral part of the reverse supply chain Customer Support Operations Call center, email support, or chat support. Often it is a combination of all of these. Logistics Operations Receive goods from customers, move back to origin for resale/replacement or to eWaste facilities Storage & Warehousing Operations Returned goods and parts are tagged, tracked, and stored until decisions are taken for repair, reuse, resale, and scrap Repair/Refurbish/Resale Operations Inspect returned goods, repair, refurbish, revive and re-sell AMS Control Control Manage Manage 8
  • 9.
    © 2014 CopyrightGenpact. All Rights Reserved. What customers expect They do not expect “too much.” They just expect “service delivery” Customer Delight Customer Ecstasy (High Maturity Level) Customer Service (Base Maturity Level) 5% 95% of your customers will be happy just with this basic compliance High Maturity State 9
  • 10.
    © 2014 CopyrightGenpact. All Rights Reserved.© 2014 Copyright Genpact. All Rights Reserved. No Automated Escalations No Checks & Controls for measuring Partner Performance Lack of Service Culture Cost Concerns preceding service priorities Lack of Systemic Interventions High Dependency on ASC/ISCs No control over product and service life cycle Manual and outdated processes No objective review mechanism Despite best efforts, the result mostly is… Customer and cost issues 10
  • 11.
    © 2014 CopyrightGenpact. All Rights Reserved. Challenges to achieving $$ impact 11  Lack of visibility into the installed base data  Low accuracy of the existing installed base (IB)  Growing market need to drive higher contract coverage  Lack of clarity in the “service products” (contracts) …driving service revenue …optimizing service cost  Lack of visibility into Cost to Serve  Broken link between customer contact and service issue resolution  Lack of standardized processes  Significant parts availability/inventory issues and field service responsiveness issues  Unclear job allocation and handoffs  Lack of visibility into KPI/metrics to measure process efficiency and effectiveness Key Industry Challenges In…
  • 12.
    © 2014 CopyrightGenpact. All Rights Reserved. Multiple missing links are an opportunity for value creation Highly disaggregated and broken processes, leading to unclear handoffs Service businesses financially challenged by Brands’ service organizations unable to commit and execute service levels Brands unable to drive Service Excellence and Customer Confidence Result Service Growth Enablement Service Execution Support Transaction Processing and Reporting Setup & Planning Service Request Management Warranty Claim Management Parts Management Service Fulfilment Service Reporting & Analytics Contract Management Returns & Recovery XX X XX 12
  • 13.
    © 2014 CopyrightGenpact. All Rights Reserved. 13 Focus and Forward: Effectiveness drives a much bigger impact than efficiency Effective measurement drives improvement: Interplay of “smarter” processes, people, and technology is the key enabler *Source: Blumberg Report Efficiency Metrics Effectiveness Metrics Effectiveness Levers Affecting BOs • Field response TAT • Parts OTIF Service Execution: Issue resolution % Reduction of service requests on hold for parts Improved productivity % Point-in-time savings Improved resolution % Sustained savings growth Integrated call field parts Process & Execution • IB coverage • Contract profitability Integrated IB and Contracts Process & Execution Service Growth Enablement:: Contract and IB expansion • IB accuracy • Contract Renewal/expansion Rate Service requests requiring parts to complete transaction range from 28% to 73%; manufacturing industry median: 43%* Service Factory: Integrated process and execution
  • 14.
    © 2014 CopyrightGenpact. All Rights Reserved. 14 The 5 Cs of the foundation C C CCustomer Satisfaction Cost Cash Commitment Competency Change Capture Collaborate  To serve  Translated to goals and guidelines  To execute  Across the value chain  Mindset  Focus on issue and customer C C C C C  Sources of revenue (out of warranty)  Segments of customer  In the “service” ecosystem  With external and internal parties
  • 15.
    © 2014 CopyrightGenpact. All Rights Reserved. 15 The fundamentals: R5 and A5 A5 R5
  • 16.
    © 2014 CopyrightGenpact. All Rights Reserved. 16 Did you know? Process People Technology  Companies that build Service Value Chains often find that 50 % or more of their profits end up coming from after-sale service and support  Service businesses have much higher profitability than the overall business unit – 76% higher on average  Consolidation of field engineer support and parts triaging teams can result in potential savings of ~15%  Remote monitoring deployment can reduce emergency dispatches by 30% and result in savings of ~5%  Manufacturers often have individual, disjointed IT systems to manage post sales services. An interconnected, holistic system of related processes and technology platforms is MISSING  Over the past few years, investments in service management software have grown by 25% annually – 2.5 times the rate of overall IT spending Source: Reports by Accenture, Mckinsey, Deloitte; Genpact Insights
  • 17.
    © 2014 CopyrightGenpact. All Rights Reserved. 17 Service organizations are struggling to transform from cost to profit centers An effective “service delivery model” will enable this process Enabling service transformation “Cost to Profit” Optimize Cost to Serve Increase customer satisfaction Drive service revenue Enhance service profitability People Process Technology Service Delivery Model KPI measurement framework KPI measurement framework
  • 18.
    © 2014 CopyrightGenpact. All Rights Reserved. 18 Building blocks of an effective service delivery model Next generation service and business process execution Creating next generation processes and institutionalizing KPIs 1 Technology platform as a key enabler  Connect business level KPIs to operational KPIs  Provide visibility into L2 and L3 process measurement metrics  Explore inter-linkages between business outcomes and process metrics Creating a strong “backend” and service delivery model 2  Centralize service support to impact service revenue and cost  Decouple similar processes and consolidate them  Establish a seamless linkage between customer contact and service issue resolution 3
  • 19.
    © 2014 CopyrightGenpact. All Rights Reserved. Presentation Title Goes Here © 2014 Copyright Genpact. All Rights Reserved. Intervention 1: Institute KPIs centrally and create next generation processes
  • 20.
    © 2014 CopyrightGenpact. All Rights Reserved. KPIs to measure using AMS Smart Enterprise Processes ILLUSTRATIVE Request to Repair (R2R) Business Outcomes:  Cost of Service  Service Revenue  Customer Loyalty Service Fulfillment Warranty Management Parts Order & Logistics Setup & Planning Service Invoicing & Reporting Service Request Management Contract Management Level 2 Sub-process Key Performance Measures Level 3 Activities Key Performance Measures Level 1 SEPSM Handle field admin and support tasks Fix problems remotely Re-order/correct/ place new parts orders Tools scheduling and fulfilment Service Provision & Field Support Coordinate and expedite with service vendors Complete field service report after FE debrief • FE utilization • Support cost per repair • Fulfillment TAT • Remote resolution percentage • Resolution TAT • First time fixed right percentage • Tat • Answer rate • Accuracy • First time response • Order accuracy • Tat • Back order %age • Tat • Availability percentage • Tools calibration percentage • Tat • Compliance percentage • Debriefing accuracy • Missed billing $
  • 21.
    © 2014 CopyrightGenpact. All Rights Reserved. 21 Establish Linkages Between performance measures and process outcomes NOT EXHAUSTIVE Max Minimum Median Key Business Outcomes Field engineer utilization % 30 79 59 Key Performance Drivers % Asset remotely connected* 21 100 83 First time fix rate % 27 86 66 On-time parts delivery % 81 96 89 First time part fill rate% Work orders completed late % % Back orders TAT compliance % 76 77 31 9 17 Deploy and monitor remotely Field service support Key Performance MeasuresSub-processes Activities Remote resolution % 5 90 47 Fix problems remotely Available capacity Use analytical models for field force forecasting and scheduling Wrench time Dispatch the best-fit customer engineer based on skills, proximity, availability, preference Ensure service history records, IB details, required parts/tools info and other documentation is provided to CE Manage entire dispatch process until closure and action on all field support activities within specified TAT Expedite with logistics / 3PL partner for on-time parts deliveries onsite Follow-up on open dispatch / back-orders, handle exceptions, liaise with vendors, etc. for timely repair/deployment 82 IB accuracy % Source: Aberdeen Service Management Benchmarks
  • 22.
    © 2014 CopyrightGenpact. All Rights Reserved. 22 How KPIs link to business outcomes to drive action Service Parts Management 2 Service Issue Resolution  Higher customer satisfaction  Reduced service resolution TAT  Reduced service cost  Optimized field/warehouse  Inventory  Improved order fill rate  Reduced order fulfillment TAT 1 • Percentage of total calls resolved on initial contact • Average cost per service request • Average length of call as a percentage of target time limit • Just in time (JIT) delivery % • Order fulfillment TAT • Back orders as a percentage of total parts orders • Wrong shipment percentage Business Outcome/ImpactService Area Related KPI
  • 23.
    © 2014 CopyrightGenpact. All Rights Reserved. Presentation Title Goes Here © 2014 Copyright Genpact. All Rights Reserved. Intervention 2: Creating a strong “backend” and service delivery model
  • 24.
    © 2014 CopyrightGenpact. All Rights Reserved. De-Couple, consolidate, and centralize: Building blocks 24 Field Service Parts Management FE Scheduling Dispatch Creation Field Repair Manage & Track Field Parts Parts Ordering Tools Sourcing Manage Field Returns FE Debrief Field Admin & Support Tasks Field Service Metrics Reporting Invoicing Audit Updating FE Availability Calendar Parts Logistics Order Receipt Estimate and Promise Delivery Date Order Entry Follow-Up for Back Orders Shipment Tracking Parts returns Parts Expediting Global Order Triage Parts planning Scrap Management Field Parts management Centralized Support Platform Apply Lean/Six Sigma principles Establish link with local physical execution Field Admin Time Vs Wrench Time Parts Velocity Vs Fulfillment support costs
  • 25.
    © 2014 CopyrightGenpact. All Rights Reserved. Centralized support platform: People and process 25 Call Center Product Support & History Field Service Support Parts Support, Planning, and Fulfillment Returns Management Administrative Support : Service invoicing, etc. ISC/Field Engineer Parts Supply Customer Calls for Service Via email, chat, phone, etc. Knowledge Management Centralized Support Platform OEM Warehouse/LSP Installed Base Management Contract Management
  • 26.
    © 2014 CopyrightGenpact. All Rights Reserved. Presentation Title Goes Here © 2014 Copyright Genpact. All Rights Reserved. Intervention 3: Technology as a key enabler
  • 27.
    © 2014 CopyrightGenpact. All Rights Reserved. Beyond technology: Driving value across the AMS chain 27 Tight integration of technology with process and people will drive “Realized Benefits” Technology is outshining human collaboration and communication but provides only “Potential Benefits” PROCESS TECHNOLOGY PEOPLE
  • 28.
    © 2014 CopyrightGenpact. All Rights Reserved. 28 Technology Platform: What does the market need? Customer setup and admin  Add OEM  Add product, parts, incidents, installed base  Add user  Add policies, etc. Service fulfillment support  Geo-tagged field scheduling and follow-ups  Step-by-step diagnostics  Service checklist  Voice of the customer (VOC) Warranty management support  Warranty entitlement check  Warranty payout definitions  Warranty claims management  Quotations Service request management  Service requests, customer registration (contact center)  Service requests at carry-in centers  Online registrations Parts inventory management  Parts request management  Parts MSL, reorders, and forecasting  Defective returns, replacements, DOA Service vendor management  Add vendor  Define vendor role  Define vendor area of ops  Vendor terms  Credit management Knowledge management  Guided troubleshooting  Service manuals  Repair history  Product features  Self-servicing Contract management  Automated contract generation  Contract workflow (lead to conversion)  Contract profitability  Contract SLAs Service analytics and rigor  KPI visibility and analytics  Scheduled reports  Service quotations, partner payouts, and service financials  Reminders and escalations
  • 29.
    © 2014 CopyrightGenpact. All Rights Reserved. Bring all critical components under one umbrella Achieve visibility and control through the right combination of people, process and technology, all at a common ‘workplace’ People • Trained to handle AMS operations • Consistency in delivery • Structured interactions with customers Process • Metrics-driven process measurement • Well documented and consistent operations • Ensured business benefits, guaranteed performance • Predictable and reliable Technology • Proven platform for managing distributed AMS operations • Superior visibility and control • ‘One Company’ approach 29
  • 30.
    © 2014 CopyrightGenpact. All Rights Reserved. The Service factory model A confluence of process, people, and technology 30 Centralized back end: Interplay of skilled people, smarter processes, and integrated technology Local execution of service supported by a  Common central support platform  Measurement system to identify and link key performance indicators (KPIs) to business objectives Focus on realized benefits
  • 31.
    © 2014 CopyrightGenpact. All Rights Reserved. About Genpact Genpact Limited (NYSE: G) is a global leader in transforming and running business processes and operations, including those that are complex and industry-specific. Our mission is to help clients become more competitive by making their enterprises more intelligent through becoming more adaptive, innovative, globally effective and connected to their own clients. Genpact stands for Generating Impact – visible in tighter cost management as well as better management of risk, regulations and growth for hundreds of long-term clients including more than 100 of the Fortune Global 500. Our approach is distinctive – we offer an unbiased, agile combination of smarter processes, crystallized in our Smart Enterprise Processes (SEPSM) proprietary framework, along with analytics and technology, which limits upfront investments and enhances future adaptability. We have global critical mass – 62,000+ employees in 24 countries with key management and corporate offices in New York City – while remaining flexible and collaborative, and a management team that drives client partnerships personally. Our history is unique – behind our single-minded passion for process and operational excellence is the Lean and Six Sigma heritage of a former General Electric division that has served GE businesses for more than 15 years. For more information, visit www.genpact.com. Follow Genpact on Twitter, Facebook, and LinkedIn.