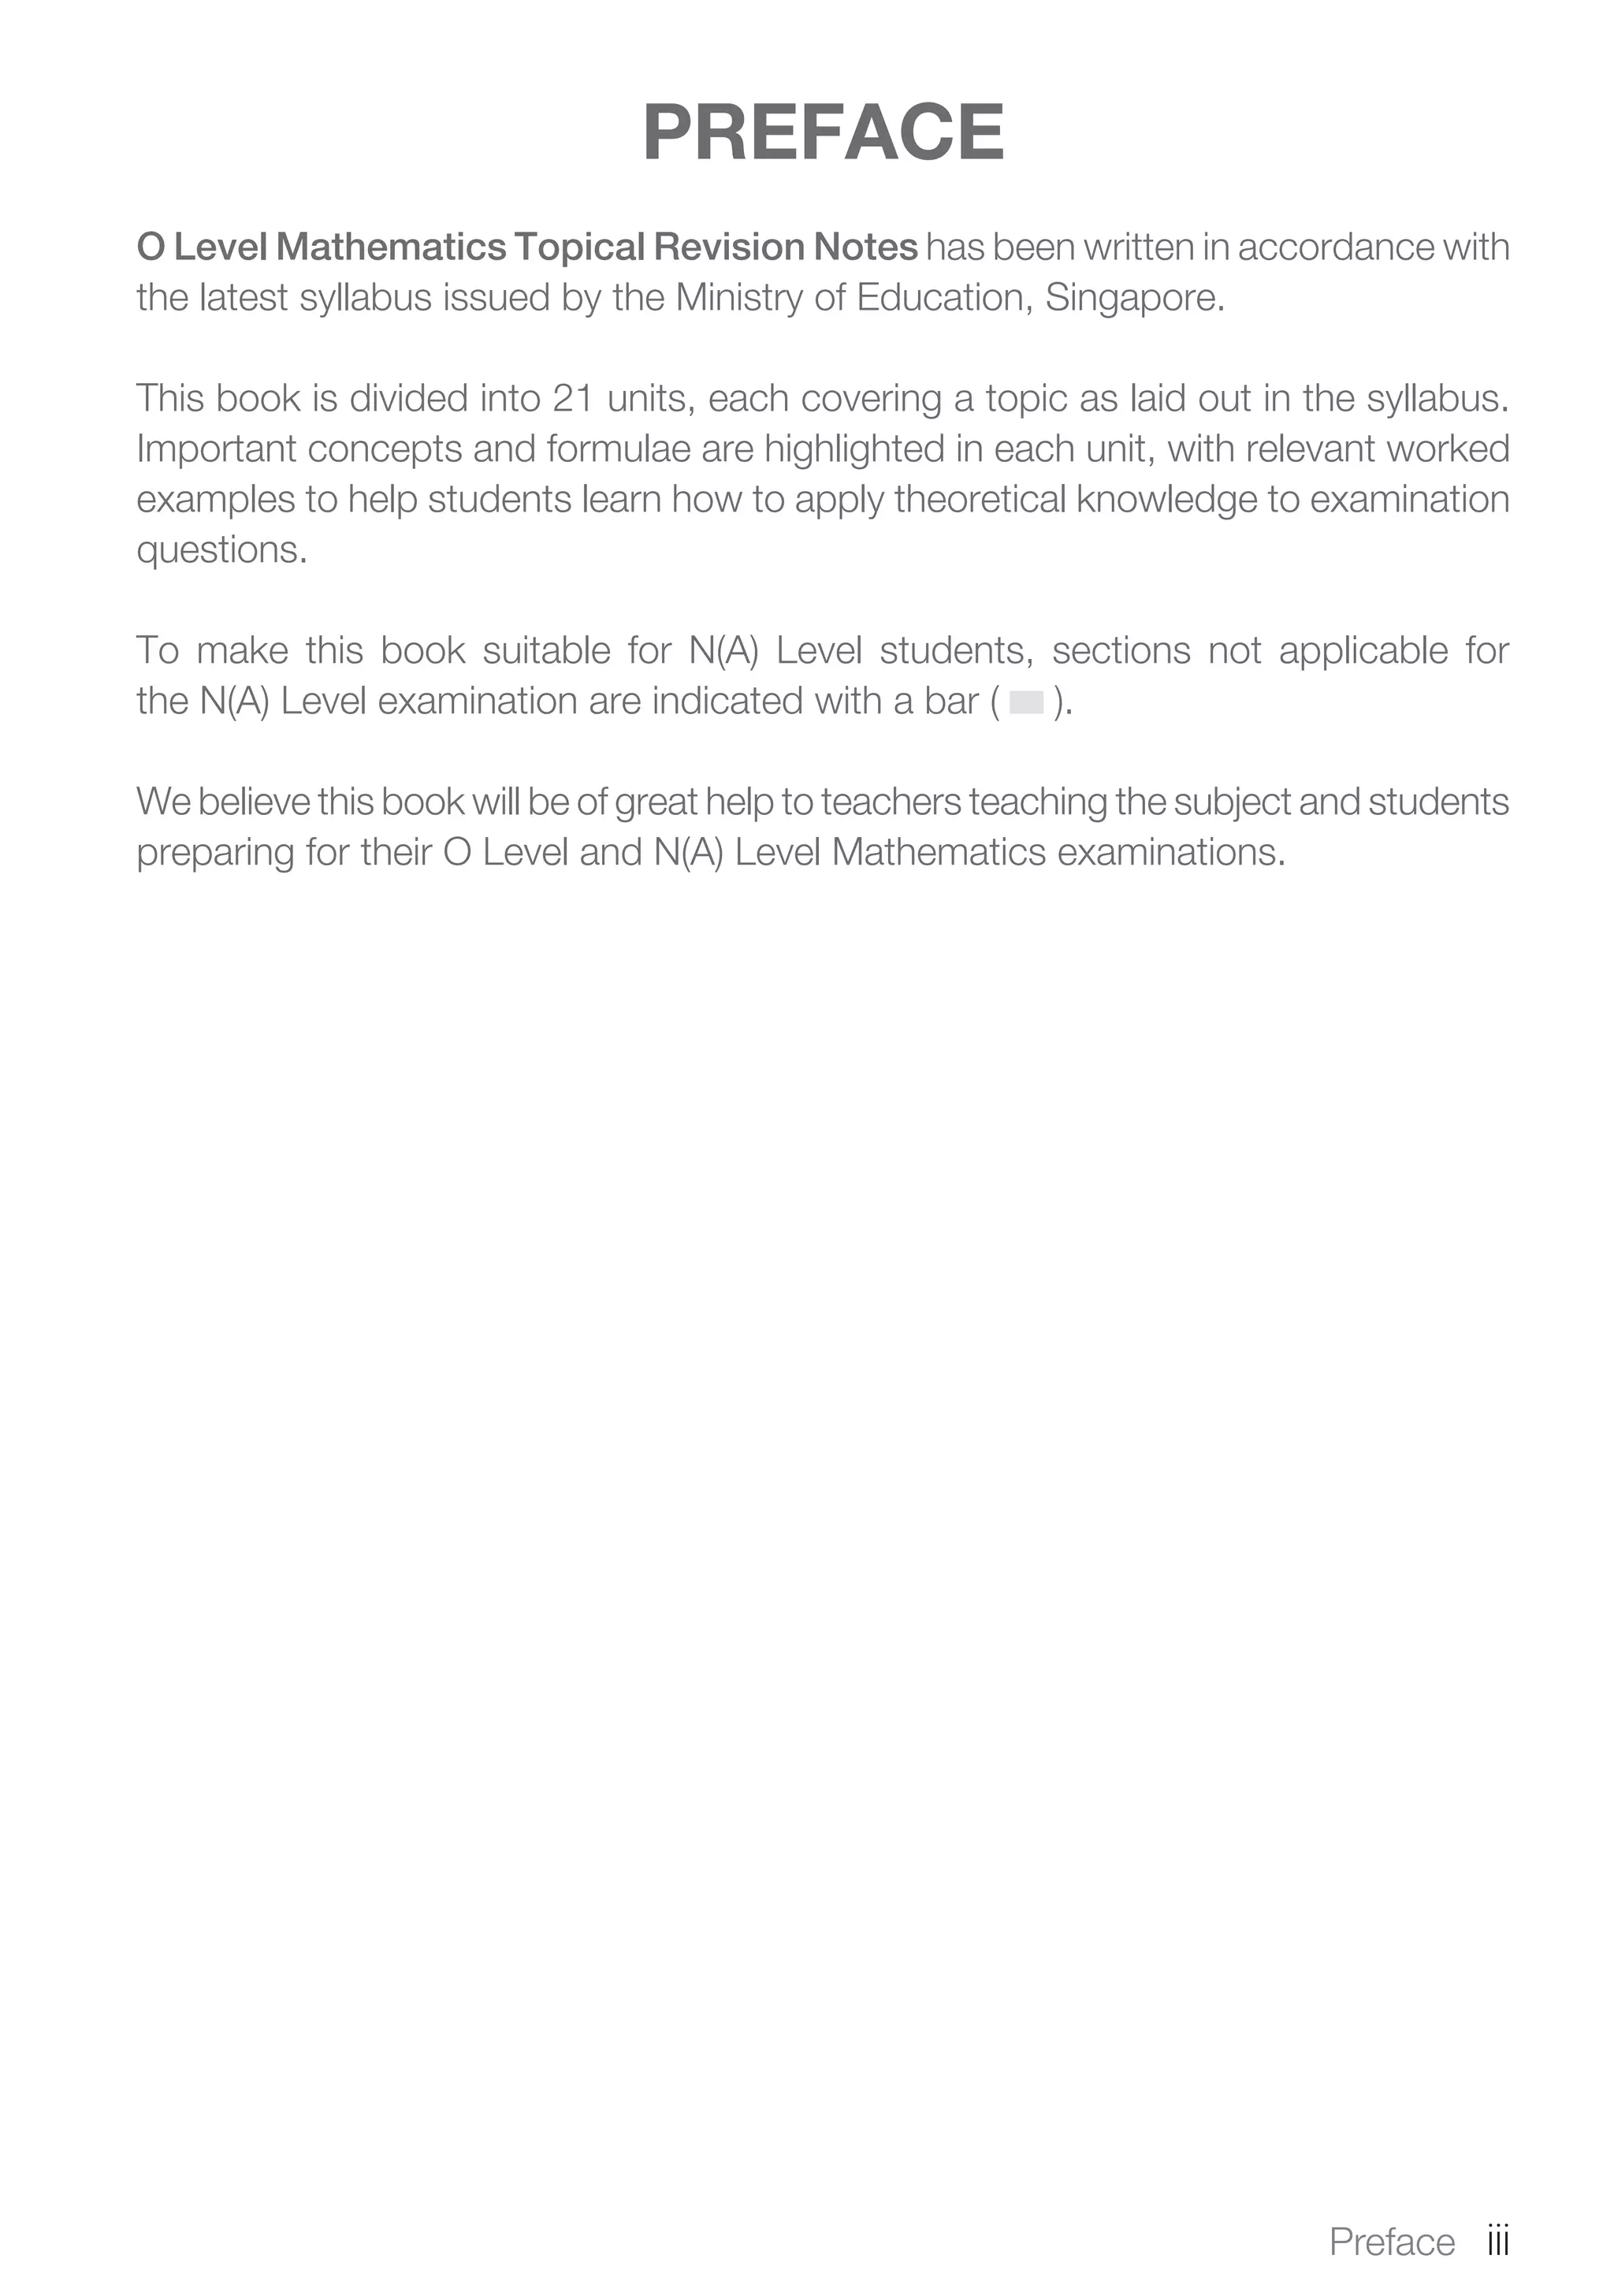
The document is a publication by Shinglee Publishers that focuses on O-level mathematics revision notes aligned with Singapore's Ministry of Education syllabus. It contains 21 units covering various mathematical topics, important concepts, formulae, and worked examples to assist students and teachers. The book also includes sections specifically indicated for N(A) level students.

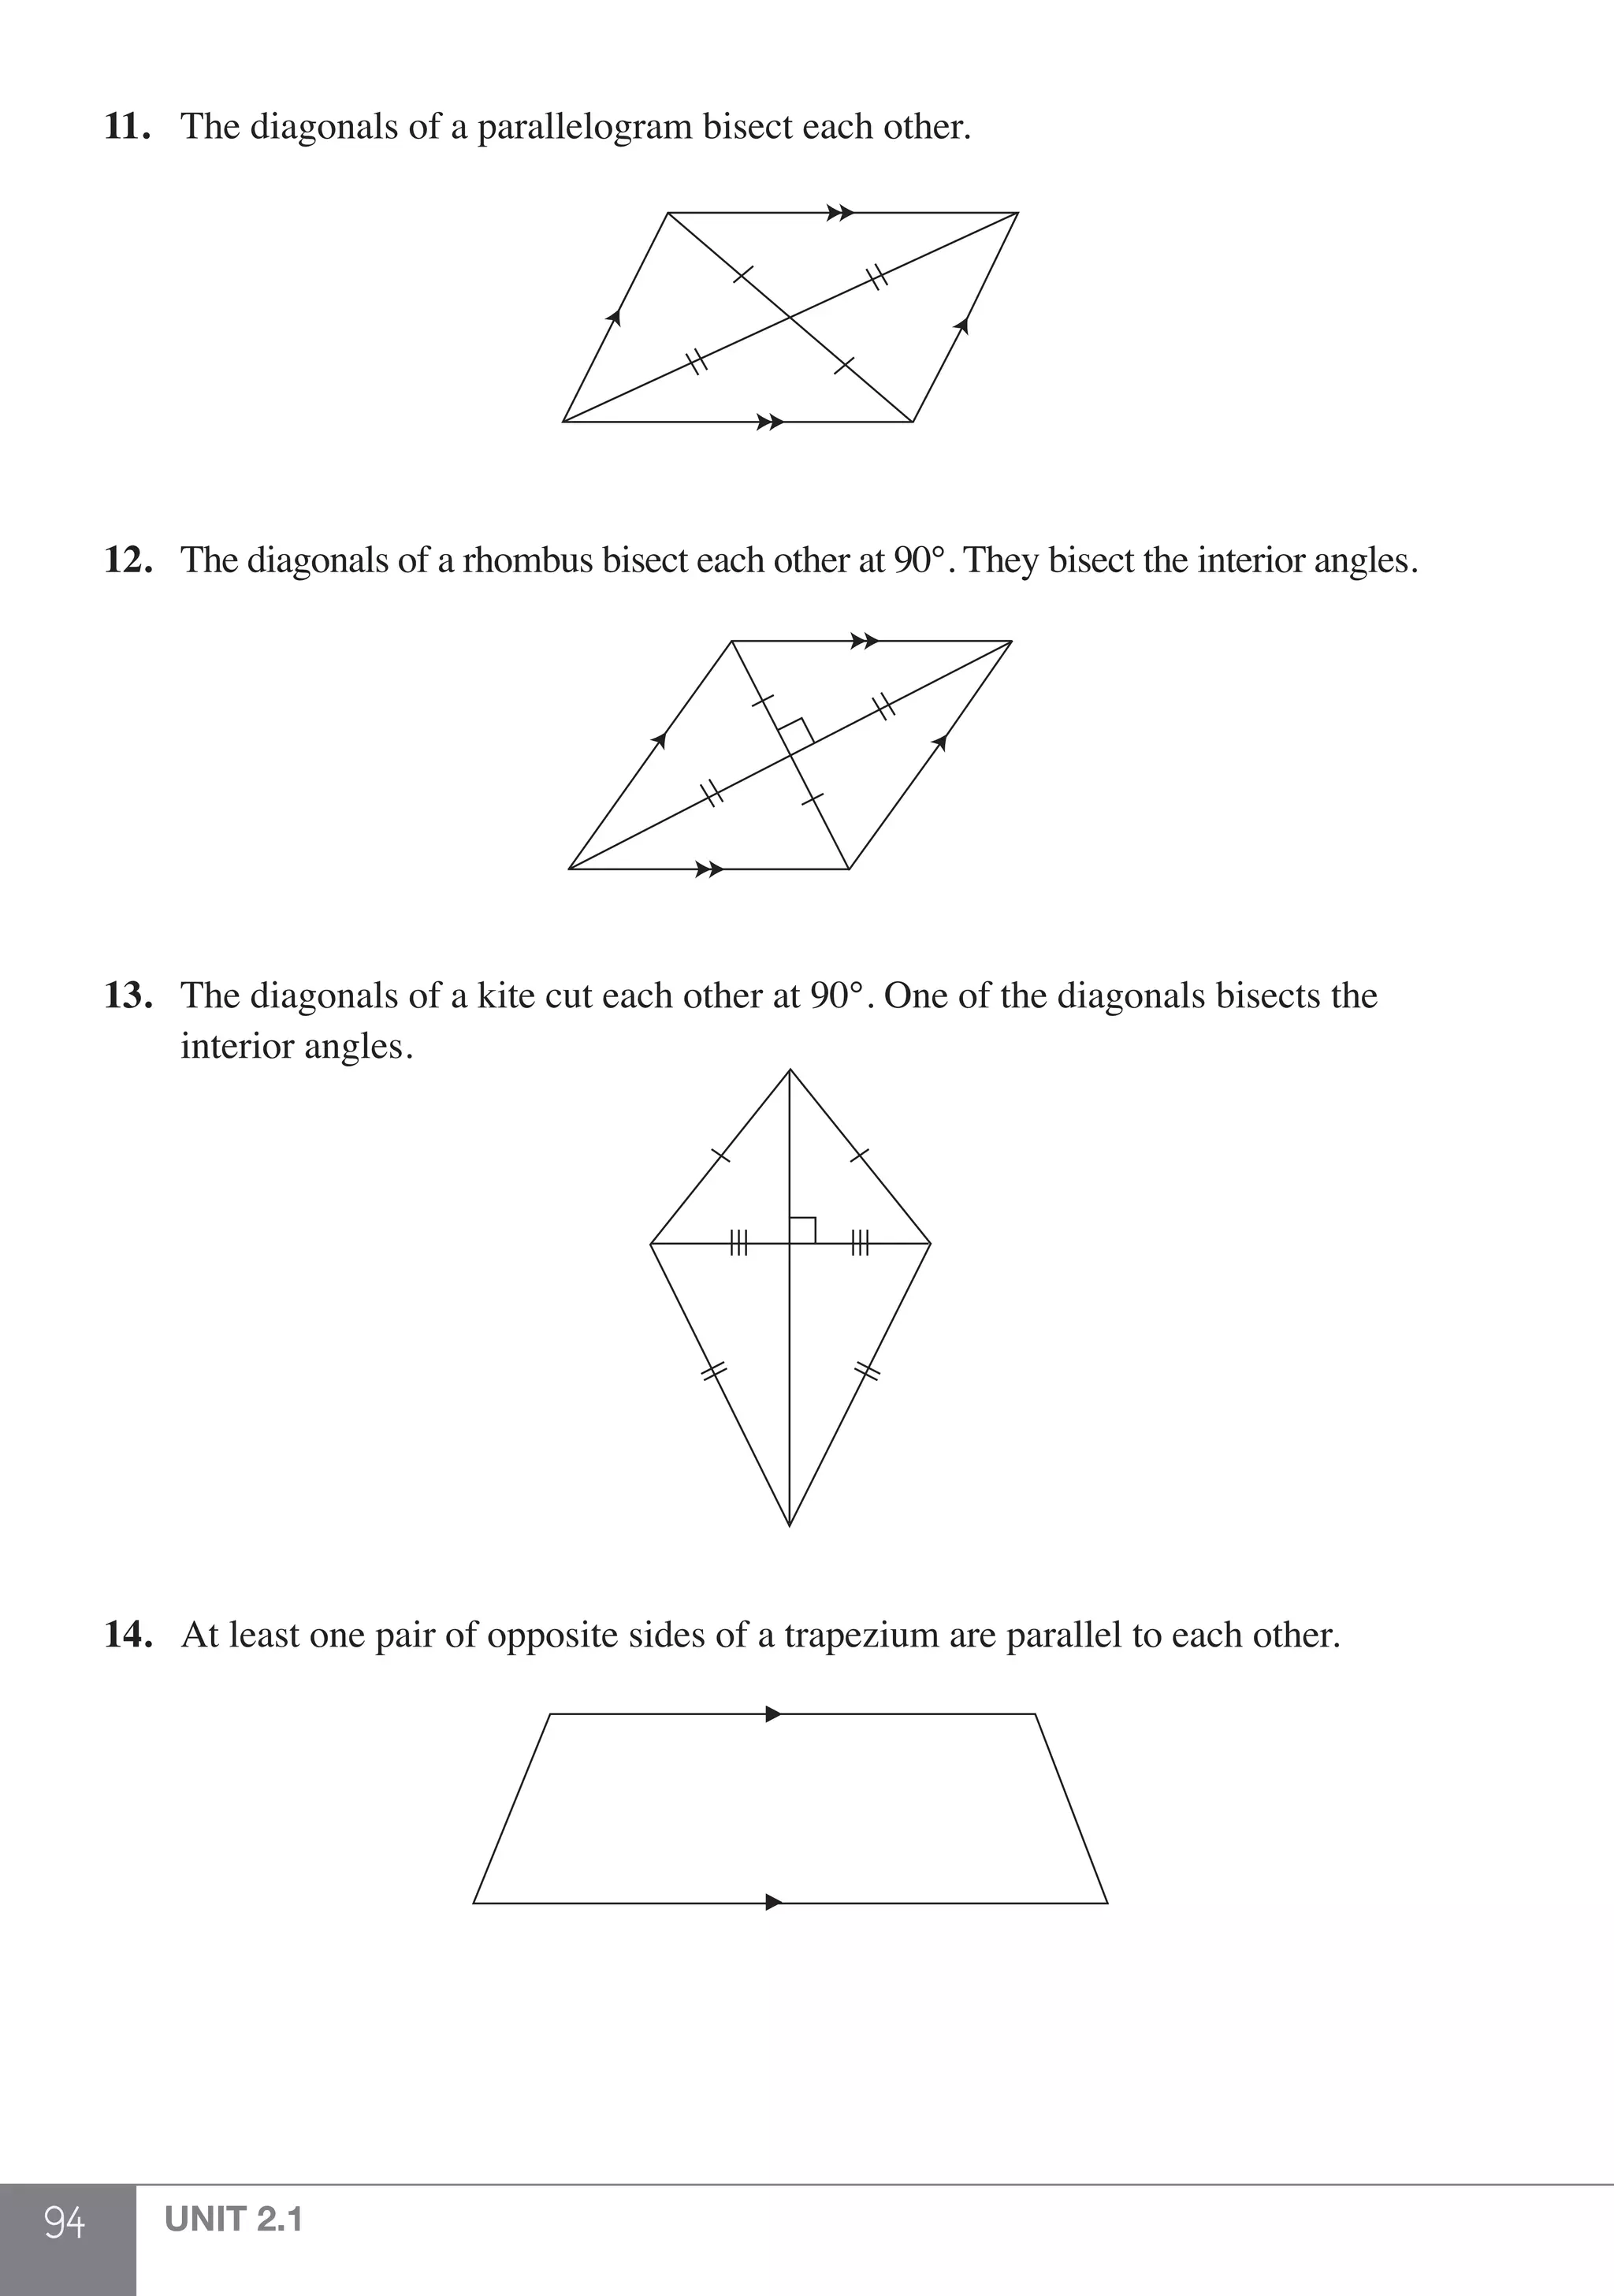
![12 UNIT 1.1
Laws of Arithmetic
31. a + b = b + a (Commutative Law)
a × b = b × a
(p + q) + r = p + (q + r) (Associative Law)
(p × q) × r = p × (q × r)
p × (q + r) = p × q + p × r (Distributive Law)
32. When we have a few operations in an equation, take note of the order of operations
as shown.
Step 1: Work out the expression in the brackets first. When there is more than
1 pair of brackets, work out the expression in the innermost brackets first.
Step 2: Calculate the powers and roots.
Step 3: Divide and multiply from left to right.
Step 4: Add and subtract from left to right.
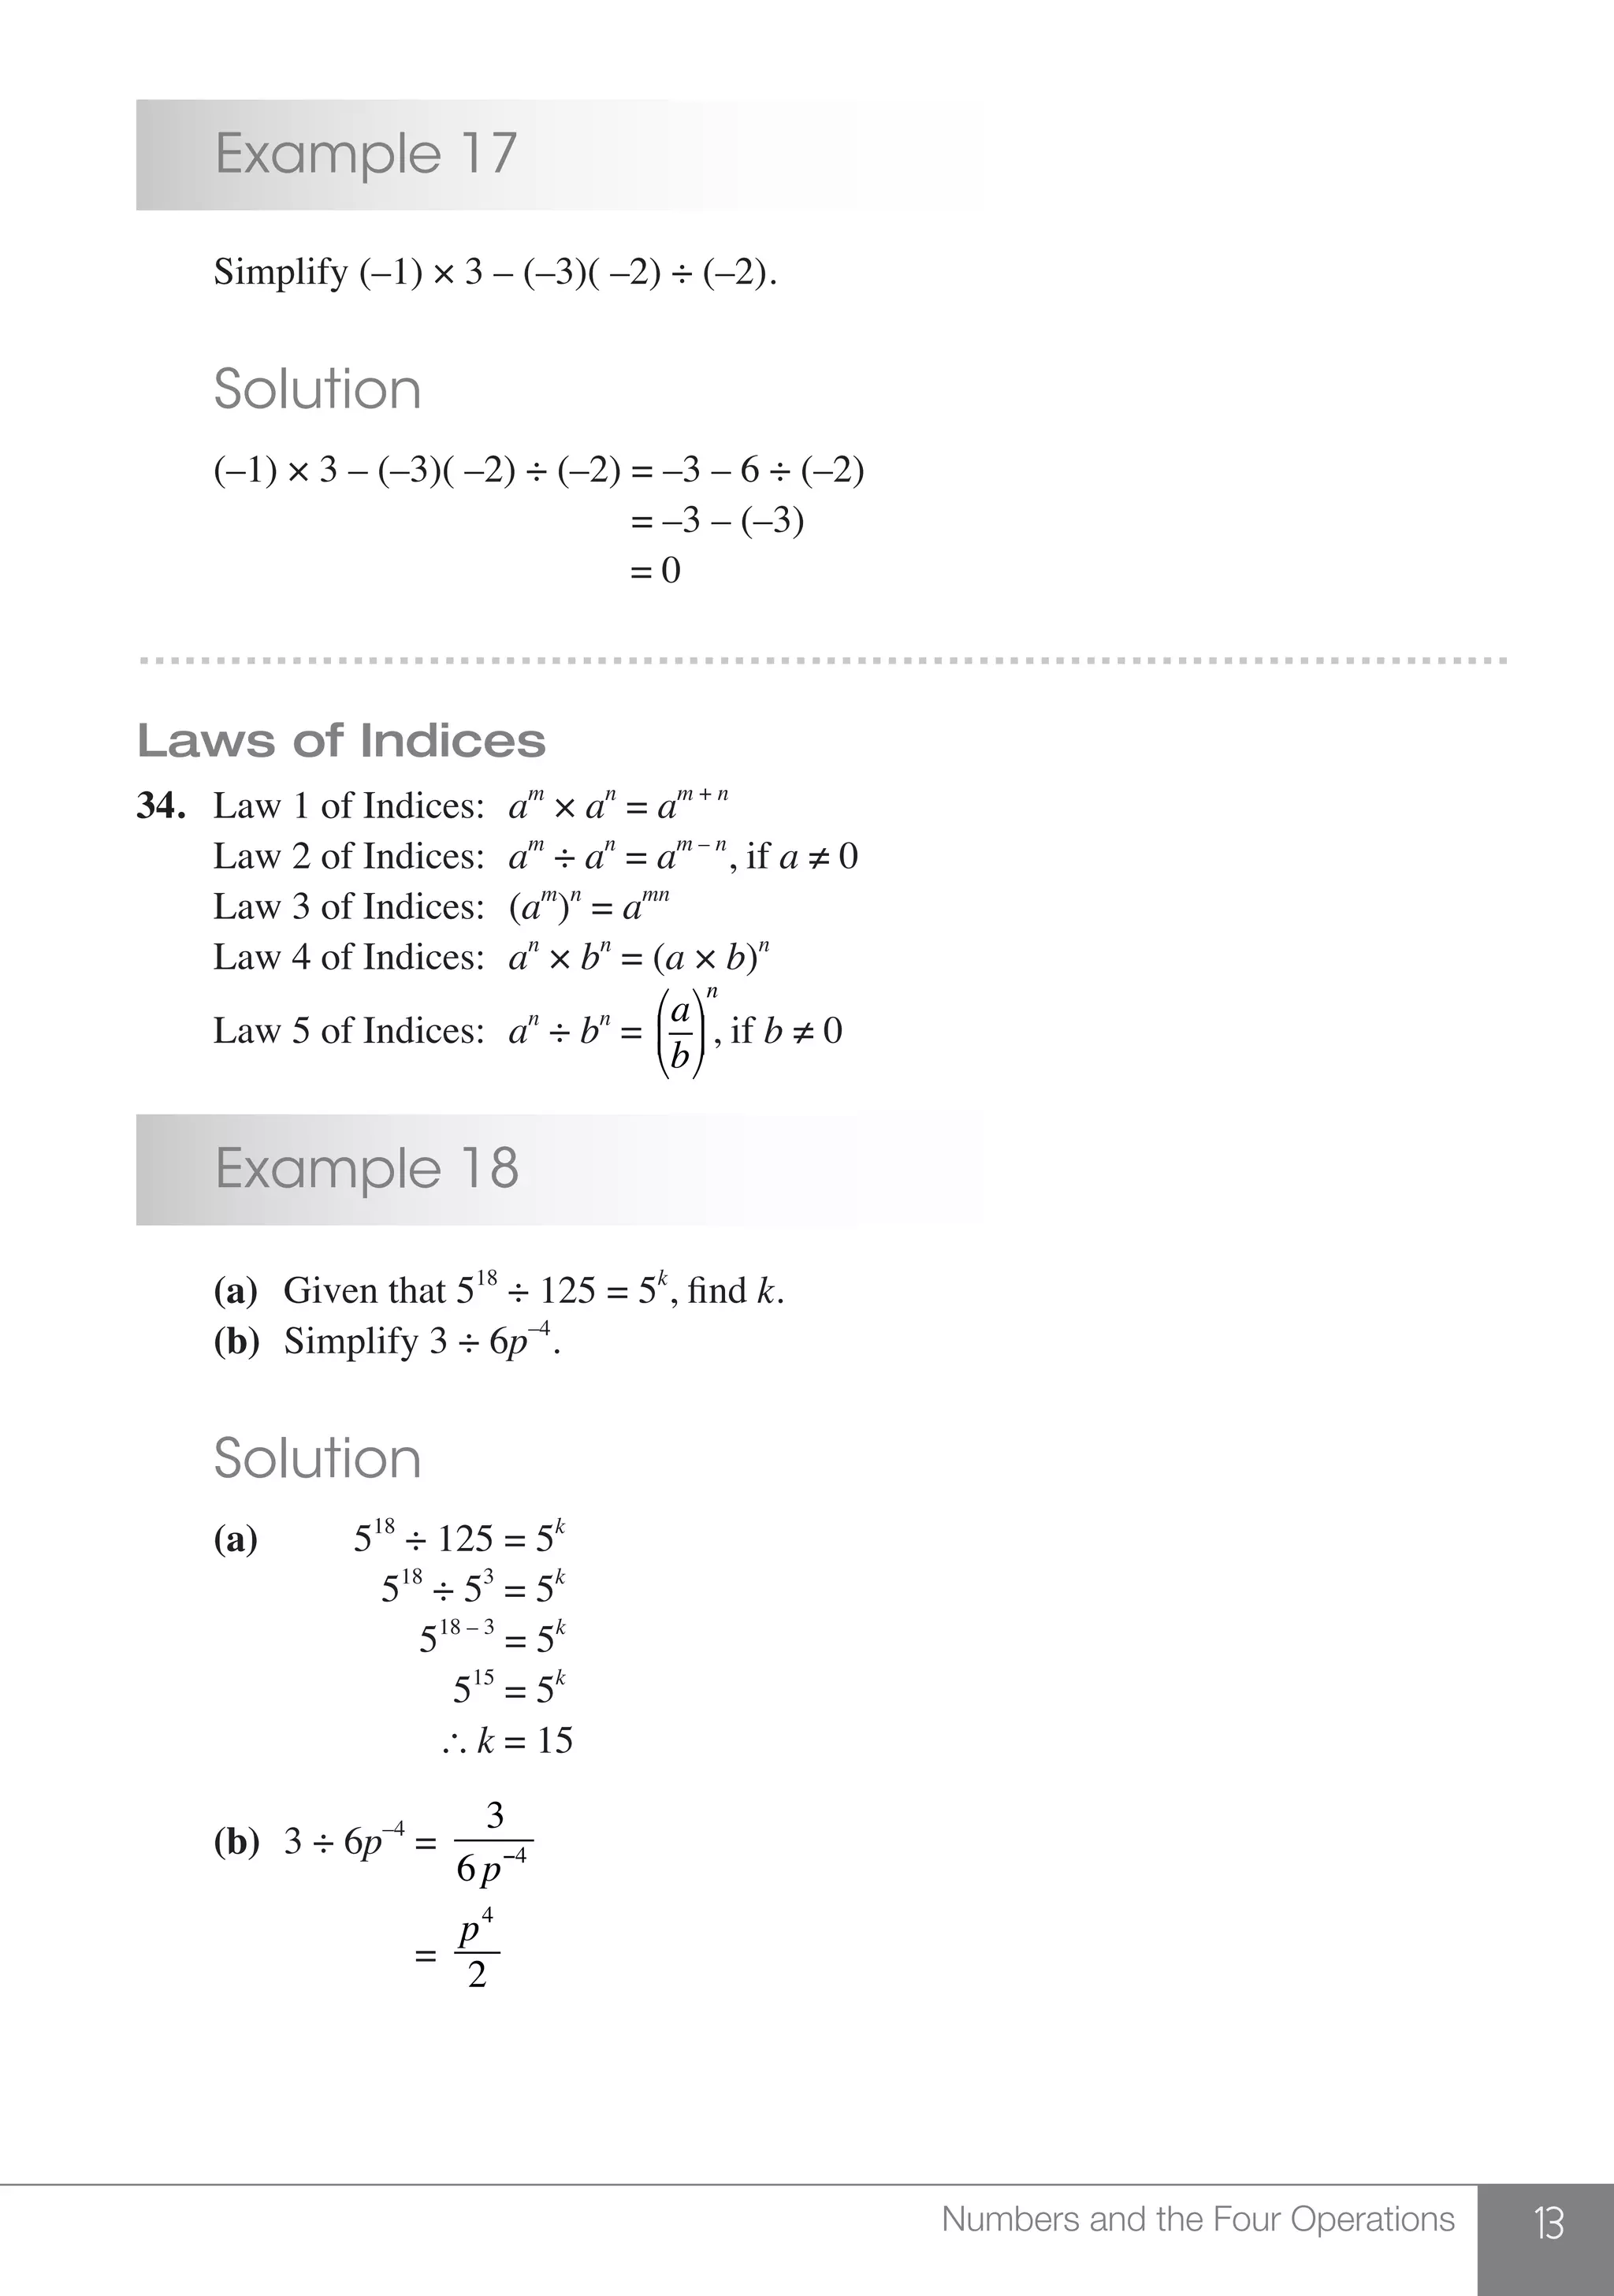
Example 16
Calculate the value of the following.
(a) 2 + (52
– 4) ÷ 3 (b) 14 – [45 – (26 + 16)] ÷ 5
Solution
(a) 2 + (52
– 4) ÷ 3 = 2 + (25 – 4) ÷ 3 (Power)
= 2 + 21 ÷ 3 (Brackets)
= 2 + 7 (Divide)
= 9 (Add)
(b) 14 – [45 – (26 + 16)] ÷ 5 = 14 – [45 – (26 + 4)] ÷ 5 (Roots)
= 14 – [45 – 30] ÷ 5 (Innermost brackets)
= 14 – 15 ÷ 5 (Brackets)
= 14 – 3 (Divide)
= 11 (Subtract)
………………………………………………………………………………
33. positive number × positive number = positive number
negative number × negative number = positive number
negative number × positive number = negative number
positive number ÷ positive number = positive number
negative number ÷ negative number = positive number
positive number ÷ negative number = negative number](https://image.slidesharecdn.com/topicalrevisionnotesmathematicsolevelpdfdrive-191116113934/75/mathematics-o-level-book-18-2048.jpg)


![101 math short cuts [www.onlinebcs.com]](https://cdn.slidesharecdn.com/ss_thumbnails/101mathshortcutswww-210201035025-thumbnail.jpg?width=640&height=640&fit=bounds)


