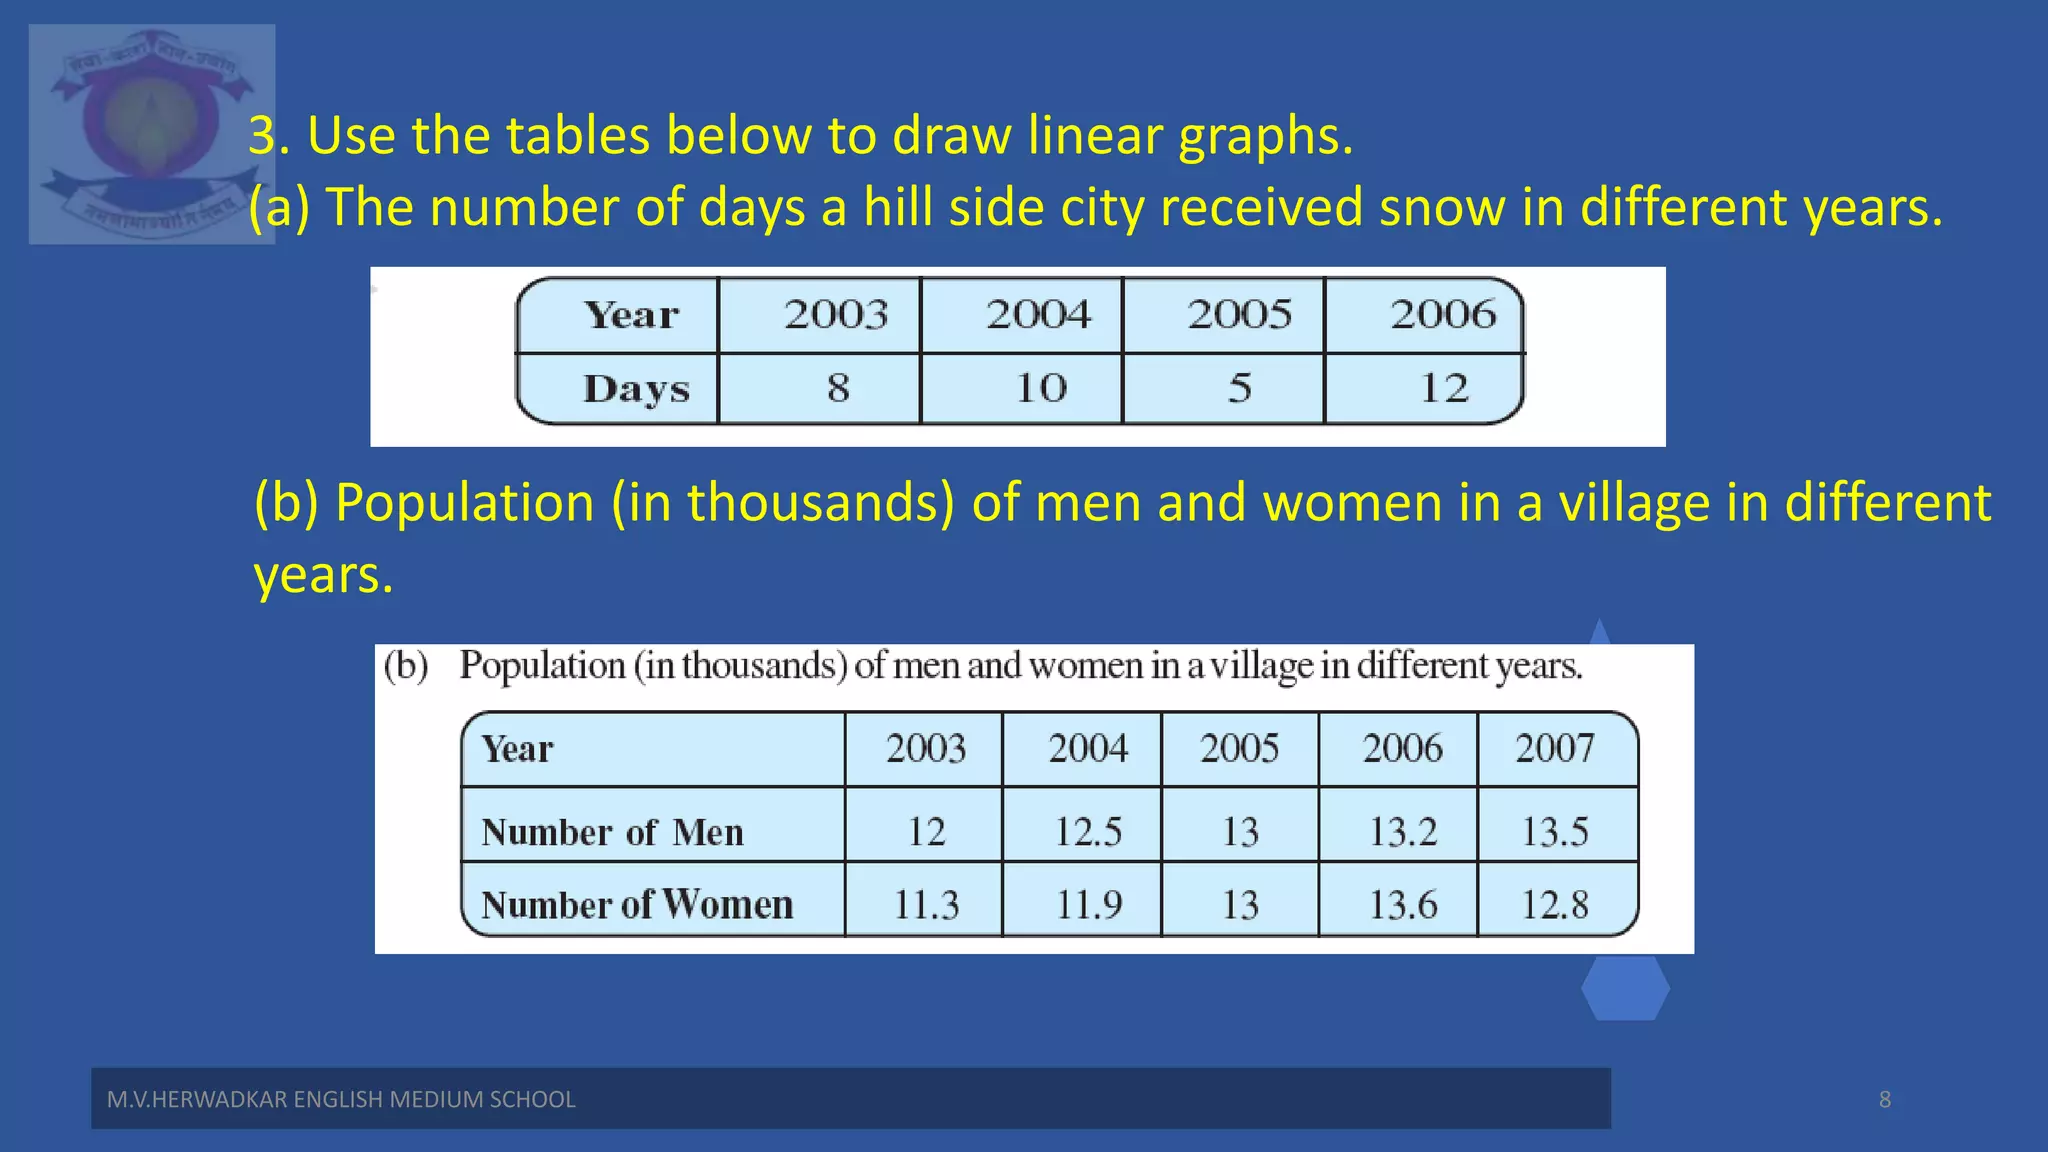
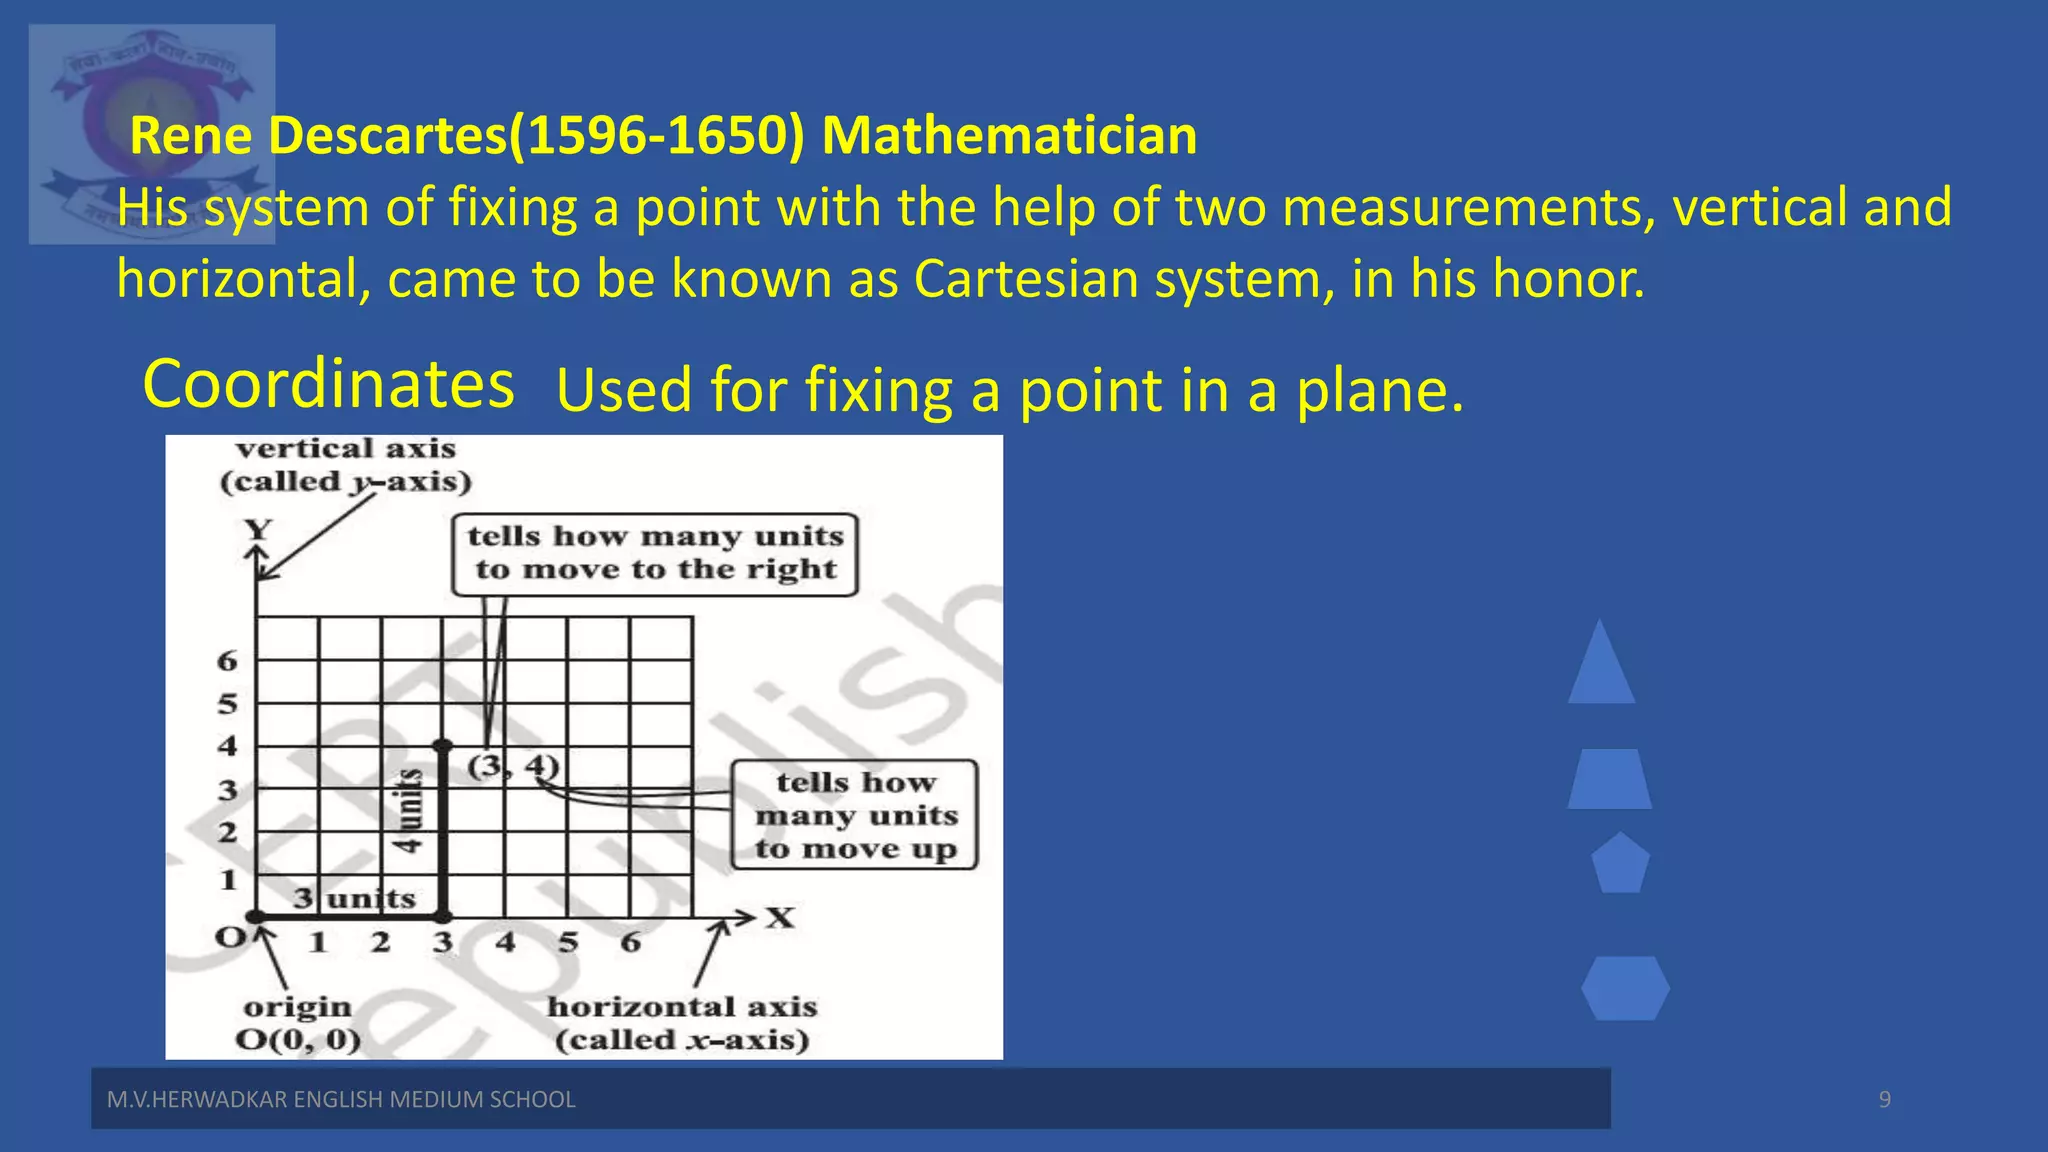
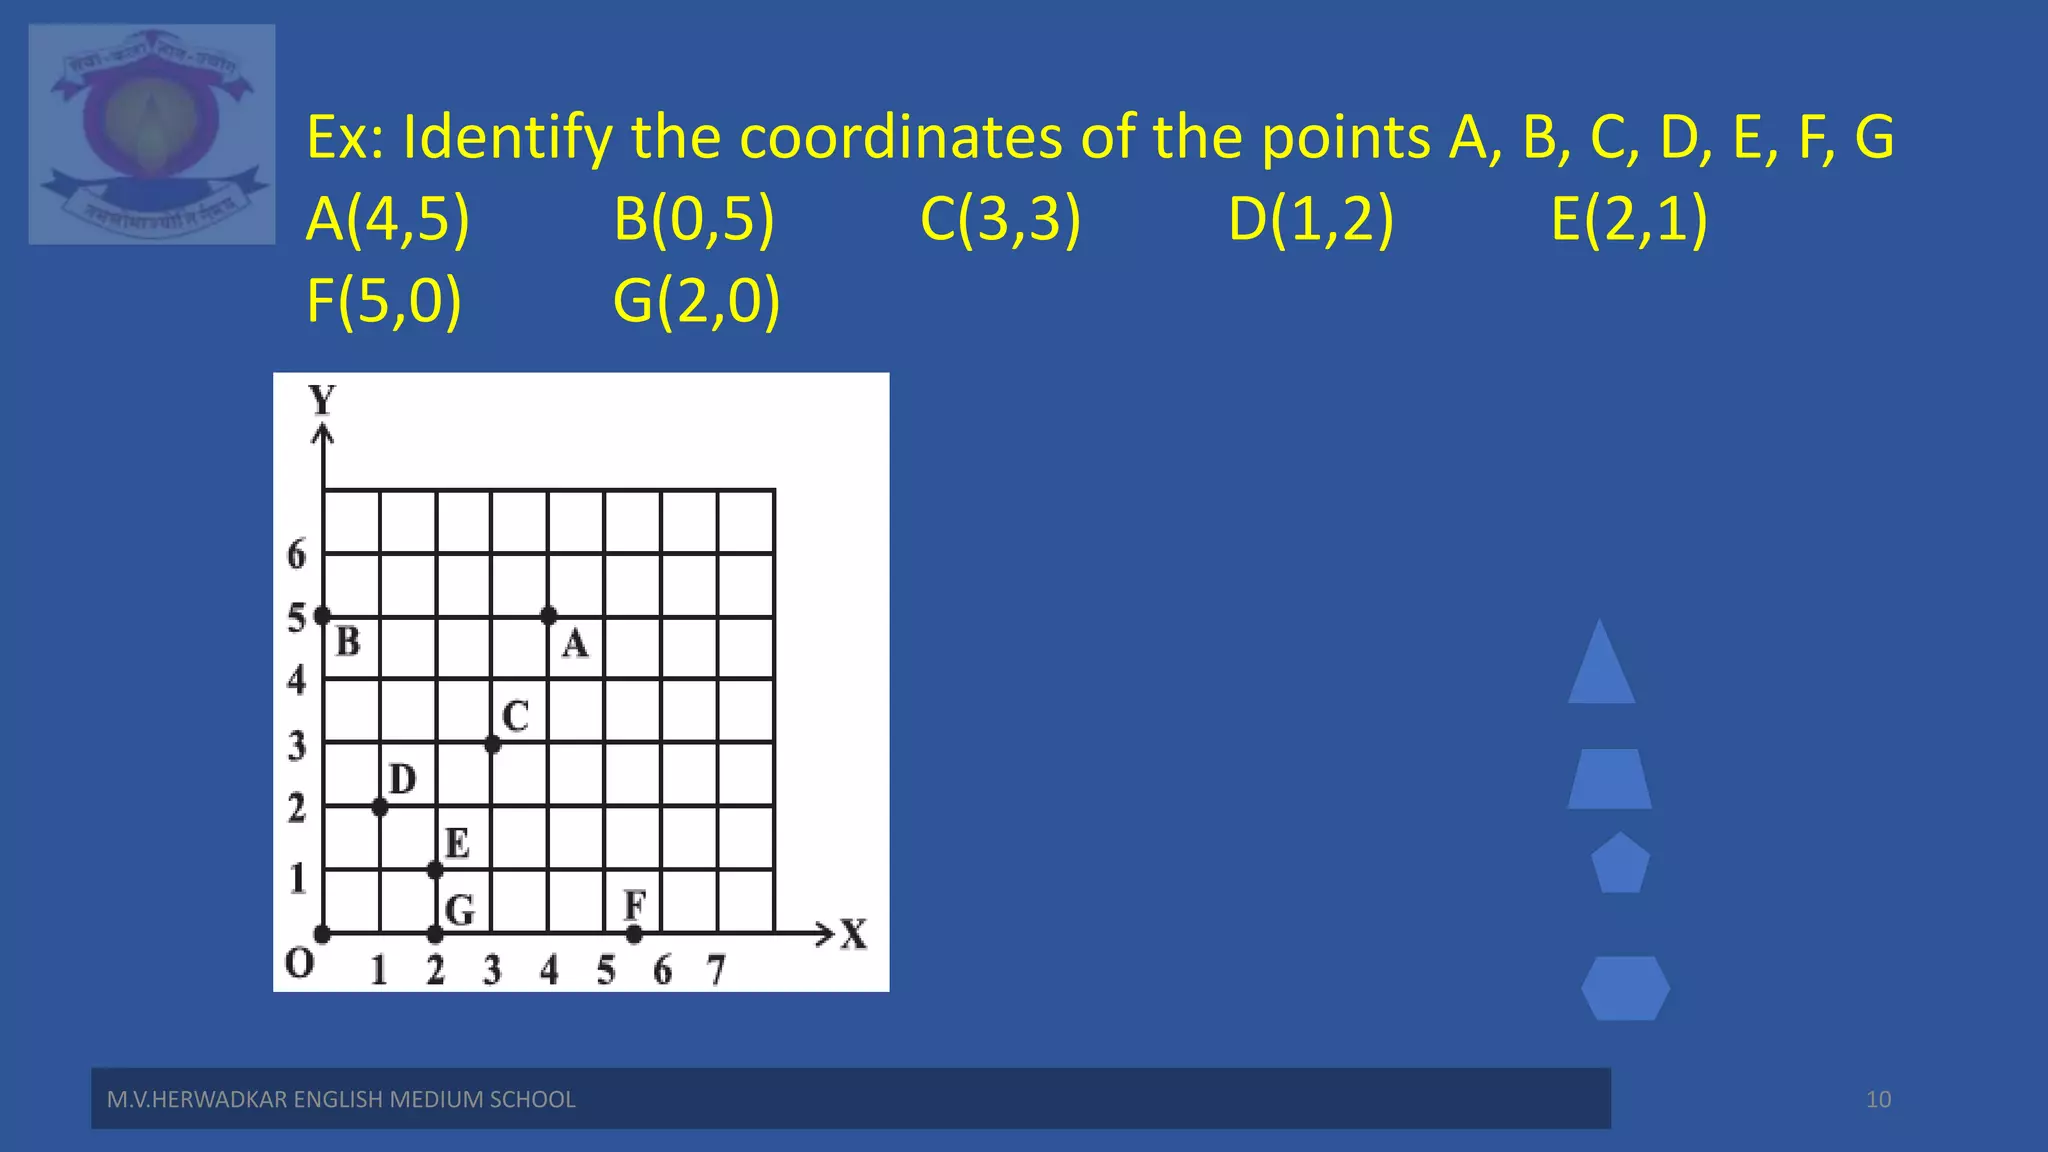
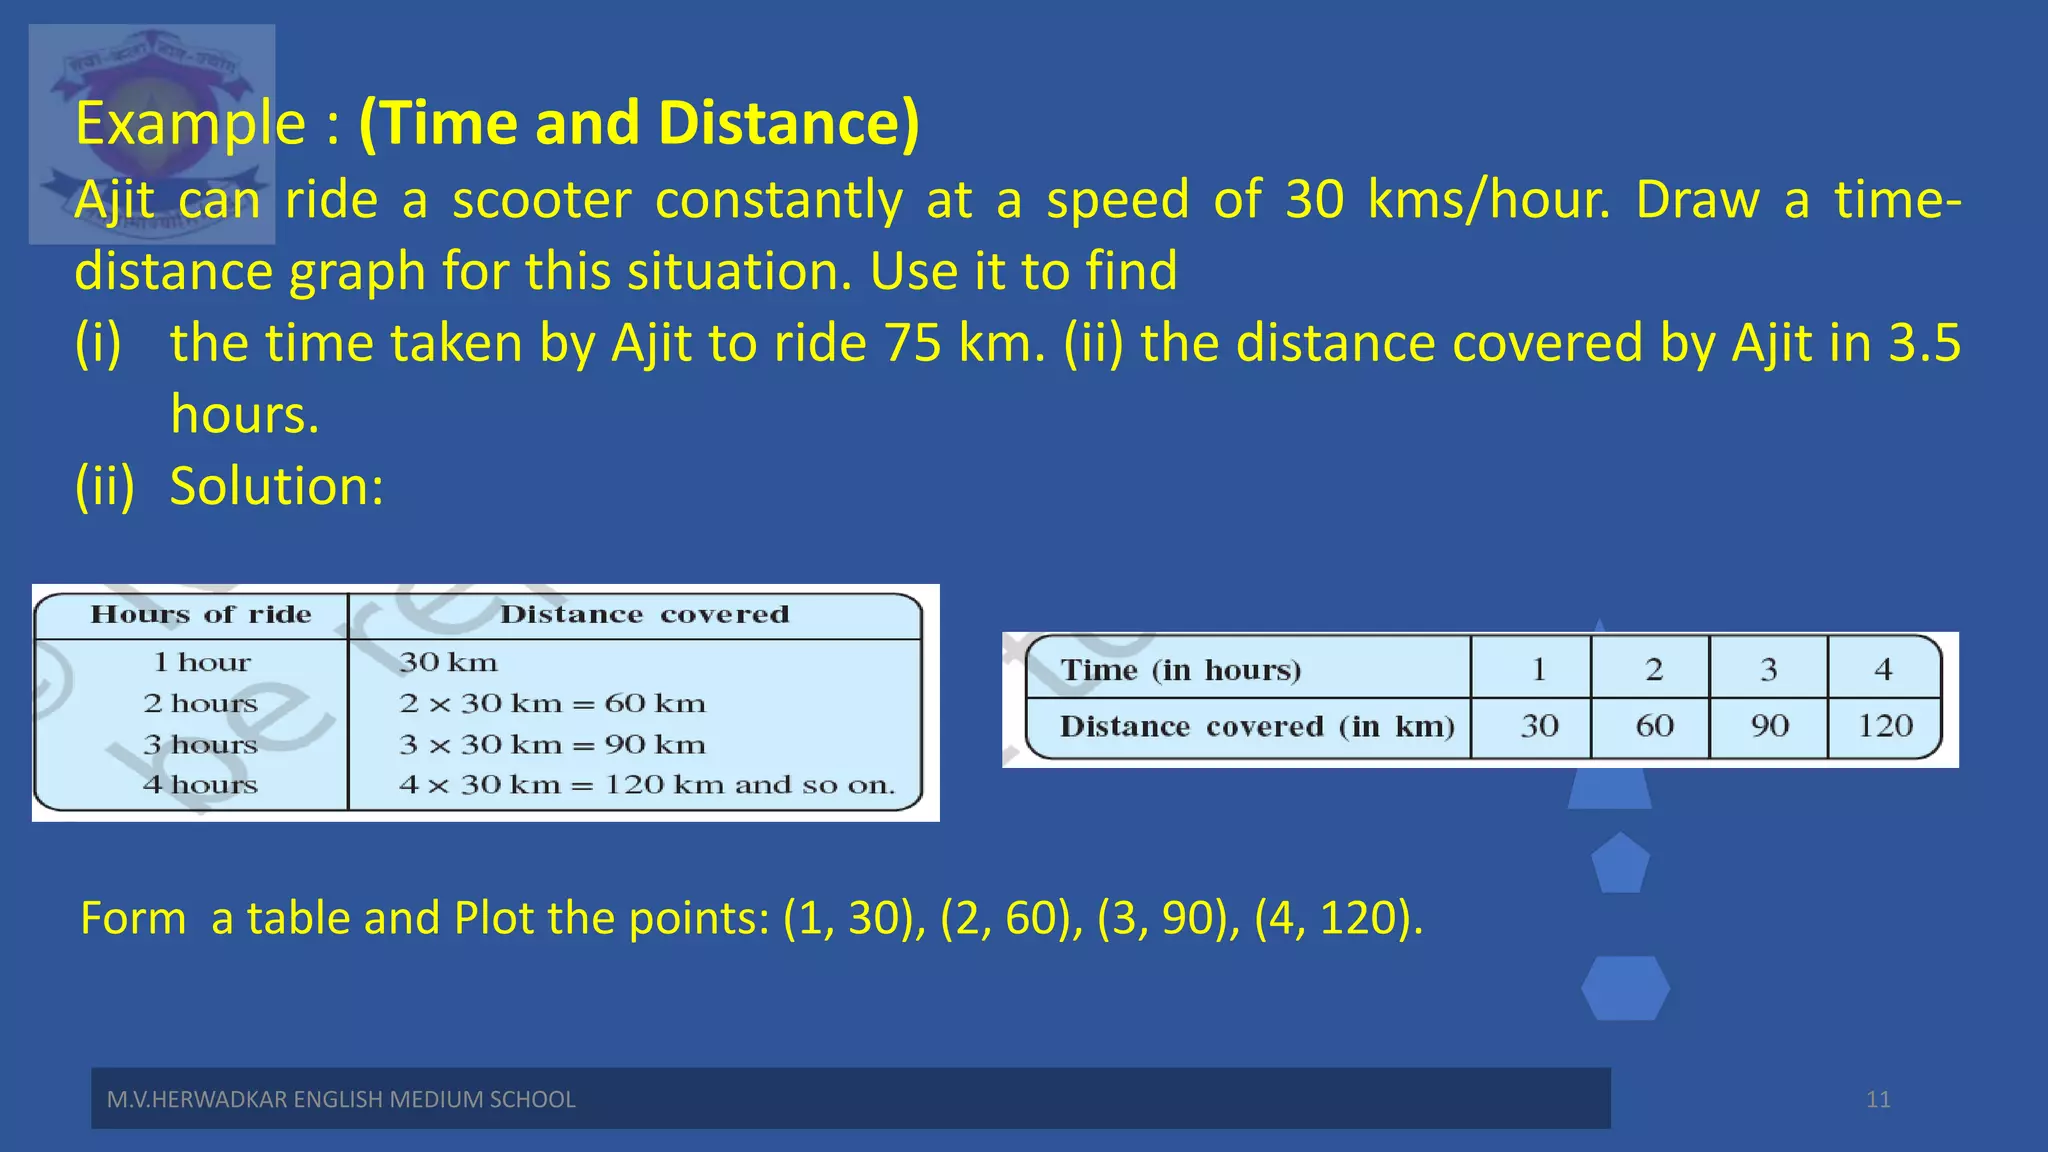
B.J.P.S Samiti’s
M.V.HERWADKAR ENGLISH MEDIUM HIGH SCHOOL
Introduction to Graphs
Program:
Semester:
Course: NAME OF THE COURSE
Sandhya S.Kulkarni 1
Introduction to Graphs
M.V.HERWADKAR ENGLISH MEDIUM SCHOOL 2
The purpose of the graph is to show numerical facts in visual
form so that they can be understood quickly, easily and
clearly.
A Bar graph
• A bar graph is used to show comparison among categories. It
may consist of two or more parallel vertical (or horizontal)
bars (rectangles) as shown.
Bar graph Double bar graph
M.V.HERWADKAR ENGLISH MEDIUM SCHOOL 3
Pie graph(circle-graph)
A pie-graph is used to compare parts of a whole.
M.V.HERWADKAR ENGLISH MEDIUM SCHOOL 4
Percentage of viewers watching different types of TV channels
Histogram
A Histogram is a bar graph that shows data in intervals.
It has adjacent bars over the intervals.
M.V.HERWADKAR ENGLISH MEDIUM SCHOOL 5
Line graph
M.V.HERWADKAR ENGLISH MEDIUM SCHOOL 6
M.V.HERWADKAR ENGLISH MEDIUM SCHOOL 7
1. The following graph shows the temperature of a patient in a hospital,
recorded every hour.
(a) What was the patient’s temperature at 1 p.m. ?
(b) When was the patient’s temperature 38.5° C?
(c) The patient’s temperature was the same two
times during the period given. What were these two
times?
M.V.HERWADKAR ENGLISH MEDIUM SCHOOL 8
3. Use the tables below to draw linear graphs.
(a) The number of days a hill side city received snow in different years.
(b) Population (in thousands) of men and women in a village in different
years.
M.V.HERWADKAR ENGLISH MEDIUM SCHOOL 9
Rene Descartes(1596-1650) Mathematician
His system of fixing a point with the help of two measurements, vertical and
horizontal, came to be known as Cartesian system, in his honor.
Coordinates Used for fixing a point in a plane.
M.V.HERWADKAR ENGLISH MEDIUM SCHOOL 10
Ex: Identify the coordinates of the points A, B, C, D, E, F, G
A(4,5) B(0,5) C(3,3) D(1,2) E(2,1)
F(5,0) G(2,0)
M.V.HERWADKAR ENGLISH MEDIUM SCHOOL 11
Example : (Time and Distance)
Ajit can ride a scooter constantly at a speed of 30 kms/hour. Draw a time-
distance graph for this situation. Use it to find
(i) the time taken by Ajit to ride 75 km. (ii) the distance covered by Ajit in 3.5
hours.
(ii) Solution:
Form a table and Plot the points: (1, 30), (2, 60), (3, 90), (4, 120).
M.V.HERWADKAR ENGLISH MEDIUM SCHOOL 12
Example : Plot the following points and verify if they lie on a line. If they lie
on a line,name it.
(i) A (1, 1), B (1, 2), C (1, 3), D (1, 4)
(ii) A(0, 0), B(1, 1), C(2, 2), D(3, 3)
Graph obtained by joining the plotted points is a line. Such graphs are called
linear graphs.
M.V.HERWADKAR ENGLISH MEDIUM SCHOOL 13
1. Graphical presentation of data is easier to understand.
2. (i) A bar graph is used to show comparison among categories.
(ii) A pie graph is used to compare parts of a whole.
(iii) A Histogram is a bar graph that shows data in intervals.
3. A line graph displays data that changes continuously over periods of time.
4. A line graph which is a whole unbroken line is called a linear graph.
5. For fixing a point on the graph sheet we need, x-coordinate and y-
coordinate.
6. The relation between dependent variable and independent variable is
shown through a graph.

MATH8 Intro. to Graphs.pptx

  • 1.
    B.J.P.S Samiti’s M.V.HERWADKAR ENGLISHMEDIUM HIGH SCHOOL Introduction to Graphs Program: Semester: Course: NAME OF THE COURSE Sandhya S.Kulkarni 1
  • 2.
    Introduction to Graphs M.V.HERWADKARENGLISH MEDIUM SCHOOL 2 The purpose of the graph is to show numerical facts in visual form so that they can be understood quickly, easily and clearly. A Bar graph • A bar graph is used to show comparison among categories. It may consist of two or more parallel vertical (or horizontal) bars (rectangles) as shown.
  • 3.
    Bar graph Doublebar graph M.V.HERWADKAR ENGLISH MEDIUM SCHOOL 3
  • 4.
    Pie graph(circle-graph) A pie-graphis used to compare parts of a whole. M.V.HERWADKAR ENGLISH MEDIUM SCHOOL 4 Percentage of viewers watching different types of TV channels
  • 5.
    Histogram A Histogram isa bar graph that shows data in intervals. It has adjacent bars over the intervals. M.V.HERWADKAR ENGLISH MEDIUM SCHOOL 5
  • 6.
  • 7.
    M.V.HERWADKAR ENGLISH MEDIUMSCHOOL 7 1. The following graph shows the temperature of a patient in a hospital, recorded every hour. (a) What was the patient’s temperature at 1 p.m. ? (b) When was the patient’s temperature 38.5° C? (c) The patient’s temperature was the same two times during the period given. What were these two times?
  • 8.
    M.V.HERWADKAR ENGLISH MEDIUMSCHOOL 8 3. Use the tables below to draw linear graphs. (a) The number of days a hill side city received snow in different years. (b) Population (in thousands) of men and women in a village in different years.
  • 9.
    M.V.HERWADKAR ENGLISH MEDIUMSCHOOL 9 Rene Descartes(1596-1650) Mathematician His system of fixing a point with the help of two measurements, vertical and horizontal, came to be known as Cartesian system, in his honor. Coordinates Used for fixing a point in a plane.
  • 10.
    M.V.HERWADKAR ENGLISH MEDIUMSCHOOL 10 Ex: Identify the coordinates of the points A, B, C, D, E, F, G A(4,5) B(0,5) C(3,3) D(1,2) E(2,1) F(5,0) G(2,0)
  • 11.
    M.V.HERWADKAR ENGLISH MEDIUMSCHOOL 11 Example : (Time and Distance) Ajit can ride a scooter constantly at a speed of 30 kms/hour. Draw a time- distance graph for this situation. Use it to find (i) the time taken by Ajit to ride 75 km. (ii) the distance covered by Ajit in 3.5 hours. (ii) Solution: Form a table and Plot the points: (1, 30), (2, 60), (3, 90), (4, 120).
  • 12.
    M.V.HERWADKAR ENGLISH MEDIUMSCHOOL 12 Example : Plot the following points and verify if they lie on a line. If they lie on a line,name it. (i) A (1, 1), B (1, 2), C (1, 3), D (1, 4) (ii) A(0, 0), B(1, 1), C(2, 2), D(3, 3) Graph obtained by joining the plotted points is a line. Such graphs are called linear graphs.
  • 13.
    M.V.HERWADKAR ENGLISH MEDIUMSCHOOL 13 1. Graphical presentation of data is easier to understand. 2. (i) A bar graph is used to show comparison among categories. (ii) A pie graph is used to compare parts of a whole. (iii) A Histogram is a bar graph that shows data in intervals. 3. A line graph displays data that changes continuously over periods of time. 4. A line graph which is a whole unbroken line is called a linear graph. 5. For fixing a point on the graph sheet we need, x-coordinate and y- coordinate. 6. The relation between dependent variable and independent variable is shown through a graph.